

MEL Ameliorates Post-SAH Cerebral Vasospasm by Affecting the Expression of eNOS and HIF1α via H19/miR-138/eNOS/NO and H19/miR-675/HIF1α
- PMID: 31927306
- PMCID: PMC6953775
- DOI: 10.1016/j.omtn.2019.12.002
MEL Ameliorates Post-SAH Cerebral Vasospasm by Affecting the Expression of eNOS and HIF1α via H19/miR-138/eNOS/NO and H19/miR-675/HIF1α
Abstract
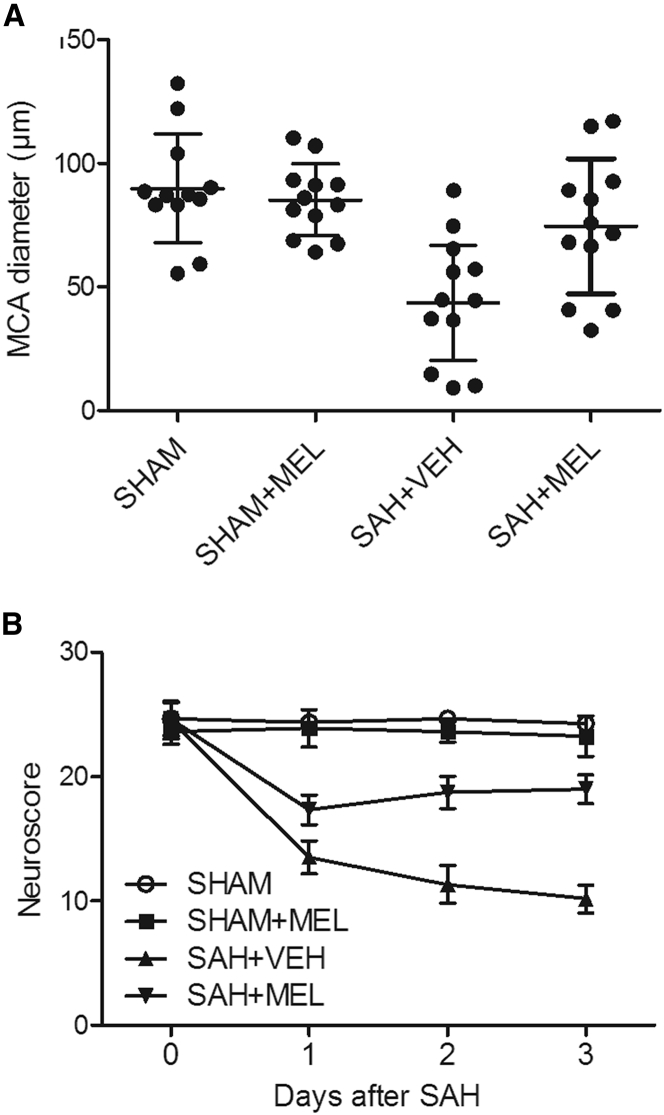
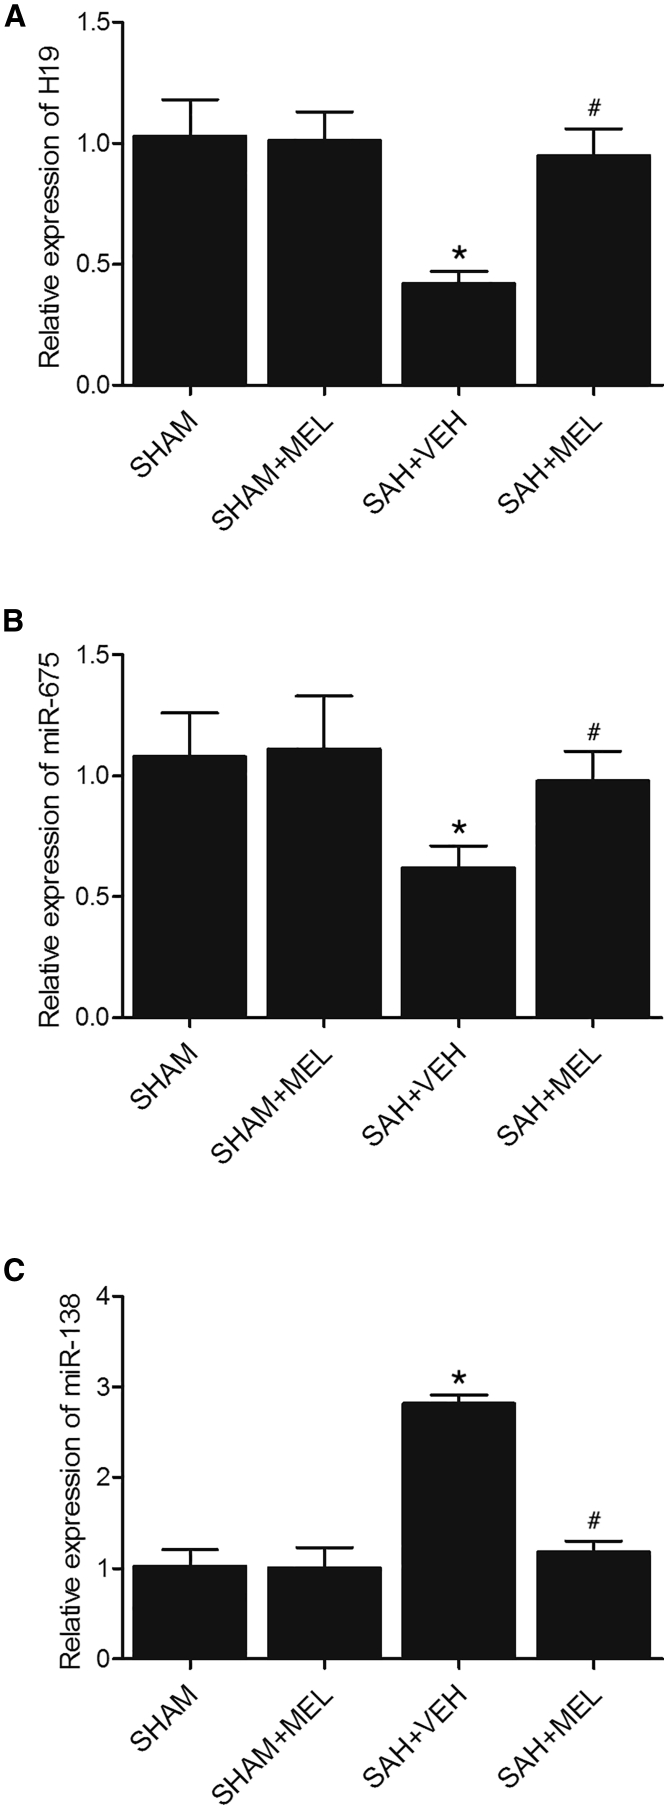
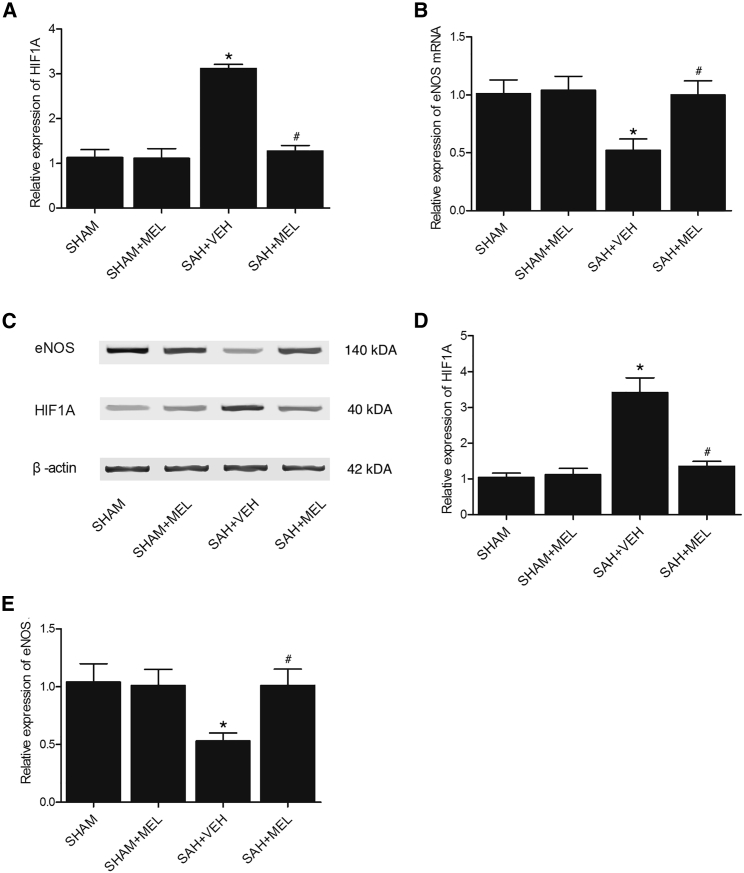
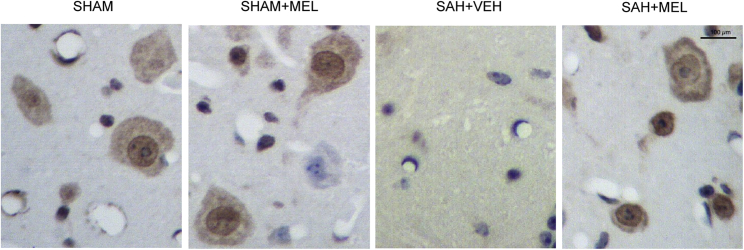
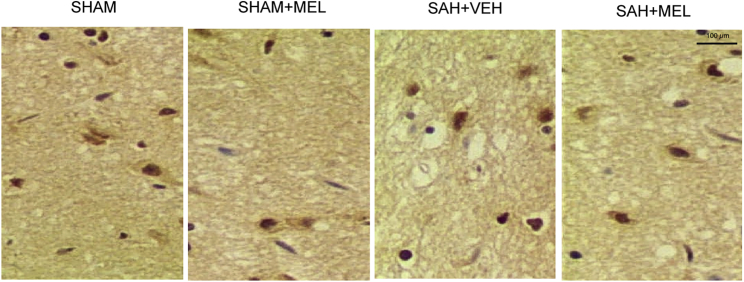
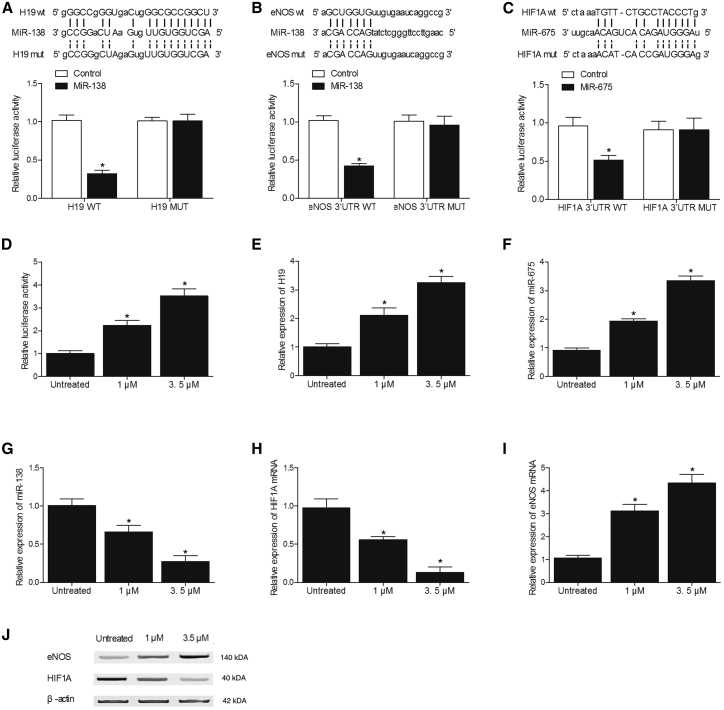
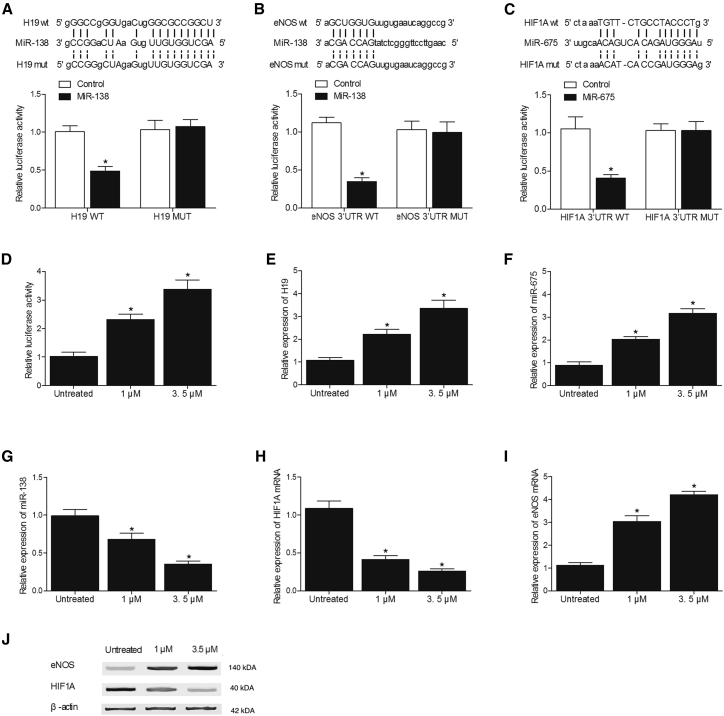
Melatonin (MEL) has been demonstrated to exert a protective effect against subarachnoid hemorrhage (SAH), and nitric oxide (NO) has been shown to play an important role in the pathogenesis of vasospasm. This study aims to explore the underlying molecular mechanisms of MEL in the control of vasospasm following SAH. MEL administration attenuates SAH-induced vasospasm and neurobehavioral deficits. Expressions of H19, eNOS, and miR-675 are low in the SAH group, while expressions of miR-138 and HIF1α are high in the SAH group. Also, MEL treatment upon SAH rats completely restores the dysregulation of H19, eNOS, miR-675, miR-138, and HIF1α to their normal levels. Moreover, MEL dose dependently increases the luciferase activity of H19 promoter and hence the expression of H19. Additionally, H19 directly targets miR-675 and miR-138 to increase miR-675 expression and inhibit miR-138 expression. As virtual target genes of miR-675 and miR-138, respectively, HIF1α and eNOS are also regulated by the treatment with MEL. In particular, MEL treatment increases the expression of miR-675 and eNOS level while decreasing the expression of miR-138 and HIF1α in a dose dependent manner. Our study found that MEL ameliorates post-SAH vasospasm by regulating the expression of eNOS and HIF1α via the H19/miR-138/eNOS/NO and H19/miR-675/HIF1α signaling pathways.
Keywords: H19; HIF1α; eNOS; melatonin; miR-138; miR-675; post-SAH vasospasm.
Copyright © 2019 The Author(s). Published by Elsevier Inc. All rights reserved.
Figures
Similar articles
-
Melatonin affects hypoxia-inducible factor 1α and ameliorates delayed brain injury following subarachnoid hemorrhage via H19/miR-675/HIF1A/TLR4.Bioengineered. 2022 Feb;13(2):4235-4247. doi: 10.1080/21655979.2022.2027175. Bioengineered. 2022. PMID: 35170388 Free PMC article.
-
Long non-coding RNA and microRNA-675/let-7a mediates the protective effect of melatonin against early brain injury after subarachnoid hemorrhage via targeting TP53 and neural growth factor.Cell Death Dis. 2018 Jan 24;9(2):99. doi: 10.1038/s41419-017-0155-8. Cell Death Dis. 2018. PMID: 29367587 Free PMC article.
-
Therapeutic effect of and mechanisms underlying the effect of miR-195-5p on subarachnoid hemorrhage-induced vasospasm and brain injury in rats.PeerJ. 2021 Jun 22;9:e11395. doi: 10.7717/peerj.11395. eCollection 2021. PeerJ. 2021. PMID: 34221706 Free PMC article.
-
Dysfunction of nitric oxide synthases as a cause and therapeutic target in delayed cerebral vasospasm after SAH.Neurol Res. 2006 Oct;28(7):730-7. doi: 10.1179/016164106X152052. Neurol Res. 2006. PMID: 17164036 Review.
-
Delayed cerebral vasospasm and nitric oxide: review, new hypothesis, and proposed treatment.Pharmacol Ther. 2005 Jan;105(1):23-56. doi: 10.1016/j.pharmthera.2004.10.002. Pharmacol Ther. 2005. PMID: 15626454 Review.
Cited by
-
The Role of miRNAs in Aneurysmal Subarachnoid Hemorrhage.Curr Mol Med. 2025;25(6):734-745. doi: 10.2174/0115665240306767240603091329. Curr Mol Med. 2025. PMID: 38847169 Review.
-
Long non-coding RNA CCDC144NL-AS1 promotes cell proliferation by regulating the miR-363-3p/GALNT7 axis in colorectal cancer.J Cancer. 2022 Jan 1;13(3):752-763. doi: 10.7150/jca.65885. eCollection 2022. J Cancer. 2022. PMID: 35154444 Free PMC article.
-
BMSCs Regulate Astrocytes through TSG-6 to Protect the Blood-Brain Barrier after Subarachnoid Hemorrhage.Mediators Inflamm. 2021 Jun 29;2021:5522291. doi: 10.1155/2021/5522291. eCollection 2021. Mediators Inflamm. 2021. PMID: 34305453 Free PMC article.
-
The multifaceted actions of the lncRNA H19 in cardiovascular biology and diseases.Clin Sci (Lond). 2022 Aug 12;136(15):1157-1178. doi: 10.1042/CS20210994. Clin Sci (Lond). 2022. PMID: 35946958 Free PMC article. Review.
-
Role of S100 and YKL40 on Intraventricular Cerebral Hemorrhages in the Preterm Infant and the Neuroprotective Role of miR-138- siRNAs-HIF-1a and miR-21-siRNAs-HVCN1 in Neonatal Mice with Nerve Injury.Curr Med Chem. 2024;31(34):5638-5656. doi: 10.2174/0929867331666230915103147. Curr Med Chem. 2024. PMID: 37724672
References
-
- van Gijn J., Kerr R.S., Rinkel G.J. Subarachnoid haemorrhage. Lancet. 2007;369:306–318. - PubMed
-
- King J.T., Jr. Epidemiology of aneurysmal subarachnoid hemorrhage. Neuroimaging Clin. N. Am. 1997;7:659–668. - PubMed
-
- Ingall T., Asplund K., Mähönen M., Bonita R. A multinational comparison of subarachnoid hemorrhage epidemiology in the WHO MONICA stroke study. Stroke. 2000;31:1054–1061. - PubMed
-
- Ersahin M., Toklu H.Z., Cetinel S., Yüksel M., Yeğen B.C., Sener G. Melatonin reduces experimental subarachnoid hemorrhage-induced oxidative brain damage and neurological symptoms. J. Pineal Res. 2009;46:324–332. - PubMed
-
- Ayer R.E., Sugawara T., Chen W., Tong W., Zhang J.H. Melatonin decreases mortality following severe subarachnoid hemorrhage. J. Pineal Res. 2008;44:197–204. - PubMed
LinkOut - more resources
Full Text Sources
Research Materials
