. 2020 Jan 13:9:e47428.
doi: 10.7554/eLife.47428.

The structure of species discrimination signals across a primate radiation

Affiliations

The structure of species discrimination signals across a primate radiation

Sandra Winters et al. Elife. .

Abstract

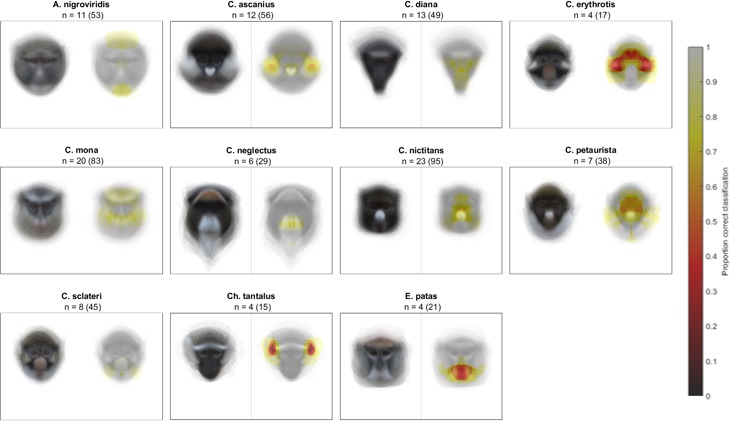
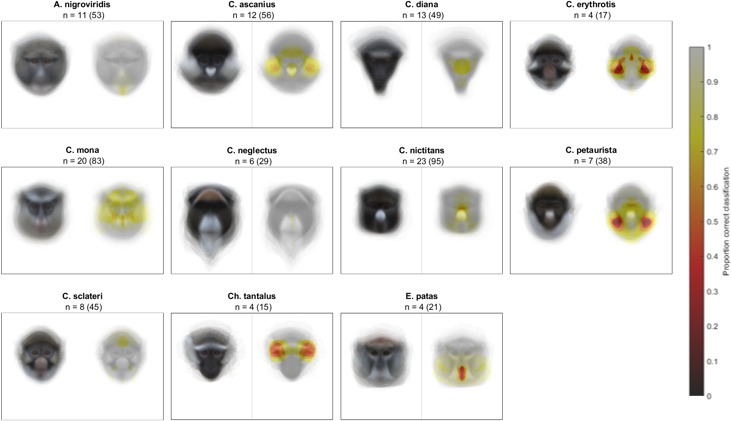
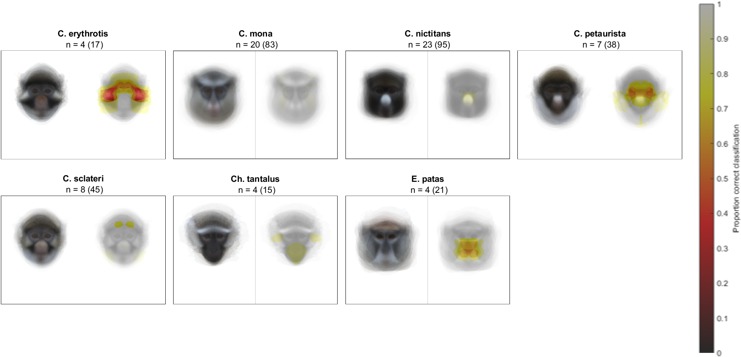
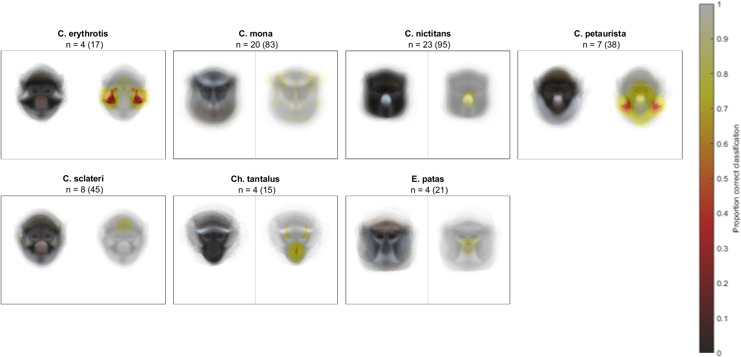
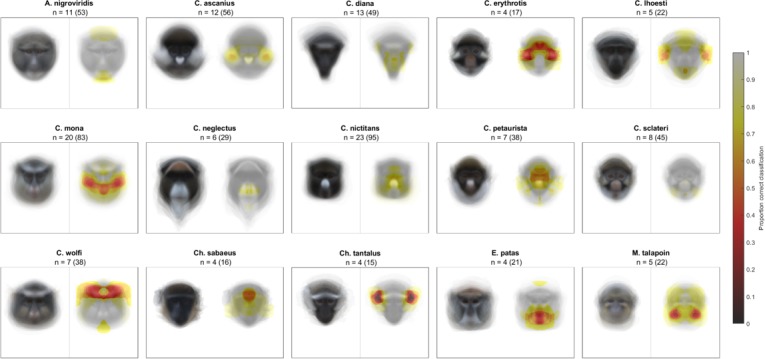
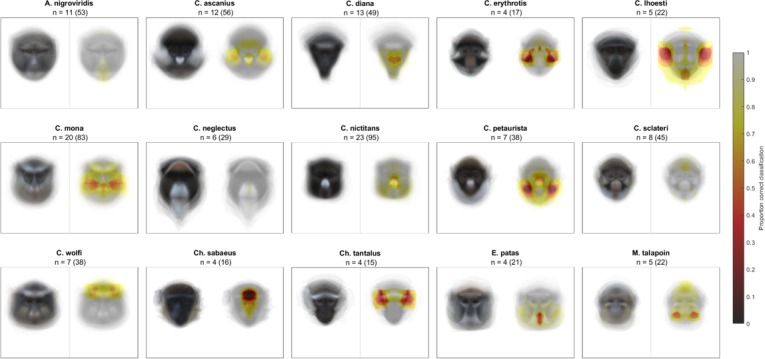
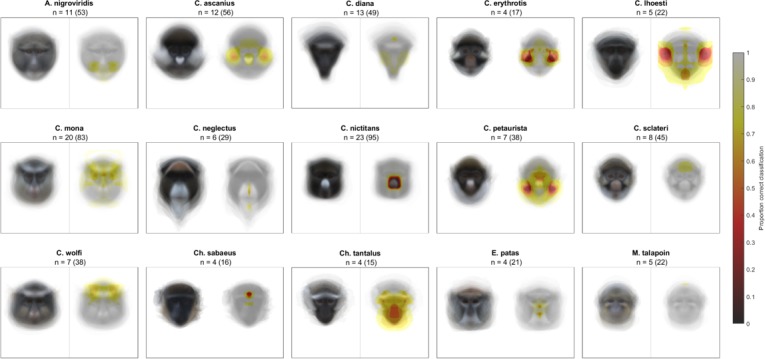
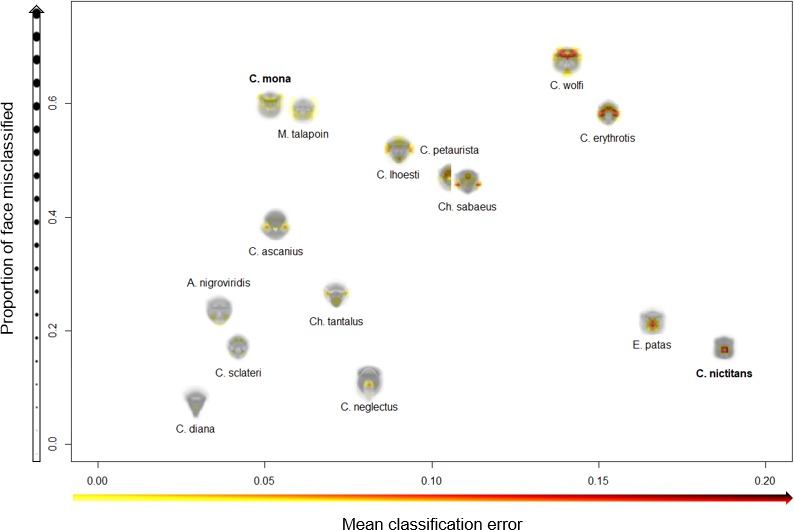
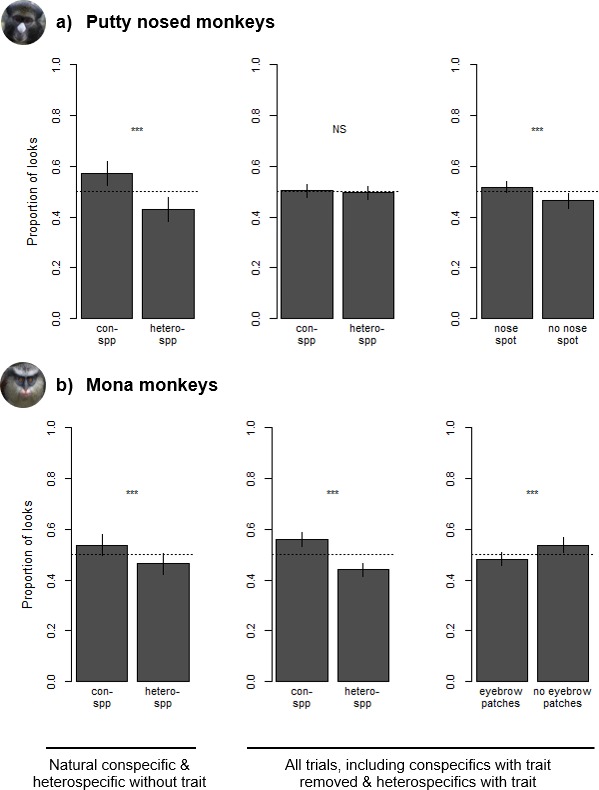
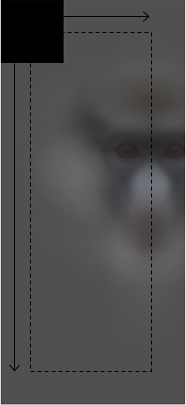
Discriminating conspecifics from heterospecifics can help avoid costly interactions between closely related sympatric species. The guenons, a recent primate radiation, exhibit high degrees of sympatry and form multi-species groups. Guenons have species-specific colorful face patterns hypothesized to function in species discrimination. Here, we use a machine learning approach to identify face regions most essential for species classification across fifteen guenon species. We validate these computational results using experiments with live guenons, showing that facial traits critical for accurate classification influence selective attention toward con- and heterospecific faces. Our results suggest variability among guenon species in reliance on single-trait-based versus holistic facial characteristics for species discrimination, with behavioral responses and computational results indicating variation from single-trait to whole-face patterns. Our study supports a role for guenon face patterns in species discrimination, and shows how complex signals can be informative about differences between species across a speciose and highly sympatric radiation.

Keywords: complex signals; evolutionary biology; guenons; species discrimination; visual signal form.


Conflict of interest statement

SW, WA, JH No competing interests declared

Figures

Figure 1.
Figure 1.. Example experimental stimulus pairs.
Subjects were shown a pair of stimulus images consisting of a conspecific and a heterospecific. Facial traits (nose spots for putty nosed monkeys and eyebrow patches for mona monkeys) were varied across trials, with conspecifics paired with a heterospecific species that shares the facial trait (row 1) and one that does not (rows 2 and 3). Conspecifics were displayed either naturally (rows 1 and 2) or with the facial trait removed (row 3). All subjects participated in all three trial types. Trial order and stimulus image side were counterbalanced across subjects.
Figure 1—figure supplement 1.
Figure 1—figure supplement 1.. The experimental apparatus.
(Top) The apparatus was painted to draw interest and placed immediately outside subject enclosures. (Middle) A widescreen laptop and video camera were housed inside the apparatus to display stimulus images and record subject responses. (Bottom) View of subject participating in looking time trial as recorded by the internal video camera.
Figure 2.
Figure 2.. Likelihood of correct classification based on occlusion of different face regions.
Species average faces are displayed on the left and heatmaps identifying critical face regions on the right. Sample size is reported as n = number of individuals (number of total images).
Figure 2—figure supplement 1.
Figure 2—figure supplement 1.. Likelihood of correct classification based on occlusion of different face regions with the occluder set to the species-specific mean face color and run on the left hemi-face (see Appendix), using a subset of species that overlap in range with putty nosed monkeys.
Species average faces are displayed on the left and heatmaps identifying critical face regions on the right. Sample size is reported as n = number of individuals (number of total images).
Figure 2—figure supplement 2.
Figure 2—figure supplement 2.. Likelihood of correct classification based on occlusion of different face regions with the occluder set to the species-specific mean face color and run on the right hemi-face (see Appendix), using a subset of species that overlap in range with putty nosed monkeys.
Species average faces are displayed on the left and heatmaps identifying critical face regions on the right. Sample size is reported as n = number of individuals (number of total images).
Figure 2—figure supplement 3.
Figure 2—figure supplement 3.. Likelihood of correct classification based on occlusion of different face regions using an average gray occluder on left hemi-face (see Appendix), using a subset of species that overlap in range with putty nosed monkeys.
Species average faces are displayed on the left and heatmaps identifying critical face regions on the right. Sample size is reported as n = number of individuals (number of total images).
Figure 2—figure supplement 4.
Figure 2—figure supplement 4.. Likelihood of correct classification based on occlusion of different face regions using an average gray occluder on right hemi-face (see Appendix), using a subset of species that overlap in range with putty nosed monkeys.
Species average faces are displayed on the left and heatmaps identifying critical face regions on the right. Sample size is reported as n = number of individuals (number of total images).
Figure 2—figure supplement 5.
Figure 2—figure supplement 5.. Likelihood of correct classification based on occlusion of different face regions with the occluder set to the species-specific mean face color and run on the left hemi-face (see Appendix), using a subset of species that overlap in range with mona monkeys.
Species average faces are displayed on the left and heatmaps identifying critical face regions on the right. Sample size is reported as n = number of individuals (number of total images).
Figure 2—figure supplement 6.
Figure 2—figure supplement 6.. Likelihood of correct classification based on occlusion of different face regions with the occluder set to the species-specific mean face color and run on the right hemi-face (see Appendix), using a subset of species that overlap in range with mona monkeys.
Species average faces are displayed on the left and heatmaps identifying critical face regions on the right. Sample size is reported as n = number of individuals (number of total images).
Figure 2—figure supplement 7.
Figure 2—figure supplement 7.. Likelihood of correct classification based on occlusion of different face regions using an average gray occluder on left hemi-face (see Appendix), using a subset of species that overlap in range with mona monkeys.
Species average faces are displayed on the left and heatmaps identifying critical face regions on the right. Sample size is reported as n = number of individuals (number of total images).
Figure 2—figure supplement 8.
Figure 2—figure supplement 8.. Likelihood of correct classification based on occlusion of different face regions using an average gray occluder on right hemi-face (see Appendix), using a subset of species that overlap in range with mona monkeys.
Species average faces are displayed on the left and heatmaps identifying critical face regions on the right. Sample size is reported as n = number of individuals (number of total images).
Figure 2—figure supplement 9.
Figure 2—figure supplement 9.. Likelihood of correct classification based on occlusion of different face regions using an average gray occluder on left hemi-faces (see Appendix).
Species average faces are displayed on the left and heatmaps identifying critical face regions on the right. Sample size is reported as n = number of individuals (number of total images).
Figure 2—figure supplement 10.
Figure 2—figure supplement 10.. Likelihood of correct classification based on occlusion of different face regions using an average gray occluder on right hemi-faces (see Appendix).
Species average faces are displayed on the left and heatmaps identifying critical face regions on the right. Sample size is reported as n = number of individuals (number of total images).
Figure 2—figure supplement 11.
Figure 2—figure supplement 11.. Likelihood of correct classification based on occlusion of different face regions with the occluder set to the species-specific mean face color and run on the right hemi-face (see Appendix).
Species average faces are displayed on the left and heatmaps identifying critical face regions on the right. Sample size is reported as n = number of individuals (number of total images).
Figure 3.
Figure 3.. Variation across species in face regions identified as essential for correct species classification.
The proportion of the face misclassified (y-axis) indicates the spread of essential regions across the face; higher values signify broader spread and lower values more concentrated regions. The mean classification error (x-axis) measures the relative importance of identified features; higher values indicate higher rates of misclassification, suggesting identified regions are particularly essential for correct species classification. Experimental results are presented for C. mona and C. nictitans (Figure 4).
Figure 4.
Figure 4.. Species and trait biases observed during looking time tasks with (a) putty nosed monkeys and (b) mona monkeys.
Each trial involved the simultaneous presentation of two images, with proportion of looks calculated as the relative duration of eye gaze at each image. Leftmost plots depict differences in looking time in trials consisting of conspecifics and heterospecifics without the relevant facial trait. Center and right plots depict looking time differences across all trials – which also include heterospecifics with the relevant facial trait and conspecifics without it – with species biases depicted in the center and trait biases on the right. Results are based on 18 putty nosed monkeys and 16 mona monkeys. Each subject participated in three trials (see Figure 1 for example stimuli for each trial type). Error bars indicate the standard error of the mean.
Figure 5.
Figure 5.. Average guenon face with an occluder shown in the top left.
The occluder is depicted in black for maximal visibility, but in analyses presented here is set to the mean face color of the relevant species. During the occlude-reclassify analysis, the occluder is slid across the image and the image re-classified; an incorrect classification at a given occluder location indicates the presence of face information critical to correct classification. Analyses are run on hemi-faces to account for facial symmetry. Image borders outside the radius of the occluder are not tested; the dashed line encloses the region of the image analyzed using the occlude-reclassify procedure.

Similar articles

Cited by

References

    1. Allen WL, Stevens M, Higham JP. Character displacement of cercopithecini primate visual signals. Nature Communications. 2014;5:4266. doi: 10.1038/ncomms5266. - DOI - PMC - PubMed
    1. Allen WL, Higham JP. Assessing the potential information content of multicomponent visual signals: a machine learning approach. Proceedings of the Royal Society B: Biological Sciences. 2015;282:20142284. doi: 10.1098/rspb.2014.2284. - DOI - PMC - PubMed
    1. Andersson M. Sexual Selection. Princeton: Princeton University Press; 1994.
    1. Bates D, Mächler M, Bolker B, Walker S. Fitting linear Mixed-Effects models using lme4. Journal of Statistical Software. 2015;67:1–48. doi: 10.18637/jss.v067.i01. - DOI
    1. Bennett ATD, Cuthill IC, Norris KJ. Sexual selection and the mismeasure of color. The American Naturalist. 1994;144:848–860. doi: 10.1086/285711. - DOI

Publication types