. 2020 Jan 23;180(2):323-339.e19.
doi: 10.1016/j.cell.2019.12.014. Epub 2020 Jan 9.

Structural Basis of Teneurin-Latrophilin Interaction in Repulsive Guidance of Migrating Neurons

Affiliations

Structural Basis of Teneurin-Latrophilin Interaction in Repulsive Guidance of Migrating Neurons

Daniel Del Toro et al. Cell. .

Abstract

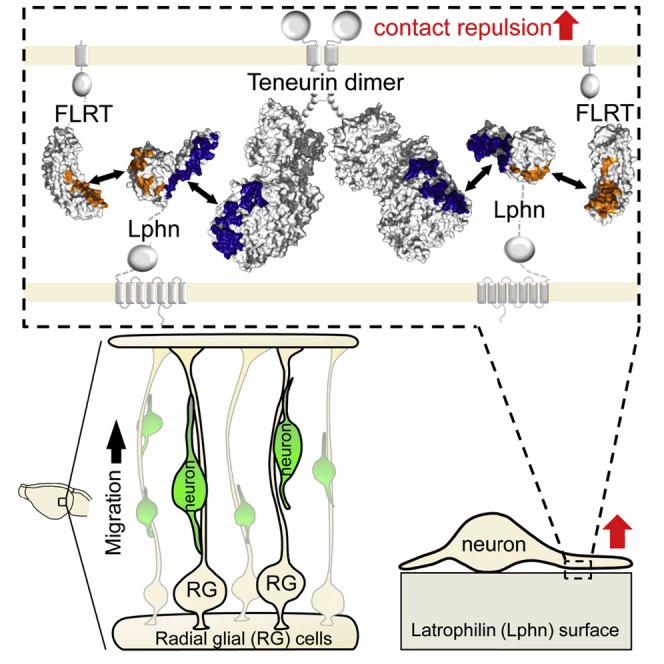
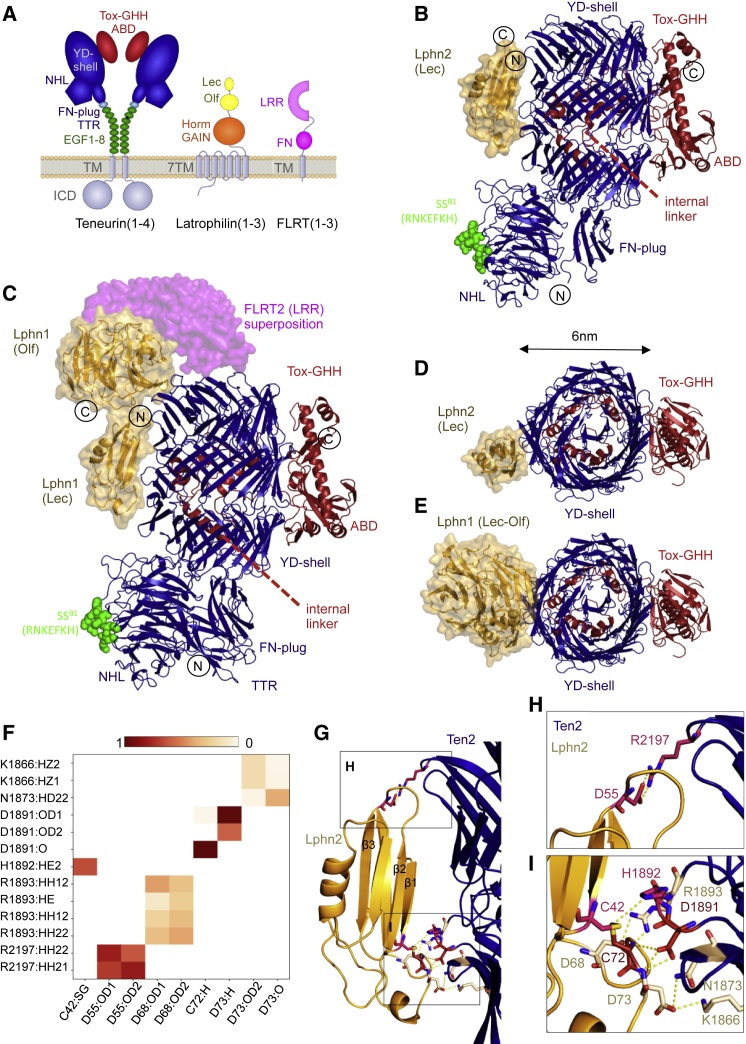
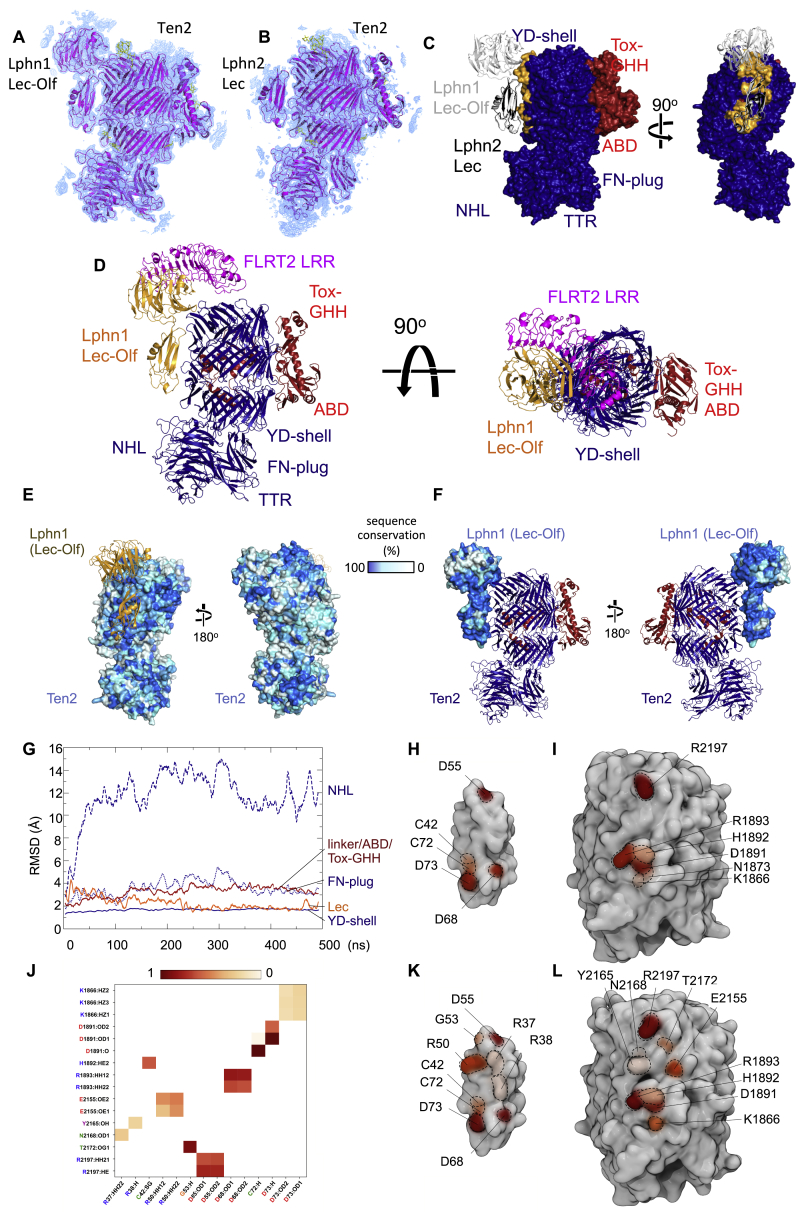
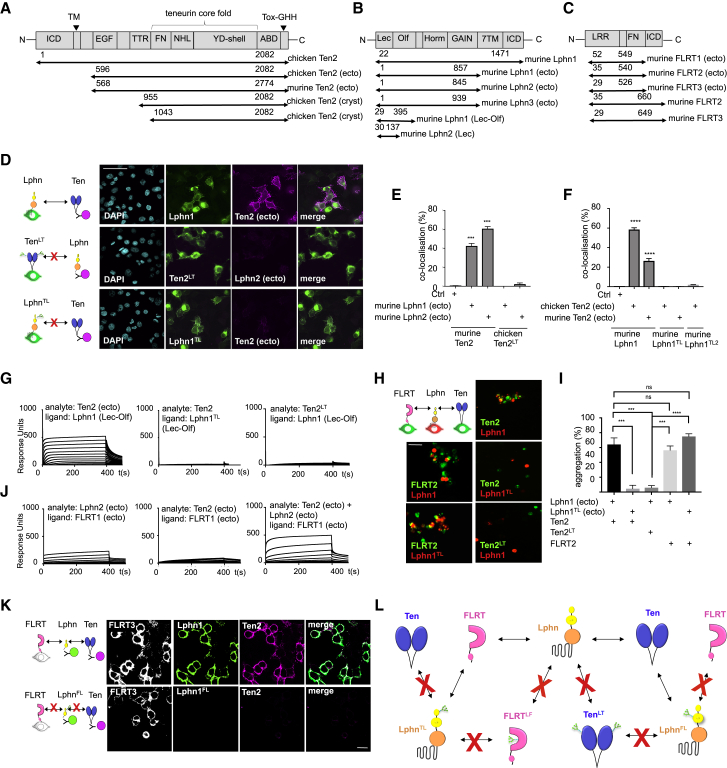
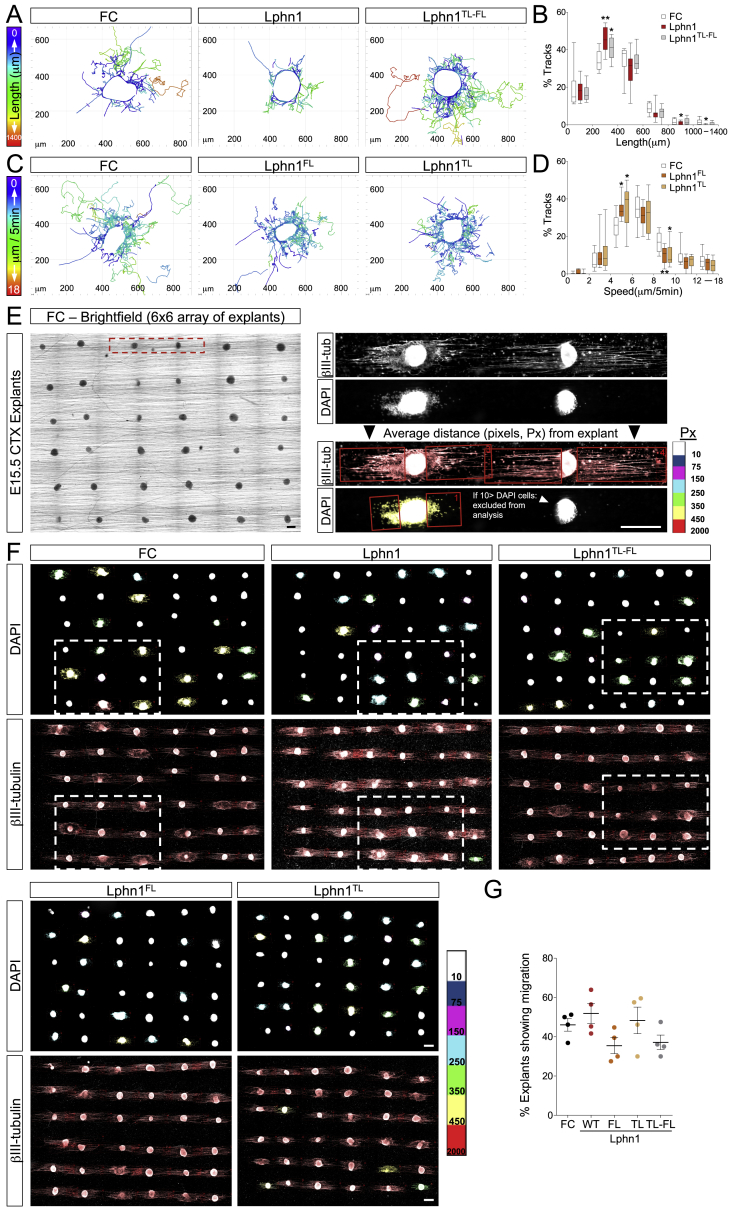
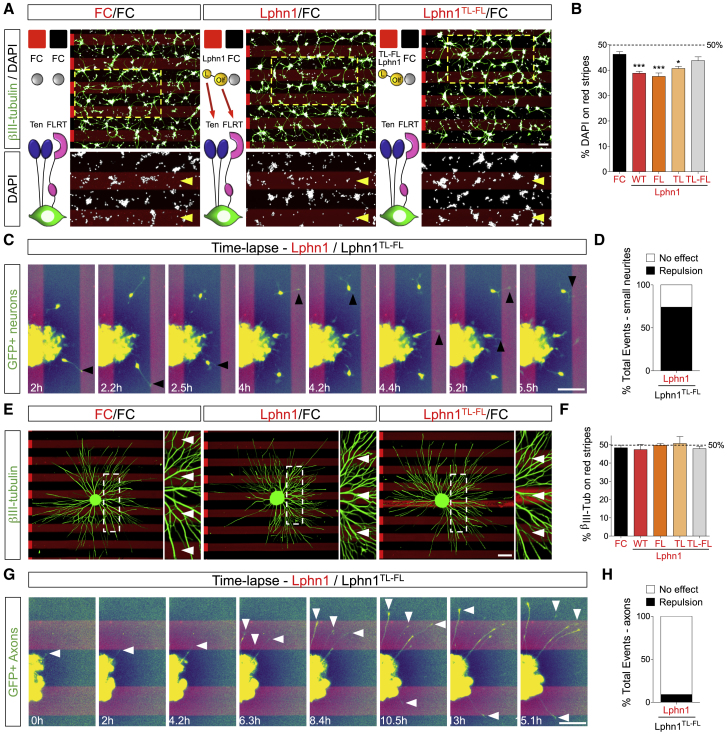
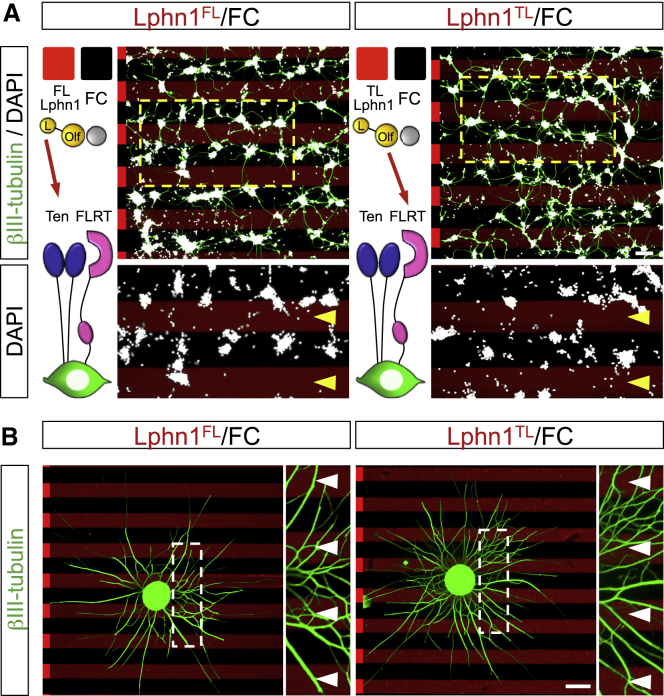
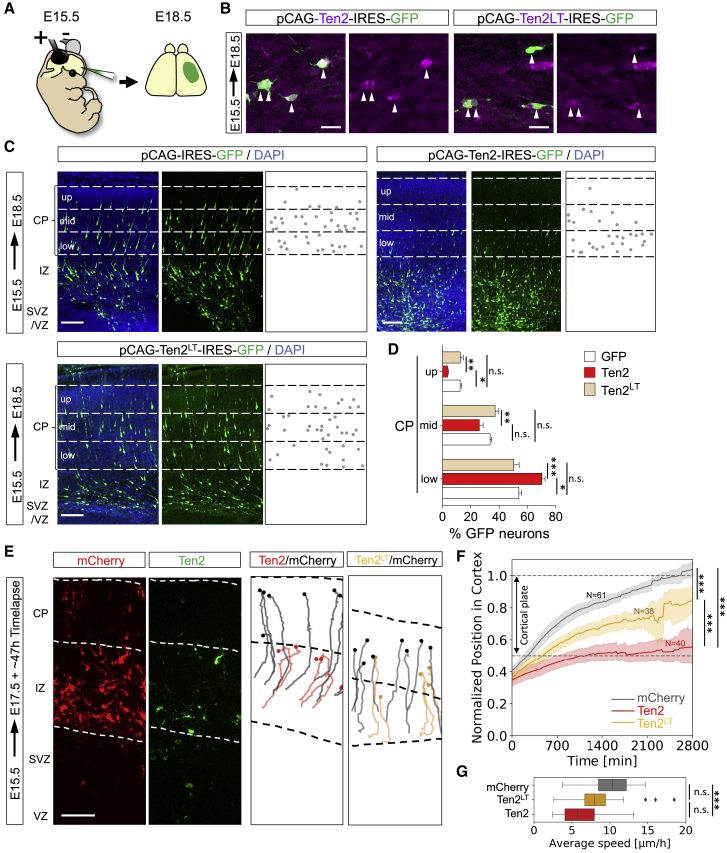
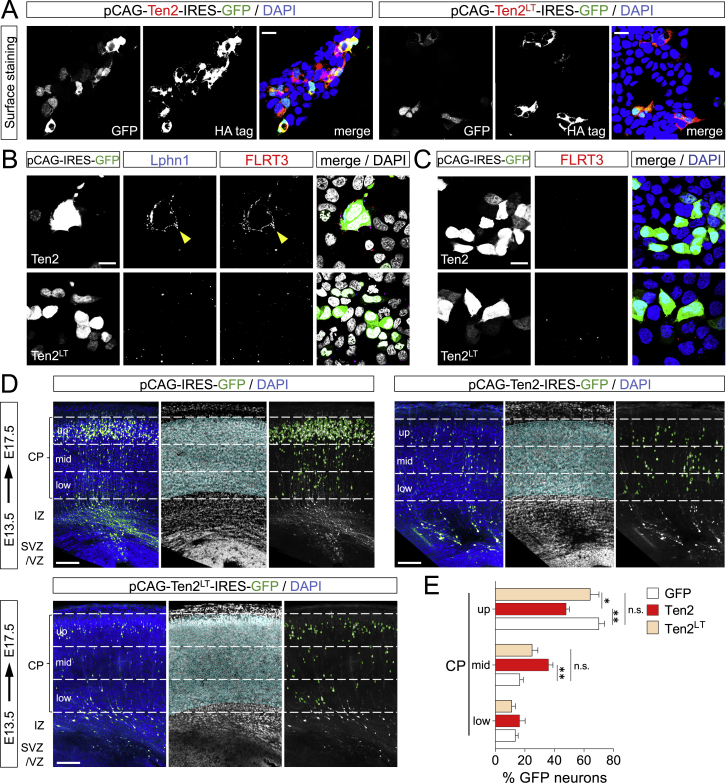
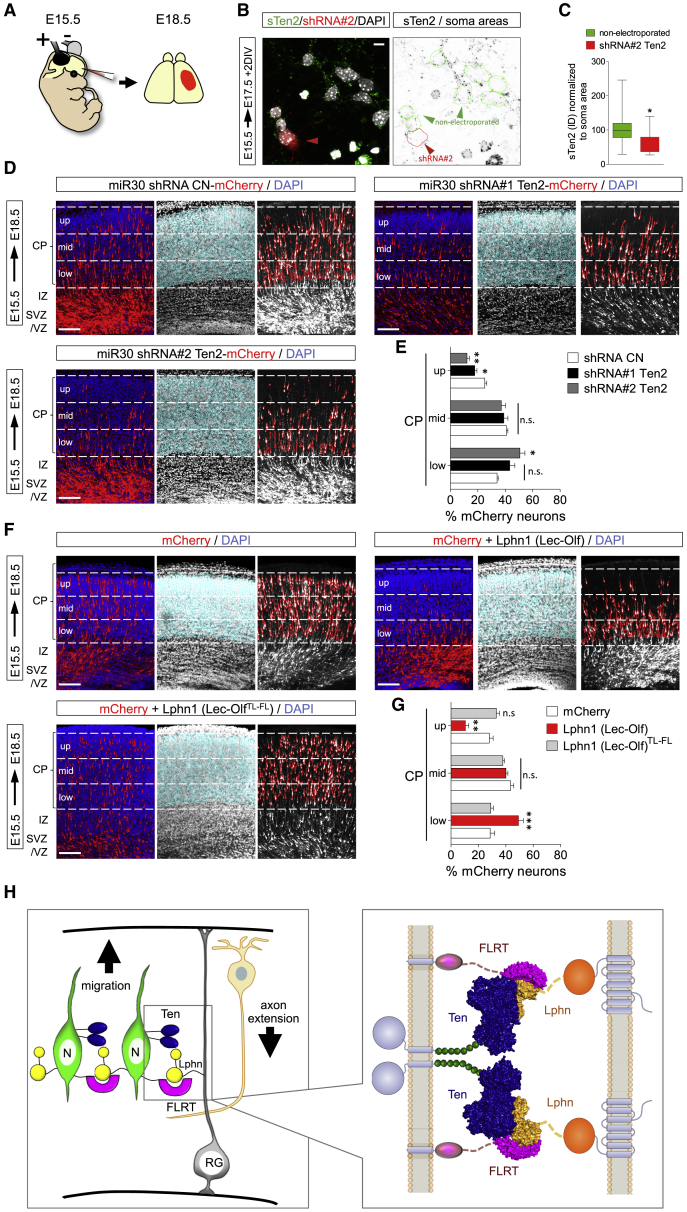
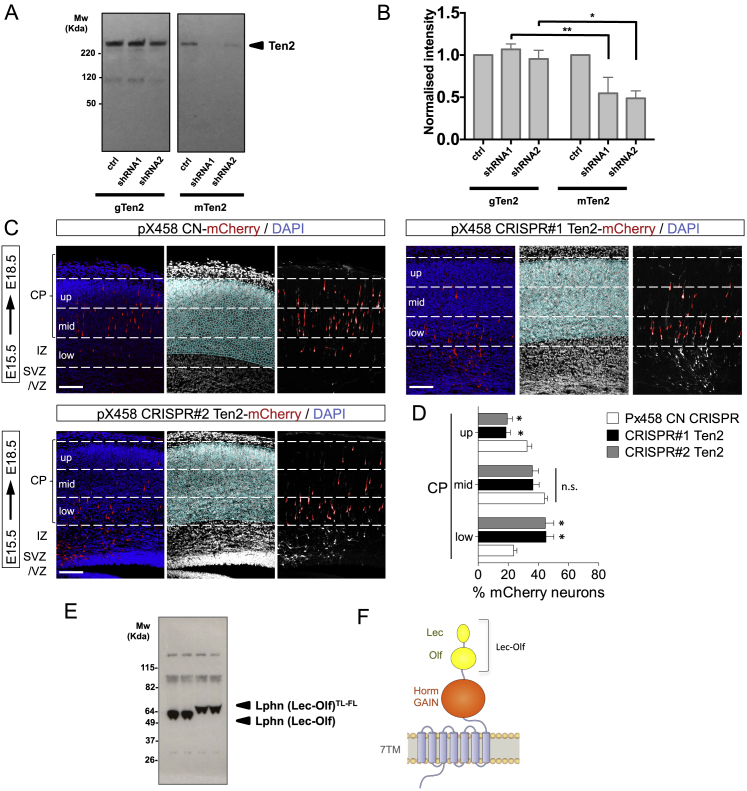
Teneurins are ancient metazoan cell adhesion receptors that control brain development and neuronal wiring in higher animals. The extracellular C terminus binds the adhesion GPCR Latrophilin, forming a trans-cellular complex with synaptogenic functions. However, Teneurins, Latrophilins, and FLRT proteins are also expressed during murine cortical cell migration at earlier developmental stages. Here, we present crystal structures of Teneurin-Latrophilin complexes that reveal how the lectin and olfactomedin domains of Latrophilin bind across a spiraling beta-barrel domain of Teneurin, the YD shell. We couple structure-based protein engineering to biophysical analysis, cell migration assays, and in utero electroporation experiments to probe the importance of the interaction in cortical neuron migration. We show that binding of Latrophilins to Teneurins and FLRTs directs the migration of neurons using a contact repulsion-dependent mechanism. The effect is observed with cell bodies and small neurites rather than their processes. The results exemplify how a structure-encoded synaptogenic protein complex is also used for repulsive cell guidance.

Keywords: FLRT; Latrophilin; Teneurin; adhesion; cortex development; neuronal migration; pyramidal neuron; radial glia; repulsion.


Conflict of interest statement

The authors declare no competing interests.

Figures

None
Graphical abstract
Figure 1
Figure 1
Crystal Structures of the Teneurin-Latrophilin Complex (A) Schematic of Teneurin, Latrophilin, and FLRT domain architectures. ABD, antibiotic-binding domain; EGF, epidermal growth factor domain; FN, fibronectin domain; FN plug, fibronectin plug domain; GAIN, GPCR autoproteolysis-inducing domain; Horm, hormone domain; ICD, intracellular domain; Lec, lectin domain; LRR, leucine-rich repeat; NHL, NCL-1, HT2A, and Lin-41 domain; Olf, olfactomedin domain; 7TM, seven-TM domain; TTR; transthyretin-like domain; TM, transmembrane helix; YD shell, tyrosine-aspartate repeats. (B) Crystal structure of the C-terminal domains of chicken Ten2 in complex with murine Lphn2 Lec. Colors are as in (A). N and C termini are indicated. The location of the alternatively spliced loop in the NHL domain (Berns et al., 2018) is indicated in green as spheres. (C) Crystal structure of the C-terminal domains of chicken Ten2 in complex with the murine Lphn1 Lec-Olf domains. The FLRT LRR domain (Jackson et al., 2016) was superposed by aligning the Olf domains of two structures. (D) Top view of the structure in (B). (E) Top view of the structure in (C). (F) Summary of the hydrogen bond analysis during a 50-ns restrained simulation. Atoms that contribute to stable hydrogen bonds between the two proteins are shown, and colored blocks indicate the stability of the bond during simulation. (G) The binding interface between Lphn Lec and the Teneurin YD shell comprises two main interacting areas (boxed areas). Selected hydrogen bonding residues are shown as sticks. Hydrogen bonds are shown as yellow lines. Interacting residues are colored according to the scheme in (G). (H and I) Magnified views of the two main binding areas as indicated in (G), top (H) and bottom (I).
Figure S1
Figure S1
Crystal Structures of the Teneurin-Latrophilin Complex, Related to Figure 1 (A) The model of Ten2 in complex with Lphn1 Lec-Olf is shown in magenta, with modeled glycans shown in yellow. A bulk solvent-corrected 2Fo-Fc electron density map was calculated from the refined model and is shown in blue (1 σ-level), within a radius of 10 Å around the model. (B) As panel A, but showing one copy of the Ten2 - Lphn2 Lec complex and its 2FoFc map. (C) Superposition of Ten2 in complex with Lphn2 Lec (black ribbons) and Lphn1 Lec-Olf (white ribbons). Ten2 is shown in surface view and colored blue (TTR, FN-plug, NHL, YD-shell) and red (internal linker, ABD and Tox-GHH domains). The Teneurin residues that interface with Lphn1 Lec-Olf in the relevant complex structure are highlighted in yellow. (D) Superposition of FLRT2 LRR domain, as previously described when bound to Lphn3 Olf domain (Jackson et al., 2016) produces a model of the ternary complex as shown. (E) Ten2 surface models in complex with Lphn1 Lec-Olf (yellow ribbons) show conservation scores calculated with Consurf (Glaser et al., 2003) based on sequence conservation. The level of conservation is represented by color; Blue = highly conserved, white = not conserved. (F) As panel E, but showing the calculated surface conservation of Lphn1 (surface representation) and Ten2 as ribbons (N terminus: dark blue, C terminus: red). (G) A 500-ns (ns) simulation reveals the flexible movements of domains with respect to the YD-shell. Root mean square deviation (RMSD) values are plotted against time. Linker/ABD/Tox-GHH (2467-2797), YD-shell (1602-2466). NHL (237-1601), FN-plug (1047-1236). (H, I) Surface views of Ten2 and Lphn2 Lec complex as found in the crystal structure. Residues that contribute to stable hydrogen bonds in a 50 ns restrained simulation are highlighted in shades of red (see Figure 1F). (J) A summary of hydrogen-bond analysis during a 500 ns unrestrained MD simulation of the Ten2- Lphn2 Lec domain complex is shown. The colors are chosen to correlate with the stability of the bond during the simulation, ranging from red ( = stable) to white ( = not stable). Interacting residues from the 500 ns unrestrained simulation are mapped onto the surfaces the Lphn2 Lec domain (K) and Ten2 YD-shell (L).
Figure 2
Figure 2
The Mutants TenLT and LphnTL Disrupt Teneurin-Latrophilin Binding (A–C) The Teneurin (Ten; A), Latrophilin (Lphn; B), and FLRT (C) constructs used in the study. (D) We tested receptor binding by expressing mVenus-tagged murine Lphn1 or chicken Ten2 (green) at the surface of HEK293 cells and detected the binding of His-tagged protein ectodomains (magenta) by immunofluorescence. DAPI labels cell nuclei (cyan). Representative images are shown. (E and F) Quantified results from the cell-based binding assays to test binding of surface expressed Ten with soluble Lphn (E), and surface expressed Lphn with soluble Ten (F). n = 12, ∗∗∗∗p < 0.0001, one-way ANOVA test with Tukey’s post hoc analysis. (G) In SPR experiments, we immobilized 220 response units of wild-type or mutant murine Lphn1 (Lec-Olf) on separate flow cells and injected Ten2 proteins using a 2-fold dilution series (highest concentration, 2.3 μM). Teneurin LT and Latrophilin TL mutants do not show binding. (H) K-562 cell aggregation assays show that the wild type, but not the mutants, promotes engagement of Latrophilin-expressing and Teneurin-expressing cells in trans. FLRT still interacts with LphnTL. (I) Quantified results from the cell aggregation assay. n = 3; ∗∗∗p < 0.001, ∗∗∗∗p < 0.0001, one-way ANOVA test with Tukey’s post hoc analysis. (J) In SPR experiments, we immobilized 440 response units of FLRT1 (ecto) on separate flow cells and injected chicken Teneurin and murine Latrophilin analytes using the same concentration series in each experiment (highest concentration, 660 nM). Injecting both Teneurin and Latrophilin over FLRT1 gave an increased response. These results suggest that a ternary Teneurin-Lphn-FLRT complex forms in vitro. Results using FLRT2 and FLRT3 are shown in Figure S2. (K) We tested binding of His-tagged Lphn1 (green) and Ten2 (magenta) ectodomains to HEK293 cells expressing FLRT3 (white). Only wild-type Lphn1, not the FL mutant, forms a ternary complex with FLRT and Teneurin at the cell surface. (L) A diagram summarizing the binding capabilities of wild-type and mutant proteins. Scale bars represent 50 μm (D and I) and 20 μm (K).
Figure S2
Figure S2
Teneurin, Latrophilin, and FLRT Interaction Studies, Related to Figure 2 (A) Teneurin and Latrophilin constructs were expressed in HEK293 cells with an intracellular mVenus and extracellular HA or Myc tag, respectively. We visualized cell surface expression with anti-HA or anti-Myc staining of fixed non-permeabilised cells. The staining shows that the constructs used in this study were all successfully expressed at the cell surface. Scale bar = 150 μm. (B) We tested the binding of Lphn1 (Lec-Olf) wild-type, single or double mutant proteins, clustered with anti-His and anti-mouse Alexa-594 (red), to HEK293 cells expressing Ten2 (green). Lphn1 and the non-FLRT binding (FL) mutant bind to Ten2. Non-Teneurin binding (TL) mutants do not bind. (C-E) SPR response curves are shown. The response units (y axis) are plotted against the time in seconds (x axis). (C) We immobilised 700 response units of murine Lphn1 (ecto), Lphn2 (ecto), or Lphn3 (ecto) on separate flow cells and injected a concentration series of mouse Teneurin 2 protein (highest concentration = 3.65 μM). (D, E) We immobilised 440, 300 and 1200 response units of FLRT2 (ecto) or FLRT3 (ecto). We injected Teneurin and Lphn proteins using the same concentration series in each experiment (highest concentration = 660 nM). (F) mVenus-tagged Ten2 was pulled down from HEK293T-cells co-transfected with FLAG-FLRT2, after incubating with either Lphn3-transfected cells or untransfected control cells. Anti-FLAG western blots show that FLRT2 is preferentially pulled down in the presence of Lphn3-expressing cells, compared to untransfected controls. Three representative repeats are shown. FLRT is highlighted by the arrow head. (G) Quantification of results shown in F. Results averaged from 6 experiments. Statistical significance was determined with a two-tailed unpaired t test where ∗∗∗p = 0.0003. Error bars show the s.e.m.
Figure 3
Figure 3
Teneurins and Latrophilins Are Expressed during Cortical Development (A) Scheme showing the location of the cortical region shown in (B) and (E). (B) In situ hybridization (ISH) for all Latrophilins (magenta) suggests that Lphn1 and Lphn2 are expressed in the cortex at E15.5. Nuclear staining with DAPI is shown in blue. The layers enriched in neurons (Ns) and apical progenitors (AP) are indicated. (C) Lphn1-3 expression in neurons and APs was quantified using published single-cell RNA profiling data (Kawaguchi et al., 2008; GEO: GSE10881). n = 15–20; p < 0.05, ∗∗∗p < 0.001, two-tailed Student’s t test. The data are presented as whisker plots. (D) Double ISH for Lphn1 (red) and Lphn2 (white) combined with immunostaining for Pvim (green) or Ctip2 (green). The AP layer where radial glial (RG) cells are located, the cortical plate (CP), and the intermediate zone (IZ) are indicated. (E) ISH for Teneurins (magenta) reveals expression in neurons. Nuclear staining with DAPI is shown in blue. (F) Ten1-4 expression in neurons and APs was quantified using published data (Kawaguchi et al., 2008; GEO: GSE10881). n = 15–20; ∗∗∗p < 0.001, two-tailed Student’s t test. The data are presented as whisker plots. (G) Double ISH for Ten2 (red) and Ten3 (white) combined with immunostaining for the neuronal marker Ctip2 (green) and RG cell marker Pvim (green). The locations of the AP layer, CP, and IZ are indicated. (H) Surface staining for FLRT3 (red) and Ten2 (green) on E15.5 cortical neurons after 2 days in vitro (DIV), treated with Lphn1 (Lec-Olf) protein, shows that FLRT3 and Ten2 are expressed in both neurite (dashed rectangle labeled as 1) and soma compartments (dashed rectangle labeled as 2) and found in proximity to Lphn1 protein (high-magnification images on the right). For examples of super-resolution images, see Figure S3M. (I) Proximal Ten2 and FLRT3 staining was quantified for samples incubated with Lphn wild-type (H) or FL-TL mutant (Figure S3K) protein (graph on the left). We also quantified proximal staining for all three proteins (graph on the right). n > 30 fields from 3 experiments. p < 0.001, ∗∗∗p < 0.001, two-tailed Student’s t test. (J) Scheme showing the location of the cortical region used for pull-down with control or FLRT3 antibodies. (K) Scatterplot results showing the clusters of proteins captured by control and FLRT3 antibody and revealed by mass spectrometry using label-free quantification (LFQ) quantitation. A pink ellipse delineates proteins enriched in FLRT3 pull-down. A blue ellipse indicates proteins enriched by control antibody. A gray ellipse shows proteins similarly enriched under both conditions. The results of two separate sets of pull-downs were averaged. Western blot results are shown in Figures S3P and S3Q. (L) A model showing that migrating neurons expressing Lphns, FLRTs, and Teneurins could interact in trans with Latrophilins located on radial glial fibers or neurons. The Lec and Olf domains of Latrophilins are indicated. Scale bars represent 150 μm (B and E), 15 μm (D, G, and H), and 2 μm (inset in H).
Figure S3
Figure S3
Teneurins, Latrophilins, and FLRTs Are Expressed during Cortical Development, Related to Figure 3 (A) Diagram showing the location of the coronal cortical region shown on panels B and C. (B and C) ISH for all Latrophilins (B) and Ten1,2 and 3 (C) colored in magenta show protein expression in the cortex of coronal sections of E13.5 mouse embryos. Nuclear staining with DAPI is shown in blue. (D) Diagram showing the location of the cortical region is shown on panels E and F. (E) ISH for all Latrophilins show that Lphn1 is expressed in the cortex of coronal sections of E17.5 mouse embryos. (F) ISH for Ten1, 2 and 3 show higher expression of Ten2 and 3 in the cortex of coronal sections of E17.5 mouse embryos. (G) Latrophilin and Teneurin expression levels normalized to GAPDH in mouse apical RG cells, using RNA profiling data published in Florio et al. (2015) (GSE65000). Lphn2 shows high expression levels compared to Lphn1 and Ten4. The data are presented as whisker plots. (H) FLRT1-3 expression in neurons (N) and apical progenitors (AP) using RNA profiling data published in Kawaguchi et al. (2008) (GEO: GSE10881). FLRT mRNA levels are high in neurons (N) compared to apical progenitors (AP). ∗∗p < 0.01, two-tailed Student’s t test. The data are presented as whisker plots. (I) Correlation analysis using RNA-Seq data for FLRTs and Teneurins in neurons, using data published in GEO: GSE10881. Ten2 expression correlates with FLRT1 and FLRT3, meaning it is present in the same neurons, while Ten4 expression shows correlation with FLRT2. (J) Scatter diagram showing data from 70 single cells from E14.5 mouse cortex, showing the variation in gene expression for FLRT3 and Ten2. The cluster of young neurons shows the strongest expression of both FLRT3 and Ten2. We used raw data previously published in GEO: GSE10881. (K) Surface staining for FLRT3 (red) and Ten2 (green) on E15.5 cortical neurons after 2 days of in vitro culture (DIV) treated with Lphn1TL-FL (Lec-Olf) proteins for 20 min at room temperature. FLRT3 and Ten2 show some degree of co-localization (yellow arrowheads) (see quantification Figure 3I). The area in the dashed rectangle is magnified on the right. (L) Quantification of Lphn1 and the TL-FL double mutant binding to cortical neurons. The double mutant protein shows almost no binding to these cultures. n > 30 fields from 3 experiments. ∗∗∗p < 0.001, two-tailed Student’s t test. (M) Single Molecule Localization Microscopy (SMLM) imaging of E15.5 cortical neurons after 2 days in vitro (DIV), surface stained for surface FLRT3 (red) and surface Ten2 (blue) and treated with Lphn1 protein (green) for 20min at RT. Yellow arrowheads indicated co-localization within the SMLM resolution of approx. 30 nm. Gray arrowheads indicate signals that show co-localization in the conventional wide-field fluorescence, but only close proximity in SMLM. (N) Lphn1 (Lec-Olf), blue, binds to HEK293 cells expressing FLRT3 (green) in the presence or absence of Lphn1 in cis (red). Nuclei are stained with DAPI. (O) Lphn1 (Lec-Olf), blue, binds to HEK293 cells expressing Ten2 (green) in the presence of absence of Lphn1 in cis (red). Nuclei are stained with DAPI. (P) Quantification of data shown in panels (N) and (O). Lphn1 (Lec-Olf) binding was normalized with the intensity of the FLRT3 (N), Ten (O) or non-transfected signal. n > 10 fields. p < 0.05, ∗∗p < 0.01, two-tailed Student’s t test. (Q) Control and FLRT3 pulldowns from mouse cortex E15.5 were analyzed by western blot. On the first two lanes we loaded 40μg of HEK cells overexpressing FLRT3 and Ten2, respectively, as a positive control. The third lane has 60μg of cortical lysate (CTX) input. The last two lanes are Ig control (left) and FLRT3 (right) pulldowns from 1mg CTX tissue. Ten2 and FLRT3 protein bands are indicated with black arrowheads. (R) Quantification of data shown in Q from 3 pull-down experiments (n = 3). p < 0.05, ∗∗p < 0.01, two-tailed Student’s t test. Scale bar = 75 μm (B-F), 15 μm (K, N, O), 2 μm (inset of K, overview images in M), 500 nm (inset of M).
Figure 4
Figure 4
Latrophilin Interaction with Teneurin and FLRT Slows Down Cell Migration In Vitro (A) Time-lapse analysis of cortical neurons exiting E15.5 cortical explants on surfaces coated with FC (control), Lphn1 (Lec-Olf), or Lphn1TL-FL (Lec-Olf) proteins. Neurons were tracked (lines) and colored based on the speed of migration. (B) Average speed frequency distributions. n > 10 movies per condition. p < 0.05, ∗∗p < 0.01, one-way ANOVA test with Tukey’s post hoc analysis. (C) Diagram depicting the nanofiber assay. (D) Snapshots from a time-lapse video of an mCherry-expressing neuron (red) migrating on nanofibers coated with FC control protein. A yellow arrowhead points to the cell soma. The transition from multipolar to bipolar morphology is visible. The leading process showed occasional branching (magnification, black arrowhead). (E) Cortical neurons stained with β-III-tubulin (red) with bipolar morphology (left) and an example of a leading process switching to a neighboring fiber (right, yellow arrowhead). (F) Tracks (green) from time-lapse imaging of neurons migrating on nanofibers. (G) Explants growing on nanofibers coated with FC, Lphn1, and Lphn1TL-FL Lec-Olf for 2 DIV. DAPI staining is color-coded based on the average distance from the explant, indicating length of migration (see also Figure S4E). (H) Quantification of the data shown in (G). n = 144 explants (36 explants per experiment, 4 experiments per condition). See full images in Figure S4F. p < 0.05, ∗∗p < 0.01, ∗∗∗p < 0.001, one-way ANOVA test with Tukey’s post hoc analysis. (I) The same explants as shown in (G), stained using β-III-tubulin. (J) Quantification of the data shown in (I). n = 144 explants (36 explants per experiment, 4 experiments per condition) as described in (H). Scale bars represent 150 μm (C), 15 μm (D and E), and 250 μm (F, G, and I).
Figure S4
Figure S4
Latrophilin Interaction with Teneurin and FLRT Slows Down Cell Migration In Vitro, Related to Figure 4 (A) Time-lapse analysis of cortical neurons migrating from E15.5 cortical explants on surfaces coated with FC (control), Lphn1 or Lphn1TL-FL proteins. Neurons were tracked (colored lines) and color-coded based on length of individual tracks. (B) Average length frequency distribution of all tracks in all conditions. n > 10 movies per condition. p < 0.05 and ∗∗p < 0.01, one-way ANOVA test with Tukey’s post hoc analysis. The data are presented as whisker plots. (C) Time-lapse analysis of cortical neurons migrating from E15.5 cortical explants on surfaces coated with FC (control), murine Lphn1FL (Lec-Olf) or Lphn1TL (Lec-Olf) proteins. Neurons were tracked (colored lines) and color-coded based on speeds in individual tracks. (D) Average speed frequency distribution of all tracked neurons in all conditions. n > 10 movies per condition.p < 0.05 and ∗∗p < 0.01, one-way ANOVA test with Tukey’s post hoc analysis. The data are presented as whisker plots. (E) Scheme illustrating the organization of the 36 explants that are cultured per condition in each experiment and condition. The higher magnification of 2 explants shown on the right, shows growth and extension of axons after 2 days (DIV) (βIII-tubulin staining). DAPI staining illustrates the presence of explants that show migration of neurons (left explant, defined as explants showing more than 10 DAPI cells) while others only show extension of axons (right explant). Explants that show migration are quantified by drawing a rectangle on both sides containing the DAPI cells, based on the averaged distance from both sides, the explant is color-coded following the scale bar on the right. Same quantification applies for the extension of the axons. (F) Full images from one experiment with all conditions (control FC, Lphn1 and its mutant versions Lphn1FL, Lphn1TL and Lphn1TL-FL). Axon extension is not affected in any of these conditions, and occurs in all explants (βIII-tubulin). In contrast, DAPI staining reveals that only 40%–60% of the explants show exiting cell migration (defined as more than 10 DAPI+ cells exiting the explants). (G) Quantification of the percentage of explants with cell migration shown in (F). n = 4 experiments per condition as described in (E). Scale bar = 300 μm (E and F).
Figure 5
Figure 5
Latrophilin1 Interaction with Teneurins and FLRTs in Trans Induces Repulsion (A) E15.5 dissociated cortical neurons were grown on alternate stripes containing FC (black) and Lphn1 Lec-Olf proteins (red). Neurons were stained with anti- β-III-tubulin to visualize neurites (green) and nuclei (DAPI, white). In the magnified inset images, the red Lphn-containing stripes are indicated by yellow arrowheads. (B) The percentage of DAPI+ pixels on red stripes was quantified. n = 3 different experiments. p < 0.05, ∗∗p < 0.01, ∗∗∗p < 0.001, one-way ANOVA test with Tukey’s post hoc analysis. (C) GFP+ neurons exiting cortical explants grown on alternating Lphn1 (red) and Lphn1TL-FL (black) stripes. Snapshots from a time-lapse experiment are shown. Neurons prefer to migrate on Lphn1TL-FL in these experiments. A repulsive event was defined as a contact between a small neurite and Lphn1 stripes lasting less than 3 frames. Black arrowheads indicate repulsive events. (D) Quantification of the data shown in (C); n > 30 contacts. (E) E15.5 cortical explants were grown on stripes as in (A) and stained with anti- β-III-tubulin to visualize axons. (F) Quantification of data shown in (E). n = 3 different experiments. (G) GFP+ axons exiting cortical explants grown on alternating Lphn1 (red) and Lphn1TL-FL (black) stripes. Snapshots from a time-lapse experiment are shown. No preference for black or red stripes was observed. A repulsive event was defined as a contact between an axon and Lphn1 stripes lasting less than 3 frames. White arrowheads indicate growth cones that are not repelled from Lphn1 stripes. (H) Quantification of the data shown in (G); n > 20 contacts. Scale bars represent 300 μm (A), 200 μm (C and G), and 200 μm (E).
Figure S5
Figure S5
Latrophilin1 Interaction with Teneurins and FLRTs in Trans Induces Repulsion, Related to Figure 5 (A) E15.5 dissociated cortical neurons were grown on alternate stripes containing FC (black stripes) and wild-type or mutant TL or FL murine Lphn1 Lec-Olf protein (red stripes). Neurons were stained with anti-beta-III-tubulin to visualize neurites (green) and DAPI (white). High magnification showing the location of nuclei (DAPI, white) on stripes is shown at the bottom. Red stripes, which contain Lphn protein, are indicated with yellow arrowheads. After imaging, the percentage of DAPI+ pixels on red stripes was quantified and it is shown in Figure 5B. (B) E15.5 cortical explants were grown on the same stripes as in (A) and the quantification of the results is shown Figure 5F. White arrow heads indicate the red stripes which contain Lphn1 mutant protein. Scale bars represent 20 μm (A) and 200 μm (B).
Figure 6
Figure 6
Latrophilin Interaction with Teneurins Delays Neuron Migration (A) Schematic of in utero electroporation (IUE) performed at E15.5. (B) IUE of pCAG-Ten2-IRES-GFP or pCAG-Ten2LT-IRES-GFP was performed and analyzed at E18.5. Hemagglutinin (HA)-tagged Ten2 and Ten2LT protein expression in neurons was confirmed by immunostaining with anti-HA (magenta). Ten2 and Ten2LT expression coincides with expression of the reporter GFP (green). (C) Coronal sections after IUE. The CP was subdivided into 3 bins (up, mid, and low), and the number of GFP+ neurons in each bin was quantified. (D) Quantification of the data shown in (C). n = 6 GFP, n = 7 Ten2, and n = 10 Ten2LT electroporated brains. p < 0.05, ∗∗p < 0.01, ∗∗∗p < 0.001, one-way ANOVA test with Tukey’s post hoc analysis. (E) For time-lapse imaging of live brain slices, sections were performed at E17.5, 2 days after IUE. Neurons were tracked as they migrated from the IZ to the CP (representative tracks are shown on the right). Dashed lines indicate the positions of the IZ and CP. (F) Quantification of the data shown in (E). n = 61 mCherry-expressing, n = 38 Ten2LT-expressing, and n = 40 Ten2-expressing neurons from 3 experiments. ∗∗∗p < 0.001, one-way ANOVA test with Tukey’s post hoc analysis. (G) The average speed of the tracked neurons is shown as a whisker plot. Ten2- but not Ten2LT-overexpressing neurons migrate significantly slower compared with control neurons. ∗∗∗p < 0.001, one-way ANOVA test with Tukey’s post hoc analysis. Scale bars represent 20 μm (B), 100 μm (C), and 80 μm (E).
Figure S6
Figure S6
Latrophilin Interaction with Teneurins Delays Neuron Migration, Related to Figure 6 (A) HA-tag surface staining was performed on HEK293 cells expressing the plasmids used for in-utero-electroporation (IUE) assays, pCAG-Ten2-IRES-GFP and pCAG-Ten2LT-IRES-GFP. Ten2 and Ten2LT HA-staining coincides with GFP-expressing cells (green), validating correct cell surface expression. (B) HEK293 cells expressing pCAG-Ten2-IRES-GFP and pCAG-Ten2LT-IRES-GFP where incubated with immuno-clustered Lphn1 protein (blue) and immuno-clustered FLRT3 protein (red) for 20min at room temperature. Fixed cells were imaged. Ten2, but not the LT mutant, binds to Lphn1 which in turn binds FLRT3 (yellow arrowhead). (C) HEK293 cells expressing pCAG-Ten2-IRES-GFP and pCAG-Ten2LT-IRES-GFP where incubated with immuno-clustered FLRT3 protein (red). Ten2 and its mutant Ten2LT do not bind FLRT3 in the absence of Latrophilin. (D) Coronal sections of E17.5 cortex after IUE at E13.5 with pCAG-IRES-GFP, pCAG-Ten2-IRES-GFP or pCAG-Ten2LT-IRES-GFP. The cortical plate (CP) is defined based on the DAPI staining (nuclei outlined in cyan) and subdivided in 3 bins (up, mid and low). GFP+ neurons localized within the CP were automatically identified (outlined in green) and the percentage in each bin was quantified. (E) Quantification of data shown in (D). n = 7 GFP, n = 7 Ten2, and n = 8 Ten2LT electroporated brains. p < 0.05, ∗∗p < 0.01, one-way ANOVA test with Tukey’s post hoc analysis. Scale bars represent 20 μm (A-C) and 150 μm (D).
Figure 7
Figure 7
Loss of Teneurin Delays Neuronal Migration (A) Schematic of IUE performed at E15.5. (B) Neurons were electroporated with pCAG-mCherry and pCAG-miR30 containing shRNA#2 for murine Ten2 (red), harvested and plated as dissociated cultures at E17.5, cultured for 2 DIV, and immunostained for surface Ten2 (green) (left image). A magnified view shows cell nuclei (DAPI) of non-electroporated neurons (green lines) and mCherry+ shRNA#2+ neurons (red lines) (right image). (C) Quantification of the data shown in (B). n > 40 non-electroporated and n > 13 shRNA#2. p < 0.05, one-way ANOVA test with Tukey’s post hoc analysis. (D) Coronal sections of an E18.5 cortex previously electroporated with pCAG-mCherry and a pCAG-miR30 vector coding for shRNA control (CN), shRNA#1, or shRNA#2. The latter two constructs target murine Ten2. The cortical plate was subdivided into 3 bins (up, mid, and low), and the number of mCherry+ neurons in each bin was quantified. (E) Quantification of the data shown in (D). n = 5 CN, n = 6 shRNA#1, and n = 5 shRNA#2 electroporated brains. p < 0.05, ∗∗p < 0.01, one-way ANOVA test with Tukey’s post hoc analysis. (F) Coronal sections of an E18.5 cortex electroporated to express mCherry alone or together with the secreted version of wild-type or TL-FL mutant Lphn1 (Lec-Olf). The cortical plate was subdivided into 3 bins (up, mid, and low), and the number of mCherry+ neurons in each bin was quantified. (G) Quantification of the data shown in (F). n = 7 mCherry, n = 6 Lphn1 (Lec-Olf), and n = 6 Lphn1 (Lec-Olf)TL-FL electroporated brains. p < 0.05, ∗∗p < 0.01, one-way ANOVA test with Tukey’s post hoc analysis. (H) Schematic depicting a model of Teneurin, FLRT, and Latrophilin in radial cortical migration. Scale bars represent 15 μm (B) and 100 μm (D).
Figure S7
Figure S7
Loss of Teneurin Delays Neuronal Migration, Related to Figure 7 A) HEK293T cells were co-transfected with pCAG-miR30 containing shRNA or control inserts, and either chicken Ten2 (gTen2), or murine Ten2 (mTen2). The sequences chosen were selected to match the murine gene only, not chicken ten2. Effective knock-down was observed only for overexpressed murine Ten2. (B) Quantification of data shown in (A). The expression was quantified using ImageJ and the values for gTen2 and mTen2 shRNA-co-transfected samples were normalized using the control gTen2 or mTen2 intensities, respectively. p = 0.0168, ∗∗p = 0.0054, one-way ANOVA test with Tukey’s post hoc analysis. (C) Coronal sections of E18.5 cortex after IUE at E15.5 with CRISPR control, Ten2 CRISPR#1 and CRISPR#2 using the pX458 plasmid with pCAG-mCherry. The cortical plate (CP) is subdivided into 3 bins (up, mid and low) and the number of mCherry+ neurons in each bin was quantified. (D) Quantification of data shown in (C). n = 6 CN, n = 5 CRISPR#1, and n = 4 CRISPR#2 electroporated brains. p < 0.05, one-way ANOVA test with Tukey’s post hoc analysis. (E) Western blot to validate the expression of pCAGIG Myc-tagged Lphn1 (Lec-Olf) wild-type and TL-FL mutant, used in IUE experiments (Figures 7F and 7G). The mutant contains two additional N-linked glycosylation sites, which block FLRT and Teneurin binding. It therefore runs slightly higher on the gel compared to the wild-type. (F) Schematic showing the portion of Lphn1 that is included in the Lec-Olf construct (see also Figure 2B). Scale bars represent 150 μm (C).

References

    1. Abraham M.J., Murtola T., Schulz R., Páll S., Smith J.C., Hess B., Lindahl E. GROMACS: High performance molecular simulations through multi-level parallelism from laptops to supercomputers. SoftwareX. 2015;1–2:19–25.
    1. Aldahmesh M.A., Mohammed J.Y., Al-Hazzaa S., Alkuraya F.S. Homozygous null mutation in ODZ3 causes microphthalmia in humans. Genet. Med. 2012;14:900–904. - PubMed
    1. Alkelai A., Olender T., Haffner-Krausz R., Tsoory M.M., Boyko V., Tatarskyy P., Gross-Isseroff R., Milgrom R., Shushan S., Blau I. A role for TENM1 mutations in congenital general anosmia. Clin. Genet. 2016;90:211–219. - PubMed
    1. Antinucci P., Nikolaou N., Meyer M.P., Hindges R. Teneurin-3 specifies morphological and functional connectivity of retinal ganglion cells in the vertebrate visual system. Cell Rep. 2013;5:582–592. - PMC - PubMed
    1. Antinucci P., Suleyman O., Monfries C., Hindges R. Neural Mechanisms Generating Orientation Selectivity in the Retina. Curr. Biol. 2016;26:1802–1815. - PMC - PubMed

Publication types

MeSH terms