. 2020 Jan 20;30(2):264-275.e8.
doi: 10.1016/j.cub.2019.11.075. Epub 2020 Jan 9.

Circuit Mechanisms Underlying Chromatic Encoding in Drosophila Photoreceptors

Affiliations

Circuit Mechanisms Underlying Chromatic Encoding in Drosophila Photoreceptors

Sarah L Heath et al. Curr Biol. .

Abstract

Spectral information is commonly processed in the brain through generation of antagonistic responses to different wavelengths. In many species, these color opponent signals arise as early as photoreceptor terminals. Here, we measure the spectral tuning of photoreceptors in Drosophila. In addition to a previously described pathway comparing wavelengths at each point in space, we find a horizontal-cell-mediated pathway similar to that found in mammals. This pathway enables additional spectral comparisons through lateral inhibition, expanding the range of chromatic encoding in the fly. Together, these two pathways enable efficient decorrelation and dimensionality reduction of photoreceptor signals while retaining maximal chromatic information. A biologically constrained model accounts for our findings and predicts a spatio-chromatic receptive field for fly photoreceptor outputs, with a color opponent center and broadband surround. This dual mechanism combines motifs of both an insect-specific visual circuit and an evolutionarily convergent circuit architecture, endowing flies with the ability to extract chromatic information at distinct spatial resolutions.

Keywords: Drosophila melanogaster; color model; color opponency; color vision; convergent evolution; horizontal cell; medulla; neural circuit; photon capture; photoreceptor.


Conflict of interest statement

Declaration of Interests

The authors do not declare any conflicts of interest.

Figures

Figure 1.
Figure 1.. Experimental setup and stimulus design.
A. Spectral composition of pale and yellow ommatidia of the Drosophila eye. Pale ommatidia express Rh3 and Rh5 in R7 and R8, respectively. Yellow ommatidia express Rh4 and Rh6 in R7 and R8, respectively. R1–6 all express Rh1. B. Photoreceptors in Drosophila project from the retina into the optic lobe. Our imaging experiments target the axon terminals of R7 and R8 in the medulla at the level of layers M6 and M3, respectively. C. Two-photon imaging set up. The fly is secured facing LED setup, and LED sources are combined using a custom color mixer to form a single collimated beam. D. Relative spectral sensitivity of opsins expressed in the fruit fly retina; data from [44] and fitted with equation from [45] (see STAR methods). E. Normalized photon flux across the wavelength spectrum, corresponding to the various LEDs used for stimuli. F. Desired set of spectral distributions to test to build a spectral tuning curve. G. For any given single wavelength in F, we calculate the relative photon capture (q) for all five opsins by integrating over the opsin sensitivities in D, and plot a vector in photon capture space. We then simulate the single wavelength with combinations of the available LEDs in E that most closely recreate that vector (see STAR methods for details). See also Figure S1 and Table S1.
Figure 2.
Figure 2.. R7 and R8 putative rhabdomeric responses are transformed into opponent outputs.
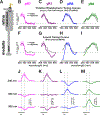
A. In Drosophila photoreceptors, light (λ) is absorbed in the retina by rhodopsin molecules at the level of the rhabdomeres, where phototransduction takes place. Photoreceptors project their axons to the medulla where synaptic interactions occur. B-E. NorpA, an essential component of the phototransduction cascade, was restored in norpa- blind flies in individual photoreceptor types (RhX denoting Rh3/4/5/6). This allowed for measurement of putative rhabdomeric spectral tuning in photoreceptor axons by eliminating interactions from other cell types. Max-normalized responses of R7/R8 axons were measured across simulated wavelengths to construct spectral tuning curves. ROIs correspond to individual cells, whose responses were averaged equally across flies. Ns= 106 ROIs (8 flies), 96(8), 69(7), and 26(4), respectively. Dashed black lines represent the log (q). Colored lines represent the mean photoreceptor response. Shaded region represents the 95% confidence interval. Dashed grey lines represent baseline fluorescence. F-I. Max-normalized spectral tuning curves constructed using the amplitudes of measured responses of R7 and R8 axons in wild type flies. Ns= 152(8), 134(6), 138(7), and 129(6), respectively. J-M. Average GCaMP6f responses of R7 and R8 axons in wild type flies to 0.5 second flashes of three simulated wavelengths. Vertical dashed grey lines represent onset and offset of light presentation. See also Table S1.
Figure 3.
Figure 3.. Pairwise NorpA rescues highlight sources of opponency in R7/R8.
NorpA, a component of the phototransduction cascade, was restored in norpa- blind flies in select pairs of photoreceptor types to determine contributions to opponency. A-C. Max-normalized responses of pR7 axons were measured across simulated wavelengths, with NorpA restored in pR7 and a second indicated photoreceptor type. Ns= 106 ROIs (8 flies), 108(8), 132(8), and 104(6), respectively. Dashed black lines represent log (q), black lines represent the wild type response, colored lines represent the mean photoreceptor response, shaded regions represents the 95% confidence interval, dashed grey lines represent baseline fluorescence. D-F. Max-normalized responses of pR8 axons were measured across simulated wavelengths, with NorpA restored in pR8 and a second indicated photoreceptor type. Ns= 63(7), 80(9), 69(7), and 63(7), respectively. See also Figure S2 and Table S1.
Figure 4.
Figure 4.. The horizontal cell-like interneuron Dm9 mediates indirect spectral opponency.
A. Schematic of Dm9/photoreceptor connectivity. Dm9 is an excitatory interneuron spanning multiple medulla columns shown to be both pre- and postsynaptic to R7/R8. B. Side view of a maximum projection of a single Dm9 clone (R32E04-Gal4). Scale bar: 10 μm C. Cross section view of a single Dm9 clone (pink), photoreceptor terminals (blue), and yR7 terminals (green) shows a single Dm9 contacts both yellow and pale ommatidia. Scale bar: 5 μm D. Purple trace represents GCaMP6f Responses in R7 after a pulse train of red light in flies expressing CsChrimson in Dm9 (R32E04 driver) N= 37 (4 flies). Grey trace represents R7 responses in control flies without CsChrimson expression. N= 70 (5 flies). Solid lines represent the mean, shaded region represents 95% confidence interval. Vertical red lines represent light presentation. Horizontal dashed grey lines represent baseline fluorescence. E-G. Responses of Dm9 (R32E04-Gal4) to 0.5 second flashes of three simulated wavelengths over a 10 μE background with a flat spectrum. Responses to three luminant multiples of each wavelength are shown (1x, 4x, and 8x). Solid lines represent the mean, shaded region represents 95% confidence interval. Vertical dashed grey lines represent onset and offset of light presentation. Horizontal dashed grey lines represent baseline fluorescence. H. Dm9 spectral tuning curves corresponding to three luminant multiples of each wavelength are shown (1x, 4x, and 8x). I. pR8 max-normalized spectral tuning curves. Blue line represents pR8 responses in a Dm9-silenced background (R32E04-Gal4 driving UAS-Kir2.1) N= 323 ROIs (6 flies). Black line represents wild type pR8 responses using the same GCaMP6f construct. Dashed black lines represent the log (q). J. pR8 max-normalized spectral tuning curves. Blue line represents pR8 tuning in a hiscl-,ort- mutant background where Ort was rescued in Dm9 (R21A12-GaL4 driving UAS-Ort) N= 153 (6). Black line represents pR8 in a hiscl-,ort- mutant background. Dashed black lines represent the log (q). See also Figure S3 and Table S1.
Figure 5.
Figure 5.. Opponency is consistent with principal components which efficiently decorrelate and preserve chromatic information.
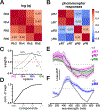
A. Correlation matrix comparing the calculated rhabdomeric responses of R7s and R8s. B. Correlation matrix comparing the measured axonal responses in R7 and R8 outputs. C. Decomposition of opsin spectral sensitivities using principal component analysis (PCA) yields four main principal components : an achromatic component (ach) and three chromatic components (c1, c2, and c3) D. Percentage of the variance explained by each principal component. E-F. Comparisons between the max-normalized tuning curves based on the measured tuning curves in R7 and R8 axons (colored lines) and the first two chromatic components c1 and c2 (gray lines) to the flat background for luminant multiple 4 (see Figure S4). See also Figure S5 and Table S1.
Figure 6.
Figure 6.. Recurrent model of color opponency in R7 and R8 photoreceptors.
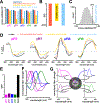
A. Comparison of different cross-validated R2 values using linear regression, the fully-parameterized recurrent model, the synaptic count recurrent model, and the synaptic count + gain recurrent model. B. Comparison of BIC values for the different iterations of the recurrent model. C. Distribution of R2 values using random weights for the synaptic count + gain model. The dotted line indicates the 95th percentile of the distribution and the solid colored line indicates the R2 value using the synaptic counts as weights. D. Predicted responses for the different iterations of the recurrent model (colored), and the actual mean response of the photoreceptor in question (black). E. Fitted gains for different neurons in the recurrent circuit for the synaptic count + gain model. F. The predicted spectral filtering properties of the different photoreceptor outputs (solid line) compared to the filtering properties of the rhodopsin they express (dashed line). G. The spectral filtering properties for the predicted center and surround of the different photoreceptor outputs. See also Figure S4, Figure S6, Table S1, and Table S2.

Comment in

References

    1. Rushton WAH, Review lecture. Pigments and signals in colour vision, J Physiol 220 (1972) 1P–31P. - PMC - PubMed
    1. Shevell S, Martin P, Color opponency: A tutorial, J. Opt. Soc. Am. A 34 (2017) 1099–1108. - PMC - PubMed
    1. Su C-Y, Menuz K, Reisert J, Carlson JR, Non-synaptic inhibition between grouped neurons in an olfactory circuit, Nature 492 (2012) 66. - PMC - PubMed
    1. Conway BR, Chatterjee S, Field GD, Horwitz GD, Johnson EN, Koida K, Mancuso K, Advances in Color Science: From Retina to Behavior, J. Neurosci 30 (2010) 14955–14963. - PMC - PubMed
    1. Buchsbaum G, Gottschalk A, Trichromacy, opponent colours coding and optimum colour information transmission in the retina, Proc R Soc L. B Biol Sci 220 (1983) 89–113. - PubMed

Publication types

MeSH terms

LinkOut - more resources