. 2020 Jan 1;76(Pt 1):31-39.
doi: 10.1107/S2053230X19017175. Epub 2020 Jan 1.

The Escherichia coli RnlA-RnlB toxin-antitoxin complex: production, characterization and crystallization

Affiliations

The Escherichia coli RnlA-RnlB toxin-antitoxin complex: production, characterization and crystallization

Gabriela Garcia-Rodriguez et al. Acta Crystallogr F Struct Biol Commun. .

Abstract

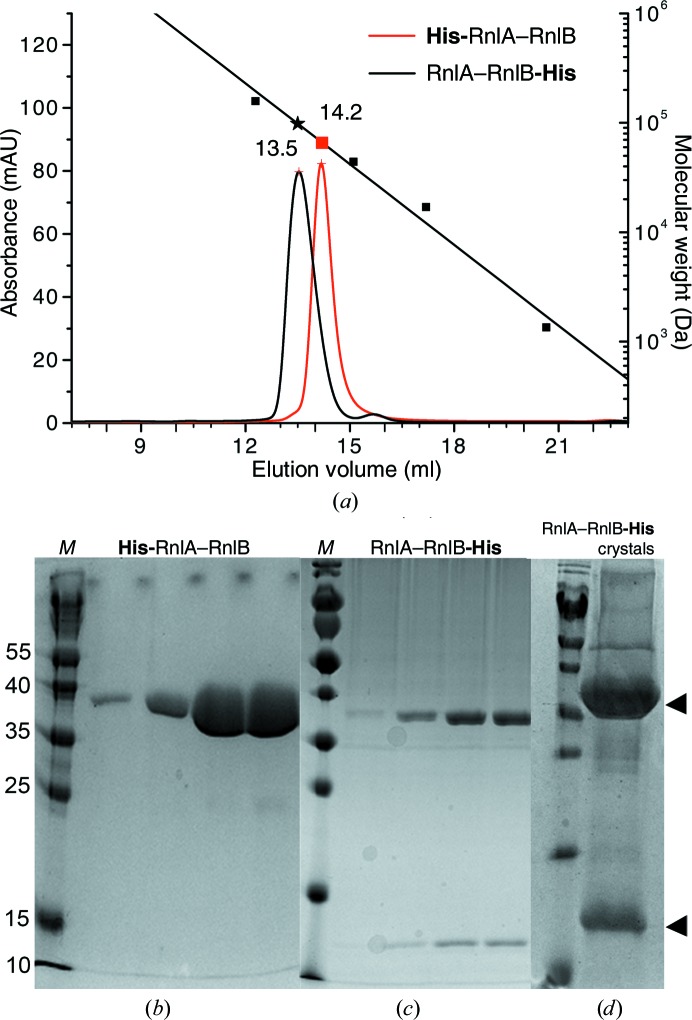
The Escherichia coli rnlAB operon encodes a toxin-antitoxin module that is involved in protection against infection by bacteriophage T4. The full-length RnlA-RnlB toxin-antitoxin complex as well as the toxin RnlA were purified to homogeneity and crystallized. When the affinity tag is placed on RnlA, RnlB is largely lost during purification and the resulting crystals exclusively comprise RnlA. A homogeneous preparation of RnlA-RnlB containing stoichiometric amounts of both proteins could only be obtained using a His tag placed C-terminal to RnlB. Native mass spectrometry and SAXS indicate a 1:1 stoichiometry for this RnlA-RnlB complex. Crystals of the RnlA-RnlB complex belonged to space group C2, with unit-cell parameters a = 243.32, b = 133.58, c = 55.64 Å, β = 95.11°, and diffracted to 2.6 Å resolution. The presence of both proteins in the crystals was confirmed and the asymmetric unit is likely to contain a heterotetramer with RnlA2:RnlB2 stoichiometry.

Keywords: Escherichia coli; bacterial stress response; macromolecular complex; toxin–antitoxin.


Figures

Figure 1
Figure 1
(a) Analytical size-exclusion chromatography profiles of His-RnlA–RnlB (red) and RnlA–RnlB-His (black) samples on a Superdex 200 Increase column. The elution volumes of the molecular-weight standards are plotted as black squares (bovine γ-globulin, 158 000 Da; chicken ovalbumin, 44 000 Da; horse myoglobin, 17 000 Da; vitamin B12, 1350 Da). The red square and the black star represent the elution positions of the His-RnlA–RnlB and RnlA–RnlB-His peaks, respectively. (b, c, d) 15% SDS–PAGE gels of purified fractions for His-RnlA–RnlB (b), RnlA–RnlB-His (c) and the redissolved crystals of RnlA–RnlB-His (d). Arrowheads mark the positions of the RnlA and RnlB-His proteins on the gels. In (b) the only visible band corresponds to His-RnlA, and RnlB is not detected by Coomassie staining. RnlA and RnlB-His bands are both visible on the gels in (c) and (d) (the presence of RnlB-His was further confirmed by an anti-His Western blot). The Thermo Fisher Prestained Protein Ladder 10 to 180 kDa is shown as a reference in lane M.
Figure 2
Figure 2
Small-angle X-ray scattering. (a, b) Scattering curves after background subtraction (a) and Guinier plots (b) for His-RnlA–RnlB (applied at 2.47 mg ml−1 onto a Shodex column). The fit to the theoretical SAXS curve for the biological RnlA dimer (red curve) rendered a χ2 value of 1.46, while the fit to the theoretical SAXS curve for the crystallographic dimer in PDB entry 4i8o (green curve) showed a χ2 value of 3.3. (c, d) Scattering curves after background subtraction (c) and Guinier plots (d) for RnlA–RnlB-His (applied at 5.9 mg ml−1 onto a Shodex column). The fit to the theoretical SAXS curves for the biological RnlA dimer (red curve) and the crystallographic dimer in PDB entry 4i8o (green curve) showed χ2 values of 55.4 and 24.2, respectively.
Figure 3
Figure 3
Native mass-spectrometric analysis of RnlA–RnlB-His samples. Native mass spectra of (a) the RnlA–RnlB-His sample before crystallization and (b) resolubilized crystals after diffraction. The measured and theoretical masses of the complexes are indicated. For both samples distributions of 2×RnlA and 2×RnlB (red charge states) were detected, whereas in the sample before crystallization (a) the complex lacking one RnlB is also present (blue charge states). Critical voltages and pressures used during the measurements were 120 V on the sampling cone, 5 V trap-collision energy for the sample in (a) and 50 V trap-collision energy for the sample in (b).
Figure 4
Figure 4
(a) Crystals from the His-RnlA–RnlB preparation (7 mg ml−1) obtained in 0.1 M MES monohydrate pH 6.5, 12% PEG 20  000 supplemented with 0.2%(w/v) pyridoxal hydrochloride, 0.2%(w/v) 2′-deoxyadenosine 5′-­monophosphate, 0.2%(w/v) guanosine 5′-diphosphate sodium salt, 0.2%(w/v) nalidixic acid, 0.2%(w/v) uridine 5′-diphospho-N-acetylglucos­amine sodium salt, 0.02 M HEPES sodium pH 6.8. (b) Crystals of the RnlA–RnlB-His complex (44 mg ml−1) obtained in 50% condition No. 2-46 of the MIDAS crystal screen [0.1 M Tris pH 8.5, 25%(w/v) SOKALAN CP 5].

References

    1. Dy, R. L., Richter, C., Salmond, G. P. C. & Fineran, P. C. (2014). Annu. Rev. Virol. 1, 307–331. - PubMed
    1. Evans, P. (2006). Acta Cryst. D62, 72–82. - PubMed
    1. Franke, D., Petoukhov, M. V., Konarev, P. V., Panjkovich, A., Tuukkanen, A., Mertens, H. D. T., Kikhney, A. G., Hajizadeh, N. R., Franklin, J. M., Jeffries, C. M. & Svergun, D. I. (2017). J. Appl. Cryst. 50, 1212–1225. - PMC - PubMed
    1. Gerdes, K., Christensen, S. K. & Løbner-Olesen, A. (2005). Nat. Rev. Microbiol. 3, 371–382. - PubMed
    1. Gerdes, K., Rasmussen, P. B. & Molin, S. (1986). Proc. Natl Acad. Sci. USA, 83, 3116–3120. - PMC - PubMed

MeSH terms