. 2020 Jan 13;11(1):189.
doi: 10.1038/s41467-019-13832-9.

Sestrin prevents atrophy of disused and aging muscles by integrating anabolic and catabolic signals

Affiliations

Sestrin prevents atrophy of disused and aging muscles by integrating anabolic and catabolic signals

Jessica Segalés et al. Nat Commun. .

Abstract

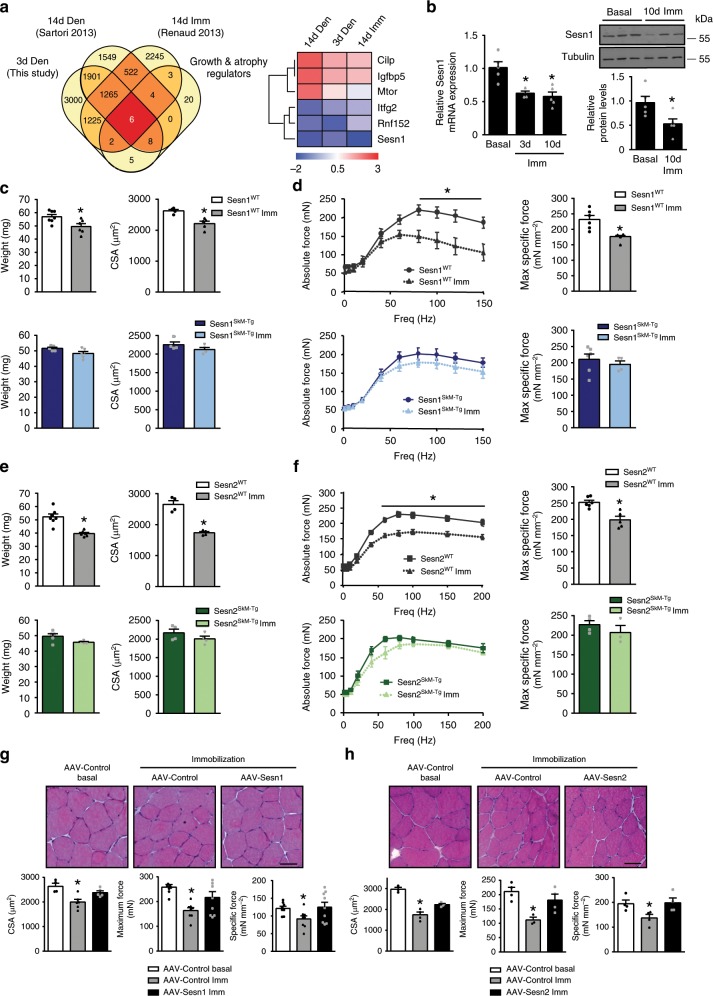
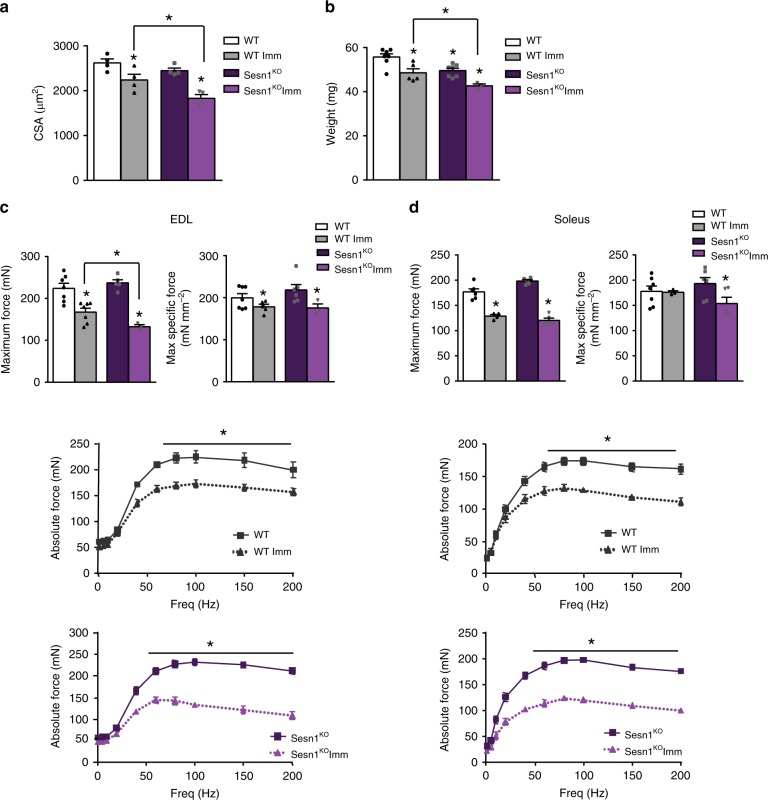
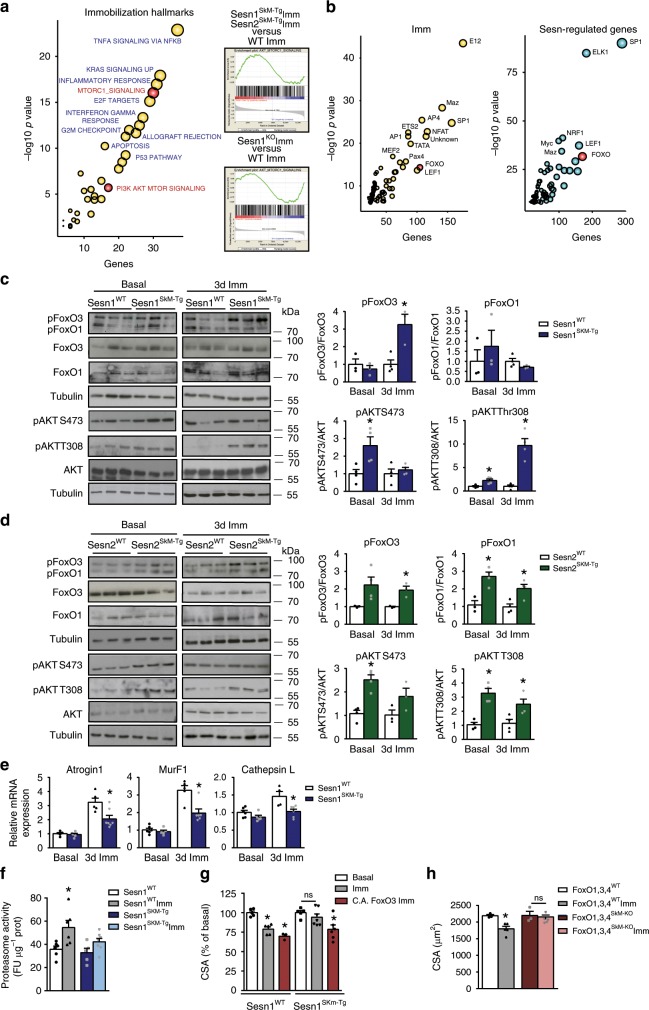
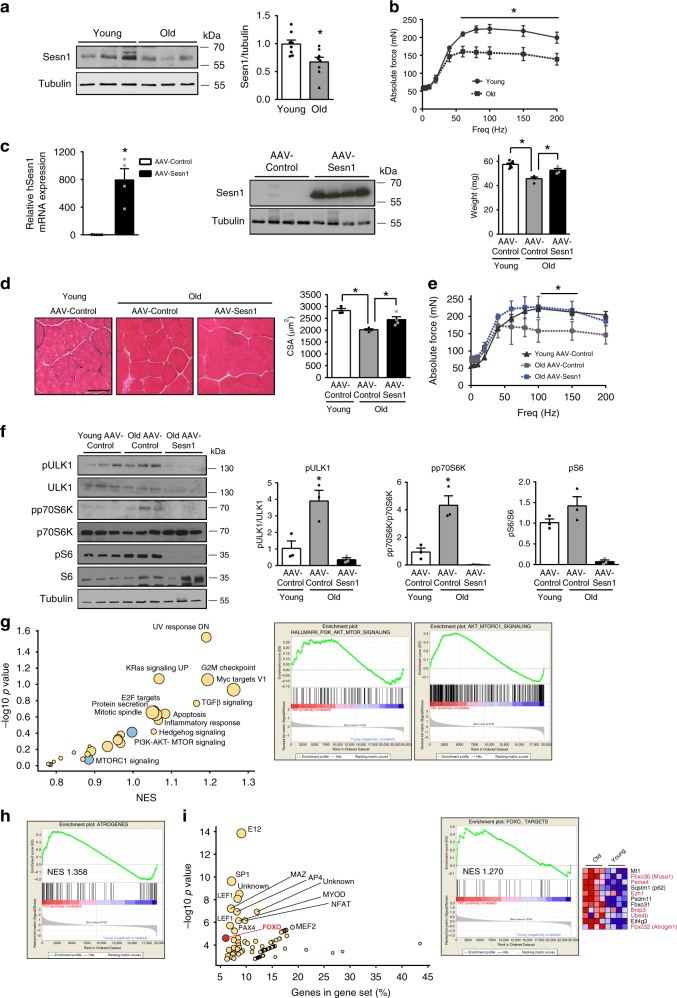
A unique property of skeletal muscle is its ability to adapt its mass to changes in activity. Inactivity, as in disuse or aging, causes atrophy, the loss of muscle mass and strength, leading to physical incapacity and poor quality of life. Here, through a combination of transcriptomics and transgenesis, we identify sestrins, a family of stress-inducible metabolic regulators, as protective factors against muscle wasting. Sestrin expression decreases during inactivity and its genetic deficiency exacerbates muscle wasting; conversely, sestrin overexpression suffices to prevent atrophy. This protection occurs through mTORC1 inhibition, which upregulates autophagy, and AKT activation, which in turn inhibits FoxO-regulated ubiquitin-proteasome-mediated proteolysis. This study reveals sestrin as a central integrator of anabolic and degradative pathways preventing muscle wasting. Since sestrin also protected muscles against aging-induced atrophy, our findings have implications for sarcopenia.


Conflict of interest statement

The authors declare no competing interests.

Figures

Fig. 1
Fig. 1. Sestrins prevent disuse-induced skeletal muscle atrophy.
a Left Venn diagram showing overlap between a gene set of growth and atrophy regulators (see the “Methods” section) and dysregulated genes in immobilized (Imm) or denervated (Den) muscles reported in published muscle atrophy models or identified in our RNAseq comparison. Right Heat map for the six genes dysregulated in all gene sets analyzed. b Analysis of Sesn1 mRNA (left) and protein (right) in tibialis anterior (TA) muscles from non-immobilized (basal) and immobilized (Imm) limbs of WT mice for the indicated number of days (d). c TA muscle weight of and mean TA fiber cross-sectional area (CSA) in Sesn1SkM-Tg mice (overexpressing human Sesn1) and corresponding wild type (WT) mice (Sesn1WT) in basal conditions and after 10 days of limb immobilization. d Force measurements in extensor digitorum longus (EDL) muscle of Sesn1WT and Sesn1SkM-Tg mice in basal conditions and after 10 days of limb immobilization. Charts show force–frequency curves (left) and maximum specific force (maximum force normalized by muscle area) (right). e Weight of TA muscles and mean TA fiber CSA in Sesn2SkM-Tg mice (overexpressing human Sesn2) and corresponding WT mice (Sesn2WT) in basal conditions and after 10 days of limb immobilization. f Force measurements in EDL muscles of Sesn2WT and Sesn2SkM-Tg mice in basal conditions and after 10 days of limb immobilization. Charts show force–frequency curves and maximum specific force. g Histology and muscle force in EDL muscles of young mice transduced with AAV-Sesn1 or AAV-Control followed 4 days later by limb immobilization for 10 additional days. The upper panels show representative images of hematoxylin/eosin (H/E) staining in basal and immobilized muscles. Scale bar = 50 µm. The charts show fiber size (CSA), maximum force, and specific force. h Histology and muscle force in EDL muscles transduced with AAV-Sesn2 or AAV-Control and treated as described in g. Scale bar = 50 µm. All data are shown as mean with SEM. Statistical comparisons by unpaired two-tailed Student's t-test (*p < 0.05 vs. basal conditions). Sample numbers were n = 4–6 mice per group for cf and n = 4 mice per condition for g, h. Source data are provided as a Source Data file.
Fig. 2
Fig. 2. Loss of sestrin1 exacerbates disuse-induced muscle atrophy.
a Mean CSA of TA fibers from WT and Sesn1KO mice in basal conditions and after 10 days of limb immobilization. b TA muscle weight in WT and Sesn1KO mice in basal conditions and after 10 days of limb immobilization. c, d Force measurements in EDL c and soleus d muscles of WT and Sesn1KO mice in basal conditions and after 10 days of limb immobilization. Charts show maximum and specific force (top) and force–frequency curves (bottom). All data are shown as mean with SEM. Comparisons by unpaired two-tailed Student's t-test (*p < 0.05). N = 3–7 mice per genotype and condition. Source data are provided as a Source Data file.
Fig. 3
Fig. 3. Sestrin blunts FoxO-dependent upregulation of muscle atrogenes.
a Gene set enrichment analysis (GSEA) of immobilization-related genes. Bubble plot of enriched GSEA hallmarks in the dysregulated genes upon 3-day muscle immobilization in WT mice (left). Enrichment plots of the combined PI3K-AKT-MTOR signaling and mTORC1-signaling hallmarks (AKT-MTORC1 signaling) in comparisons of Sesn1/2SkM-Tg vs. WT mice and Sesn1KO vs. WT mice (right). b Bubble plot of enriched transcription factor-binding sites (GSEA) among immobilization-dysregulated genes (left) and the sestrin-regulated gene set defined in Supplementary Fig. 4a (right). c Western blot analysis showing phosphorylation levels of FoxO1, FoxO3, and AKT in muscles of Sesn1WT and Sesn1SkM-Tg mice in basal conditions and after 3 days of immobilization. Representative blots are shown (left) with corresponding quantification. For each experimental condition (basal and immobilization) values of Sesn1SkM-Tg are referred to averaged values for Sesn1WT samples, which were set to one. d Western blot analysis of the phosphorylation levels of FoxO1, FoxO3, and AKT in muscles of Sesn2WT and Sesn2SkM-Tg mice in basal conditions and after 3 days of immobilization. Representative blots are shown (left) with corresponding quantification (right), relatively to Sesn2WT values, as in c. e Atrogin1, MurF1, and Cathepsin L mRNA levels in skeletal muscle from Sesn1WT and Sesn1SkM-Tg mice in basal conditions and after 3 days of immobilization. f Proteasome activity in total homogenates of TA muscles from Sesn1WT and Sesn1SkM-Tg mice in basal conditions and after 3 days of immobilization. g Mean myofiber CSA in TA muscle from Sesn1WT and Sesn1SkM-Tg mice electrotransferred with control vector or with a plasmid encoding constitutively active FoxO3 (C.A. FoxO3) and then immobilized for 10 days. Values are relative to basal conditions. h Mean myofiber CSA in TA muscle from FoxO1,3,4WT and FoxO1,3,4SkM-KO mice in basal conditions and after 10 days of immobilization. All data are shown as mean with SEM. Comparisons by Student's t-test (*p < 0.05). Sample numbers were n = 3–4 mice per group for c, d, n = 3–6 animals for eg and n = 3–5 mice per genotype and condition for h. Source data are provided as a Source Data file.
Fig. 4
Fig. 4. Autophagy induction via sestrin-mediated mTORC1 blockade prevents atrophy.
a Bubble plot showing the main molecular hallmarks (GSEA) enriched in the sestrin-regulated gene set defined in Supplementary Fig. 4a. b Western blot analysis and quantification of S6 and ULK1 phosphorylation in muscles from Sesn2WT and Sesn2SkM-Tg mice (left) and in muscles transduced with AAV-Sesn1 or AAV-Control (right) in basal conditions and at 3 days post-immobilization. Values were normalized to basal control conditions. c Western blot analysis and quantification of LC3I and LC3II in TA muscles transduced with AAV-Sesn1 or AAV-Control in basal conditions and at 3 days post-immobilization. Treatment of mice with colchicine or vehicle is indicated. Lower chart shows the fold increase in LC3II content in colchicine-treated versus vehicle-treated mice. d Representative confocal images of 3-day-immobilized TA muscle electrotransferred with a tandem mRFP-GFP-LC3 reporter plasmid to enable detection of autophagosomes (yellow puncta) and autolysosomes (red puncta). The chart shows double RFP+GFP+ puncta as a percentage of total puncta for the indicated genotypes. Scale bar = 5 µm. e Representative confocal images of non-immobilized muscles in WT and Sesn1KO mice treated as in d. The chart shows RFP+GFP+ puncta as a percentage of total puncta. Scale bar = 5 µm. f Mean TA myofiber CSA in basal conditions and at 10 days post-immobilization in muscles transduced with AAV-Control or AAV-Sesn1 and electrotransferred with control short hairpin (sh) or sh targeting TSC2. g Mean TA myofiber CSA in basal conditions and at 10 days post-immobilization in WT mice treated with vehicle (top) or rapamycin (bottom). h Mean TA myofiber CSA in basal conditions and at 10 days post-immobilization in WT mice treated with vehicle or spermidine. i Mean TA myofiber CSA in basal conditions and at 10 days post-immobilization in Atg7WT and Atg7SkM-KO mice transduced with AAV-Control or AAV-hSesn1. All data are shown as mean with SEM. Comparisons by Student's t-test (*p < 0.05 and **p < 0.01 vs. basal). Sample numbers were n = 3 mice per group for b, d, e, n = 3–5 animals for c, f, g, i and n = 4 for h. Source data are provided as a Source Data file.
Fig. 5
Fig. 5. Sestrins prevent aging-related muscle atrophy.
a Western blot and quantification of Sesn1 protein levels in skeletal muscle from young (4 months) and old (24 months) mice. b Force–frequency curve of EDL muscles from young and old WT mice. c qPCR of human Sesn1 mRNA in skeletal muscle from 24-month-old mice transduced with AAV-Sesn1 for one month and Sesn1 protein expression by Western blotting in the same muscles (left). Weight of TA muscles from young and old mice transduced with AAV-Sesn1 or AAV-Control for 1 month (right). d Representative H/E staining pictures of TA muscle sections from 24-month-old mice transduced with AAV-Sesn1 or AAV-Control for 1 month and quantification of mean myofiber CSA. Scale bar = 50 µm. e EDL force-frequency curve in 24-month-old mice transduced with AAV-Sesn1 or AAV-Control for 1 month. f Western blot analysis and quantification of phosphorylation levels of p70S6K, S6, and ULK1 in muscles from old mice transduced with AAV-Sesn1 or AAV-Control for 1 month. Representative blots are shown with corresponding quantification. Values were normalized to averaged values of young control mice. g Bubble plot of enriched GSEA hallmarks in the dysregulated genes upon muscle aging (left). Enrichment plots of the PI3K-AKT-MTOR signaling hallmark and the combined PI3K-AKT-MTOR signaling and mTORC1 signaling hallmarks (AKT-MTORC1 signaling) in comparisons of old and young mice (right). h As in g, enrichment plots of the atrogenes gene set in comparisons of old and young mice. i Bubble plot of enriched transcription factor-binding sites (GSEA) in the dysregulated genes upon muscle aging (left). Enrichment plots of the FoxO3a targets in skeletal muscle (as defined in Brocca et al.) and heatmap illustrating genes with higher enrichment in comparisons of old and young mice (right). All data are shown as mean with SEM. Comparisons by Student's t-test (*p < 0.05). Sample numbers were n = 8 mice per group for a, n = 4–7 mice per condition for b and c, n = 3–5 mice per condition for d and e and n = 3 mice per group for f. Source data are provided as a Source Data file.

Similar articles

Cited by

References

    1. Egerman MA, Glass DJ. Signaling pathways controlling skeletal muscle mass. Crit. Rev. Biochem. Mol. Biol. 2014;49:59–68. doi: 10.3109/10409238.2013.857291. - DOI - PMC - PubMed
    1. Schiaffino S, Mammucari C. Regulation of skeletal muscle growth by the IGF1-Akt/PKB pathway: insights from genetic models. Skelet. Muscle. 2011;1:4. doi: 10.1186/2044-5040-1-4. - DOI - PMC - PubMed
    1. Bodine SC, et al. Identification of ubiquitin ligases required for skeletal muscle atrophy. Science. 2001;294:1704–1708. doi: 10.1126/science.1065874. - DOI - PubMed
    1. Gomes MD, Lecker SH, Jagoe RT, Navon A, Goldberg AL. Atrogin-1, a muscle-specific F-box protein highly expressed during muscle atrophy. Proc. Natl Acad. Sci. USA. 2001;98:14440–14445. doi: 10.1073/pnas.251541198. - DOI - PMC - PubMed
    1. Mammucari C, et al. FoxO3 controls autophagy in skeletal muscle in vivo. Cell Metab. 2007;6:458–471. doi: 10.1016/j.cmet.2007.11.001. - DOI - PubMed

Publication types

MeSH terms