. 2020 Jan 13;15(1):e0226725.
doi: 10.1371/journal.pone.0226725. eCollection 2020.

A non-canonical role for p27Kip1 in restricting proliferation of corneal endothelial cells during development

Affiliations

A non-canonical role for p27Kip1 in restricting proliferation of corneal endothelial cells during development

Dennis M Defoe et al. PLoS One. .

Abstract

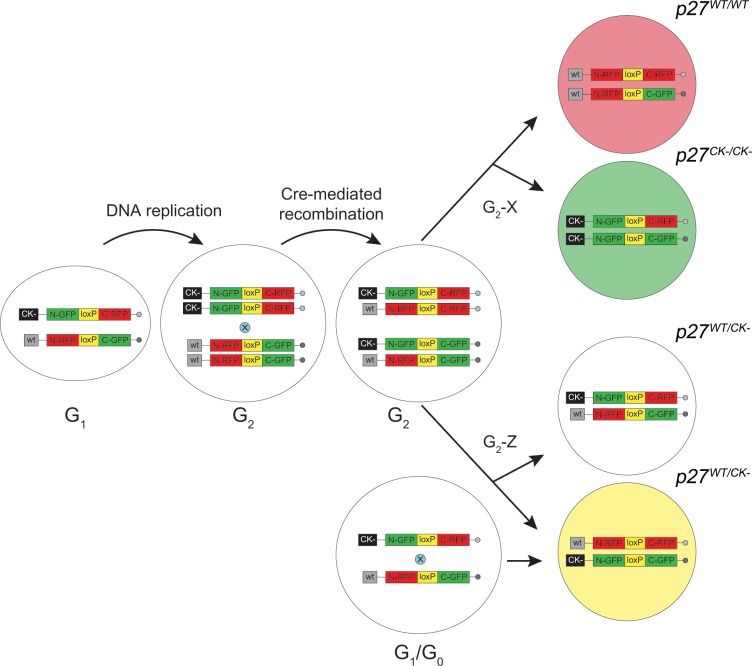
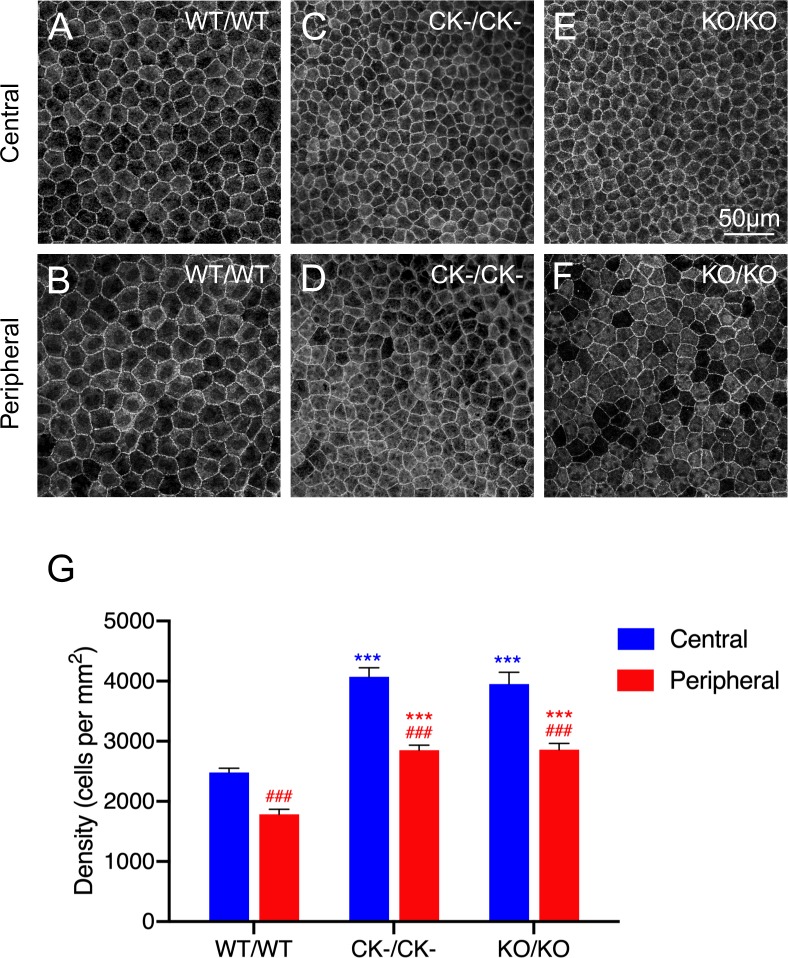
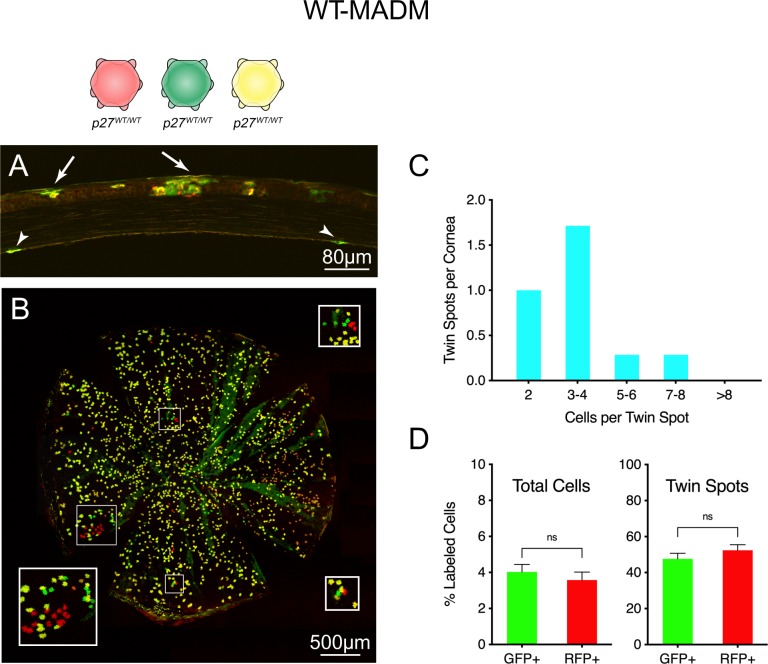
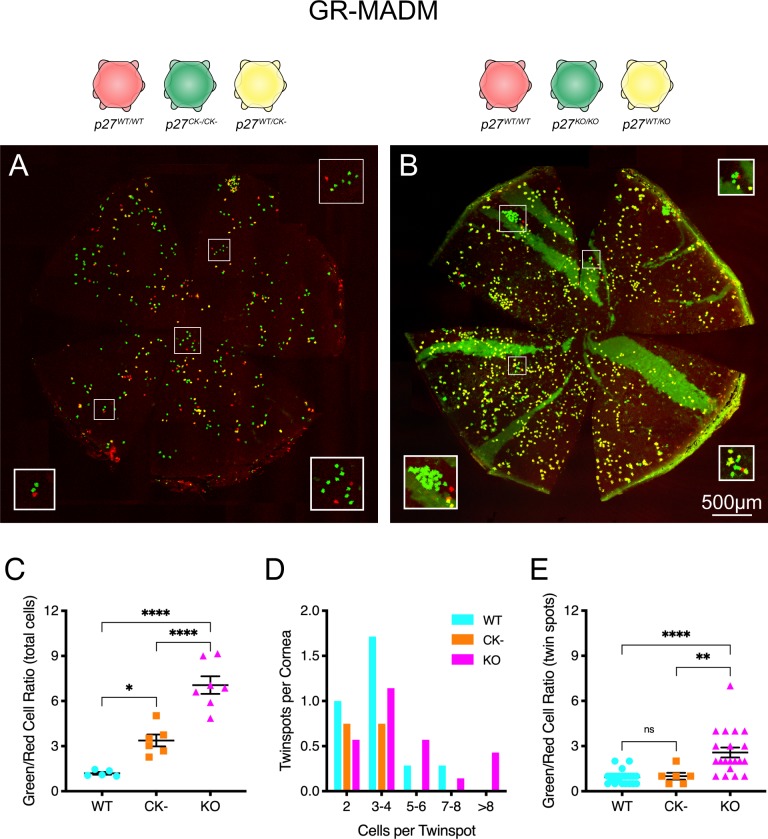
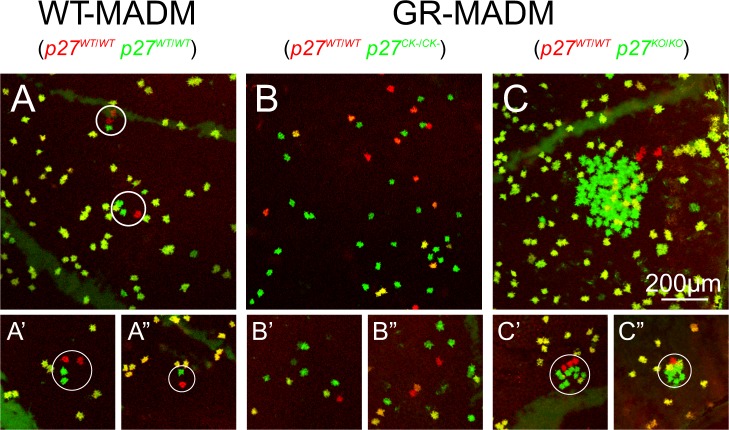
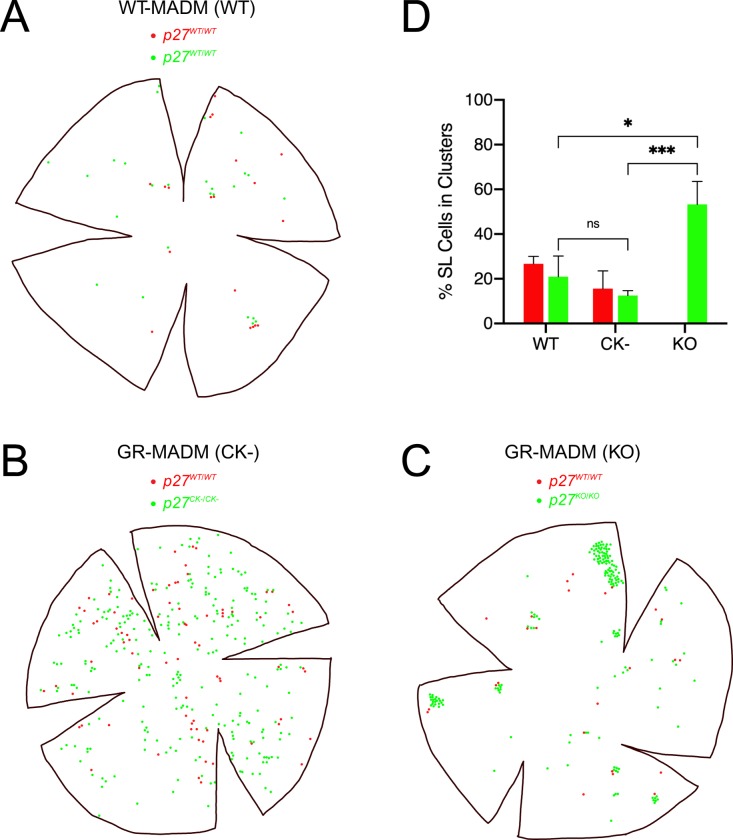
The cell cycle regulator p27Kip1 is a critical factor controlling cell number in many lineages. While its anti-proliferative effects are well-established, the extent to which this is a result of its function as a cyclin-dependent kinase (CDK) inhibitor or through other known molecular interactions is not clear. To genetically dissect its role in the developing corneal endothelium, we examined mice harboring two loss-of-function alleles, a null allele (p27-) that abrogates all protein function and a knockin allele (p27CK-) that targets only its interaction with cyclins and CDKs. Whole-animal mutants, in which all cells are either homozygous knockout or knockin, exhibit identical proliferative increases (~0.6-fold) compared with wild-type tissues. On the other hand, use of mosaic analysis with double markers (MADM) to produce infrequently-occurring clones of wild-type and mutant cells within the same tissue environment uncovers a roughly three- and six-fold expansion of individual p27CK-/CK- and p27-/- cells, respectively. Mosaicism also reveals distinct migration phenotypes, with p27-/- cells being highly restricted to their site of production and p27CK-/CK- cells more widely scattered within the endothelium. Using a density-based clustering algorithm to quantify dispersal of MADM-generated clones, a four-fold difference in aggregation is seen between the two types of mutant cells. Overall, our analysis reveals that, in developing mouse corneal endothelium, p27 regulates cell number by acting cell autonomously, both through its interactions with cyclins and CDKs and through a cyclin-CDK-independent mechanism(s). Combined with its parallel influence on cell motility, it constitutes a potent multi-functional effector mechanism with major impact on tissue organization.


Conflict of interest statement

One of us (JB), as an employee of BioVoxxel, Ludwigshafen, Germany, is engaged as a paid consultant and a developer of software that is distributed to the research community free of charge via ImageJ. This commercial affiliation does not alter our adherence to PLOS ONE policies on sharing data and materials.

Figures

Fig 1
Fig 1. Diagram summarizing MADM outcomes.
All experimental mice possess three transgenes: a ubiquitously-expressed Cre recombinase gene and two marker transgenes. Each marker transgene consists of partial N- or C-terminal coding sequences for GFP and RFP, reciprocally-arranged and interrupted by a single loxP site, on respective copies of chromosome 6. In a non-dividing cell (G0 or G1), Cre-catalyzed interchromosomal exchange results in functionally reconstituted fluorescent proteins in the same cell, which fluoresces yellow. However, in cycling cells S phase progression results in duplicated chromosomes which, upon functional recombination between homologous chromosomes in G2, produces differentially marked progeny. In the case of G2-X segregation, a pair of red and green cells is produced while G2-Z segregation results in colorless and yellow (double-labeled) cells. In the case of WT-MADM, all marked cells, regardless of color, are homozygous wild-type. However, in a heterozygous cell with a mutant p27 gene (the CK- allele is depicted) linked to the chromosome carrying a GFP-RFP cassette (GR-MADM), Cre-recombination and G2-X segregation after mitosis yields a wild-type red cell (p27WT/WT) and a mutant green cell (p27CK-/CK-). G2-Z segregation of mitotic cells generates colorless and yellow cells, both heterozygous, while recombination taking place in either G1 or G0 generates double-labeled cells in all cases without altering genotype.
Fig 2
Fig 2. Analysis of cell density in endothelial monolayers from organism-wide p27+/+ (WT/WT), p27CK−/CK− (CK-/CK-) and p27−/− mice (KO/KO).
(A-F) Apical cell boundaries revealed by anti-ZO-1 labeling. Compared with wild-type controls (A and B), increases in cell density are seen in both central and peripheral regions of p27CK−/CK− (C and D) and p27−/− (E and F) corneas. For each genotype, peripheral regions exhibit consistent decreases in density relative to corresponding central regions. (G) Quantitation of cell density. Data represent means ± SEM (n = 11 [wild-type] or 6 [mutants]). Ordinary two-way ANOVA followed by Tukey’s HSD test was performed. *** and *** indicate p<0.001 by comparison to wild-type, while ### indicates p<0.001 by comparison to central regions.
Fig 3
Fig 3. Visualization and analysis of single- and double-labeled cells in WT-MADM corneas.
(A) Tissue section. In this full-thickness cross-section, the anterior corneal surface faces upward. Arrows point to groups of labeled cells within the multilayered epithelium, while arrowheads indicate two stained CEnCs within the endothelial monolayer. (B) Tissue whole-mount. Single- (red and green) and double-labeled (yellow) endothelial cells (all p27+/+) are confined to a thin tissue layer that is generally well-separated optically from fluorescent protein-expressing epithelial and stromal cells. In some places, however, moderate undulation of the flat-mounted tissue leads to bleed through from the epithelial layer (green radial streaks). Boxed areas indicate regions of interest (ROIs) containing groups of single-labeled cells resulting from G2X recombination events. Insets show boxed areas at 2X magnification. (C) Distribution of twin spot sizes (see Materials and Methods for a description of how twin spots were identified). The majority (83%) of twin spots contain two to four cells. (D) Relative proportion of single-labeled GFP+- and RFP+-positive cells in whole corneas and twin spots. Approximately equal percentages of MADM-generated red and green cells are observed, whether the data include the total number of single-labeled cells in corneas and are expressed relative to all labeled cells (red, green and yellow; left) or only the subset of single-labeled cells in individual twin spots (right). Values plotted in (C) result from analysis of 23 twin spots from seven corneas. Data in (D) represent means ± SEM (n = 5). Unpaired t-test was performed. ns indicates not significant.
Fig 4
Fig 4. MADM analysis of homozygous p27CK−- and p27-expressing CEnCs.
(A and B) Whole-mounts of GR-MADM corneas (CK- and KO, respectively). Compared with WT-MADM tissues, increased numbers of single-labeled cells characterize corneas of both mutant genotypes. Boxed areas (ROIs) isolate groups of red and green cells, highlighting the enhanced numbers of mutant (GFP+) cells relative to wild-type (RFP+) cells in these areas. (C) Quantitative expansion of mutant versus wild-type cells. Each point represents the green-to-red cell ratio for all single-labeled cells of an individual cornea, with means for different genotypes indicated by horizontal lines. Roughly three- and six-fold increases in the ratio of mutant-to-wild-type cells is apparent for the p27CK− (CK-) and p27−/− (KO) mosaics, respectively. (D) Histogram of twin spot sizes for GR-MADM mutants, compared to WT-MADAM tissues (data replotted from Fig 3C). The few twin spots detected in p27CK− mosaic corneas are all relatively small. By contrast, the frequency distribution of these red and green cell-containing groups is shifted to larger sizes in p27−/− mosaics. (E) Expansion of mutant cells relative to wild-type cells in identifiable twin spots. Each point represents the green-to-red cell ratio for a single twin spot. Averaged data are represented as means ± SEM. In (C), n = 5 (WT), 6 (CK-) and 7 (KO). In (E), n = 23 (WT), 6 (CK-) and 20 (KO). Statistics was conducted by ordinary two-way ANOVA followed by Tukey’s HSD test. *, **, and **** indicate p<0.05, p<0.005 and p<0.0001, respectively. ns indicates not significant. Values plotted in (D) result from analysis of six twin spots from four corneas (p27CK− mosaics) and 20 twin spots from seven corneas (p27−/− mosaics).
Fig 5
Fig 5. Relative dispersion of MADM-generated single-labeled cells in wild-type and mutant mosaic endothelia.
(A-A”) WT-MADM. In twin spots (circled), red and green cells (both p27+/+) directly abut one another or are separated by, at most, one or two cell diameters. (B-B”) p27CK− GR-MADM. Note that GFP+- and RFP+ cells (mutant and wild-type, respectively) are more scattered within monolayers, with variable regions of unlabeled cells separating them. None of the cells in these ROIs belong to twin spots. (C-C”) p27KO GR-MADM. Compared with the other two genotypes, green cells (p27−/−) are packed together with little intervening space and oftentimes appear to be in direct contact with one another and with occasional yellow cells (p27+/−). Because of its large size, the group of single-labeled cells in (C) did not qualify as a single twin spot and, thus, is not circled.
Fig 6
Fig 6. Analysis of cell distribution patterns in mosaic wild-type and mutant corneas.
(A-C) Representative plots of GFP+ and RFP+ cells in WT-MADM (A), p27CK− GR-MADM (B) and p27KO GR-MADM (C) tissues. In (A), red and green cells (both p27+/+) appear in small clusters, as well as distributed as single cells within corneas. Many more MADM-generated cells are apparent in p27CK− and p27KO mosaics. However, the distribution patterns of GFP+ cells differ greatly between the two mutant mosaics. In p27 CK− GR-MADM tissues (B), homozygous mutant (green) cells are evenly dispersed within endothelial monolayers. By contrast, GFP+ cells in p27KO GR-MADM corneas (C) appear mainly in highly coherent clusters. (D) Cluster analysis. Compared with single-labeled (SL) GFP+ cells from wild-type and CK- mosaics, MADM-generated mutant cells in p27KO GR-MADM corneas are 2.5- and 4-fold more likely to be found in clusters. Bars represent means ± SEM (n = 4 [red cells] and 3 [green cells]) for WT, 4 [red cells] and 6 [green cells] for CK- and 7 [green cells] for KO). There were no clusters of p27+/+ (red) cells in p27KO mosaics. Statistical analysis was carried out using ordinary two-way ANOVA followed by Sidak’s multiple comparisons test. * and *** indicate p<0.005 and p<0.001, respectively. ns indicates not significant.

References

    1. Kreutziger GO. Lateral membrane morphology and gap junction structure in rabbit corneal endothelium. Exp Eye Res. 1976; 23:285–93. 10.1016/0014-4835(76)90129-9 - DOI - PubMed
    1. Hirsch M, Renard G, Faure J-P, Pouliquen Y. Study of the ultrastructure of the rabbit corneal endothelium by the freeze-fracture technique: apical and lateral junctions. Exp Eye Res. 1977. September; 25(3):277–88. 10.1016/0014-4835(77)90094-x - DOI - PubMed
    1. Ringvold A, Davanger M, Olsen EG. On the spatial organization of the cornea endothelium. Acta Ophthalmol. 1984. December; 62(6):911–8. 10.1111/j.1755-3768.1984.tb08442.x . - DOI - PubMed
    1. Forest F, Thuret G, DuMollard JM, Peoc’h M, Perrache C, He Z. Optimization of immunostaining on flat mounted human corneas. Mol Vis. 2015. December 30; 21:1345–1356. - PMC - PubMed
    1. Harrison TA, He Z, Boggs K, Thuret G, Liu HX, Defoe DM. Corneal endothelial cells possess an elaborate multipolar shape to maximize the basolateral to apical membrane area. Mol Vis. 2016. January 16;22:31–9. . - PMC - PubMed

Publication types

Substances