. 2020 Jan 13;15(1):e0227637.
doi: 10.1371/journal.pone.0227637. eCollection 2020.

Hesperidin improves insulin resistance via down-regulation of inflammatory responses: Biochemical analysis and in silico validation

Affiliations

Hesperidin improves insulin resistance via down-regulation of inflammatory responses: Biochemical analysis and in silico validation

Kanwal Rehman et al. PLoS One. .

Erratum in

Abstract

Leptin resistance and co-existing insulin resistance is considered as hallmark of diet-induced obesity. Here, we investigated therapeutic potential of hesperidin to improve leptin and insulin resistance using high fat diet (HFD)-induced obese experimental animal model. We also performed in silico studies to validate therapeutic effectiveness of hesperidin by performing protein-ligand docking and molecular dynamics simulation studies. Group 1 was identified as control group receiving vehicle only. Group 2 was marked as non-treated group receiving 60% HFD. While, other groups were treated daily with orlistat (120 mg/kg/d), hesperidin (55 mg/kg/d), combination of hesperidin (55 mg/kg/d) + orlistat (120 mg/kg/d). Hesperidin alone (P<0.001) and particularly in combination with orlistat (P<0.001), resulted in controlling the levels of HFD-altered biomarkers including random and fasting state of glycemia, leptin and insulin resistance. Similarly, hesperidin also improved the serum and tissue levels of leptin, interleukin-6 and tumor necrosis factor-alpha more significantly (P<0.05) when compared with that of orlistat. These results were found to be in accordance with the results of histopathological examination of pancreas, liver and adipose tissues. In-silico studies also proved that hesperidin binds to leptin receptor with higher affinity as compared to that of orlistat and induces the favorable variations in geometrical conformation of leptin receptor to promote its association with leptin which may lead to the cascades of reactions culminating the lipolysis of fats that may ultimately lead to cure obesity. The results of this study may be a significant expectation among the forthcoming treatment strategies for leptin and insulin resistance.


Conflict of interest statement

The authors have declared that no competing interests exist.

Figures
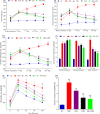
Fig 1
Fig 1
Effect of treatment on (A) body weight and (B-F) glycemia. The level of (B) fasting blood glucose and (C) random blood glucose was measured in all experimental groups on weekly basis. (D) Serum level of insulin from all experimental groups was measured at 1st, 15th, and 30th day of the treatment period. Before the end of treatment, (E) oral glucose tolerance test (OGTT) was performed by administering glucose (2 mg/kg body weight of rat) after an overnight starvation and blood was collected at predefined time points. (F) Insulin resistance was calculated by HOMA-IR using the fasting levels of serum insulin and blood glucose. The level of significant difference was estimated using Bonferroni post-test having two-way ANOVA. *** represent P<0.001 when compared with control group. * represent P<0.001 when compared with the HFD group, ** represent P<0.001 when compared ORL, HES and ORL+HES groups with HFD group, ° represent P<0.05 when compared with ORL group at 30th day of treatment.
Fig 2
Fig 2. Effect of treatment on lipidemia.
To determine the effect of HFD and treatment on lipid profile, serum level of (A) cholesterol, (B) TGs, (C) LDL and (D) HDL was measured at 1st, 15th and 30th day of the treatment period. The level of significant difference was estimated by Bonferroni post-test using two-way ANOVA. *** represent P<0.001 when compared with control group. ** represent P<0.001 when compared with HFD group. * represent P < 0.05 when compared HFD group. " represent P<0.05 when compared with control group. "" represent P<0.05 when compared with control group. ° represent P<0.05 when compared with ORL group.
Fig 3
Fig 3. Effect of treatment on leptinemia and inflammatory responses.
To estimate the effect of high-fat diet (HFD) and treatment on serum levels of (A) leptin (C) IL-6 and (E) TNF-α at 1st, 15th and 30th day, whereas, (B) leptin, (D) IL-6 and (F) TNF-α contents in tissue homogenate at the end of treatment period. For serum levels of leptin, IL-6 and TNF-α, the level of significant difference level was estimated by Bonferroni post-test using two-way ANOVA. *** represent P<0.001 when compared with control group. * represent P<0.05 when compared with HFD group. ** represent P<0.001 when compared with HFD group. ° represent P<0.01 when compared with ORL group. For leptin, IL-6 and TNF-α contents in tissue homogenate, the level of significant difference was estimated by Newman-Keuls multiple comparison test using one-way ANOVA. ** represent P<0.01 when compared with NC group. " represent P<0.01 when compared with HFD group. * represent P<0.05 when compared ORL group.
Fig 4
Fig 4. Effect of treatment on liver and kidney function biomarkers.
To determine the effect of HFD and treatment on liver and kidney, serum levels of (A) AST, (B) ALT, (C) BUN and (D) creatinine were measured at 1st, 15th and 30th day of the treatment period. The level of significant difference was estimated by Bonferroni post-test using two-way ANOVA. *** represent P < 0.001 when compared with control group. ** represent P<0.001 when compared with HFD group. ° represent P<0.05 when compared with ORL group.
Fig 5
Fig 5. Histopathological examination of body tissues.
(A-E) liver: (A) CN-group; Hepatic parenchyma (HP) is normal in appearance, hepatic cords arranged normally with prominent sinusoidal spaces (SS). Hepatocytes (HC) have prominent nuclei with normal chromatin. (B) HFD-group; Hepatic cords are not arranged in regular pattern. They are disrupted. HC indicating swelling having fatty changes with deposition of fat droplet inside cytoplasm. Infiltration of inflammatory cells (IC) at few places. (C) ORL-group; Bile duct hyperplasia (BDH) is present. Pyknotic nuclei (PN) is seen at few places indicating cell swelling and hepatoxic effects of orlistat were seen. Infiltration of inflammatory cells (IC) at few places indicating inflammatory changes. Blood congestion (BC) is present and prominent in most places. (D) HES-group; HC appearance is normal with prominent nuclei. Hepatic cords (HS) appearance is normal having normal SS. Presence of IC are seen at few places. (E) ORL+HES-group; Hepatic cords are normally arranged. Few HC are showing vascular degeneration along with cell swelling. BC is present at few places. Presence of IC are also seen at few places. (F-J) Pancreas: (F) CN-group; Intercalated duct (ID) is normal in appearance. Islet of Langerhans (IL) appears with normal pattern. (G) HFD-group; Lipid droplets (LD) are present indicating the fat deposition on pancreas. Slight injury was also seen in the acini. Islets inflammation (II) is also present. (H) ORL-group; Acinar atrophy (AA) was observed clearly. Blood congestion (BC) is present and clearly observed. Pancreatic degeneration was also observed. Inflammatory cells infiltration was observed in both islets of Langerhans and pancreatic acini. (I) HES-group; Islet of Langerhans appears normal. Inflammatory cells (IC) are seen at few places. (J) ORL+HES-group; Acinar cells (AC) are normal in appearance. Blood congestion (BC) is present at few places. Vascularization of islet of Langerhans (VIL) was also seen. Presence of inflammatory cells (IC) are also seen at few places. (K-O) adipose: (K) CN-group; Cytoplasm shows single and delimited vacuole (DV). The nucleus of tissue has central vacuole (CV) and there is presence of thin membrane (TM) between cells. (L) HFD-group; Increase in the size of the lipid droplets (LD) is seen. Adipocytes shows cytoplasm ring surrounding the lipid droplet having nucleus within the cells. Inflammation (IF) of the adipose tissue is also seen. (M) ORL-group; Reduction in the size of adipose tissue (AT) is seen. Congestion (BC) is also seen surrounding the tissue. (N) HES-group; Lobules of adipose tissue (LA) is seen. Blood vessels (BV) are also seen at few places. Gliotic white matter (GW) is also present. Congestion (BC) is seen at few places. (O) ORL+HES-group; Prominent changes are seen in the size reduction of adipocytes (AC). Congestion (BC) is seen at few places. Thin membrane (TM) is also seen between cells.
Fig 6
Fig 6. Obtained protein-protein and ligand-protein docking simulated conformations.
(A) Superimposing of compounds; ORL (Green) and HES (Yellow) docked to LBD-LPT complex. (B) Protein-protein docked model among LBD (cyan) and LPT (magenta) (C) Binding mode of compound ORL in LBD main binding site. (D) Binding mode of compound HES in LBD main binding site.
Fig 7
Fig 7
RMSDs of the receptor (Cα atoms) binding pocket (backbone atoms), and the ligand (heavy atoms) for (A) LBD-LPT, (B) ORL-LBD-LPT, (C) HES-LBD-LPT, (D) Comparison of residual flexibility profile between crystallographic LBD-LPT complex (black) and thee LBD-LPT complexes; LBD-LPT(blue), LBD-ORL (red), and LBD-HES (green) during a 50-ns MD simulation, as calculated by RMS fluctuation (RMSF), presented higher fluctuations in the LBD-HES than in LBD-LPT complex. (E) Superimposed structures of LBD-LPT (cyan-magenta) before and after (green-yellow) 50-ns MD simulations (F) ORL-LBD-LPT (green) before (yellow) after (G) HES-LBD-LPT (green) before (yellow) after 50-ns MD simulations.
Fig 8
Fig 8. Comparison between binding free energy terms of protein-ligand and protein-protein complexes.
(A) ORL- and HES-LBD-LPT (B) protein-protein (LBD-LPT) ligand bonded (ORL-and HES-LBD-LPT). Per-residue energy decomposition analysis for protein-protein and protein-ligand systems (C) ORL- and HES-LBD-LPT (D) protein-protein (LBD-LPT) ligand bonded (ORL-and HES-LBD-LPT).
Fig 9
Fig 9
Molecular structures of Orlistat (A) and hesperidin (B).

References

    1. Sainz N, Barrenetxe J, Moreno-Aliaga MJ, Martinez JA. Leptin resistance and diet-induced obesity: central and peripheral actions of leptin. Metabolism: clinical and experimental. 2015;64(1):35–46. Epub 2014/12/17. 10.1016/j.metabol.2014.10.015 . - DOI - PubMed
    1. Harris RBS. Direct and indirect effects of leptin on adipocyte metabolism. Biochim Biophys Acta. 2014;1842(3):414–23. Epub 05/17. 10.1016/j.bbadis.2013.05.009 . - DOI - PMC - PubMed
    1. Martin SS, Qasim A, Reilly MP. Leptin resistance: a possible interface of inflammation and metabolism in obesity-related cardiovascular disease. J Am Coll Cardiol. 2008;52(15):1201–10. 10.1016/j.jacc.2008.05.060 . - DOI - PMC - PubMed
    1. Bjørbaek C. Central leptin receptor action and resistance in obesity. J Investig Med. 2009;57(7):789–94. 10.2310/JIM.0b013e3181bb0d49 . - DOI - PMC - PubMed
    1. Jung UJ, Choi M-S. Obesity and its metabolic complications: the role of adipokines and the relationship between obesity, inflammation, insulin resistance, dyslipidemia and nonalcoholic fatty liver disease. Int J Mol Sci. 2014;15(4):6184–223. 10.3390/ijms15046184 . - DOI - PMC - PubMed

Publication types

MeSH terms