. 2019 Nov;7(22):632.
doi: 10.21037/atm.2019.10.115.

Modifiable risk factors for carotid atherosclerosis: a meta-analysis and systematic review

Affiliations

Modifiable risk factors for carotid atherosclerosis: a meta-analysis and systematic review

Xi Ji et al. Ann Transl Med. 2019 Nov.

Abstract

Background: Carotid atherosclerosis is a major cause of stroke, but the conclusion about risk factors for carotid atherosclerosis is still controversial. The aim of our present meta-analysis and systematic review was to explore the modifiable risk factors for carotid atherosclerosis.

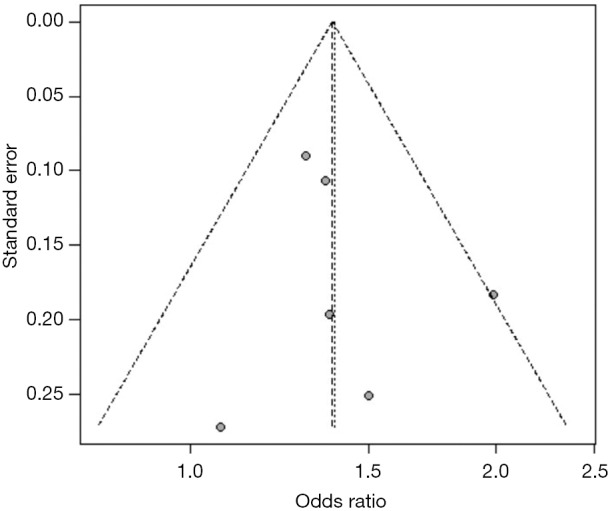
Methods: We searched PubMed from January 1962 to October 2018 to include longitudinal and cross-sectional studies. The results were pooled using random effects model. Heterogeneity was measured by I2 statistic and publication bias was assessed by funnel plots.

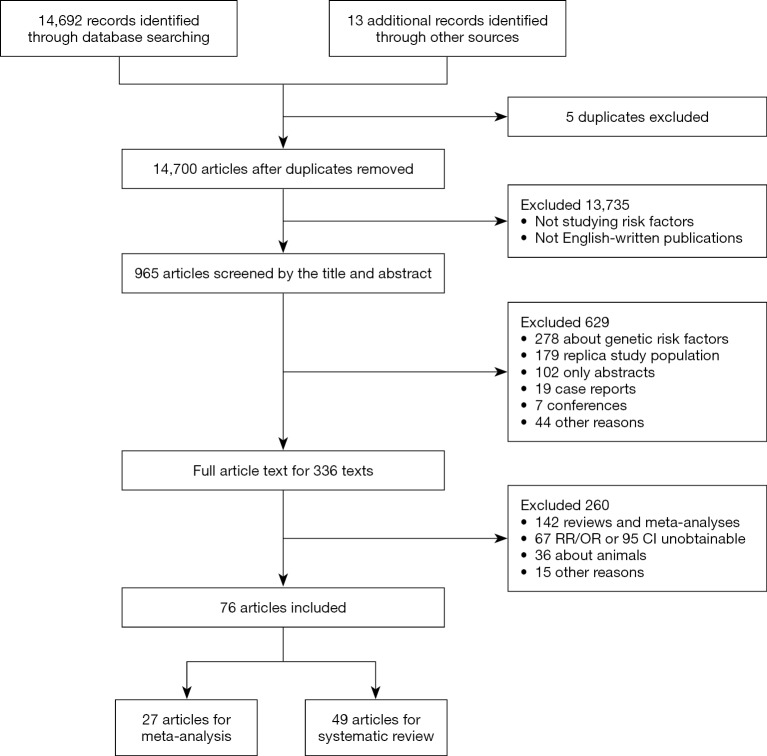
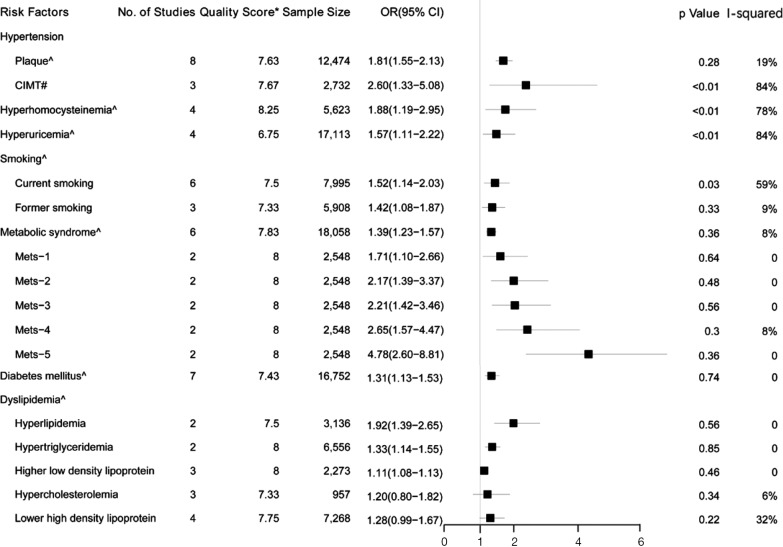
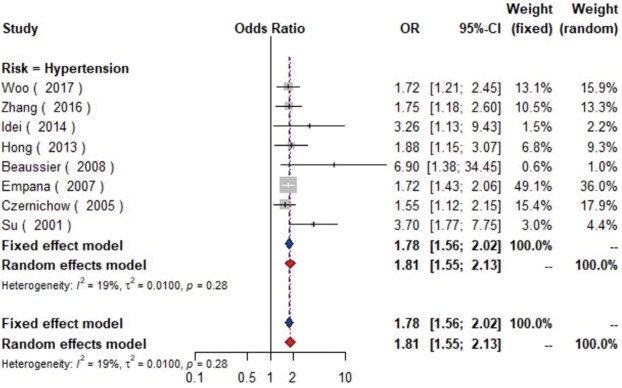
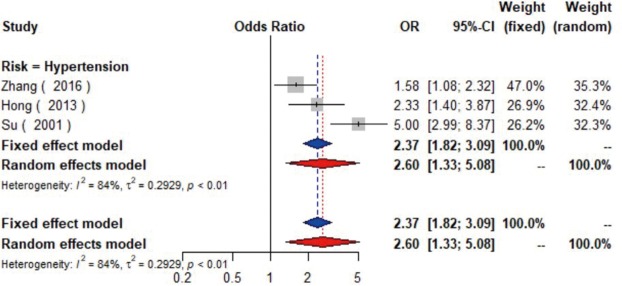
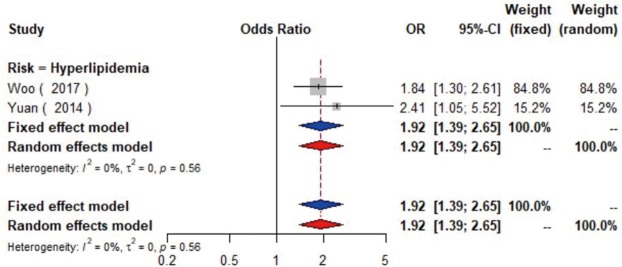
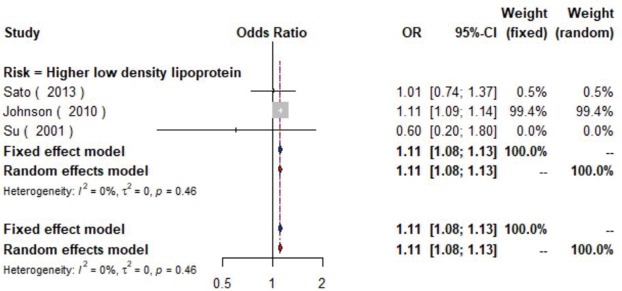
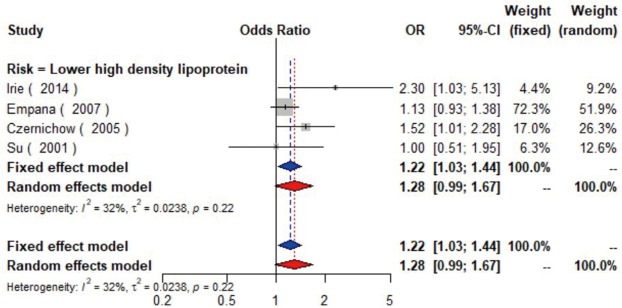
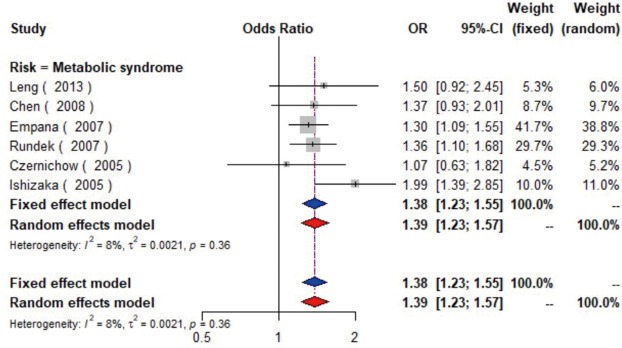
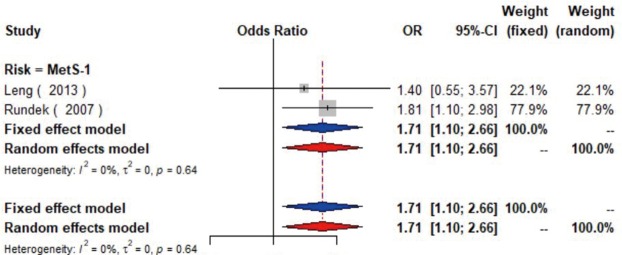
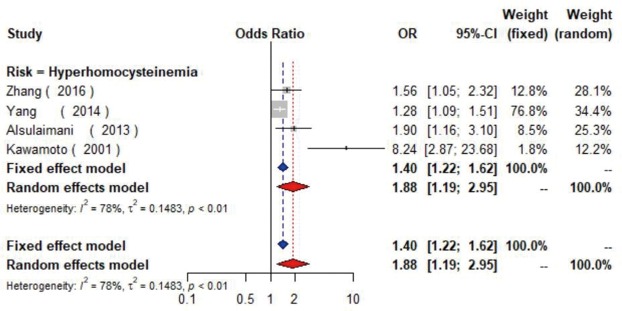
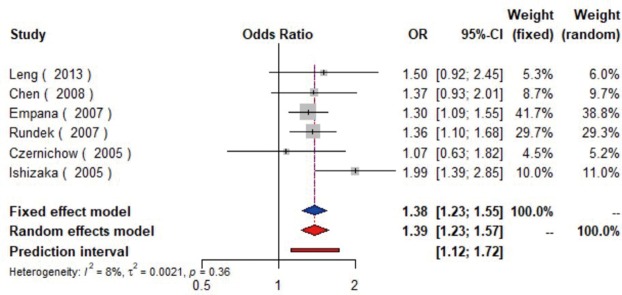
Results: A total of 14,700 articles were screened, of which 76 with 27 factors were eligible. Our meta-analysis of cross-sectional studies indicated nine factors (hyperlipidemia, hyperhomocysteinemia, hypertension, hyperuricemia, smoking, metabolic syndrome, hypertriglyceridemia, diabetes, and higher low density lipoprotein) were significantly associated with the presence of carotid plaque, among which four (hyperlipidemia, hyperhomocysteinemia, hypertension, and hyperuricemia) could elevate the risk of atherosclerosis by at least 50%; and one factor (hypertension) was associated with increased carotid intima-media thickness. In the systematic review, another five factors [negative emotion, socioeconomic strain, alcohol, air pollution, and obstructive sleep apnea syndrome (OSAS)] were also related to the presence of atherosclerosis. The cross-sectional associations with most of the above 14 factors were further confirmed by longitudinal studies. Among them, the managements of 4 factors (hypertension, hyperlipidemia, diabetes and OSAS) were indicated to prevent carotid atherosclerosis by cohort studies.

Conclusions: Effective interventions targeting pre-existing disease, negative emotion, lifestyle and diet may reduce the risk of carotid atherosclerosis. Further good-quality prospective studies are needed to confirm these findings.

Keywords: Carotid atherosclerosis; carotid intima-media thickness; carotid plaque; meta-analysis; risk factors.


Conflict of interest statement

Conflicts of Interest: The authors have no conflicts of interest to declare.

Figures

Figure 1
Figure 1
Flow chart of identified studies.
Figure 2
Figure 2
Forest plot shows the risk factors for carotid atherosclerosis in the meta-analysis. OR, odds ratio; 95% CI, 95% confidence interval. Quality Score*, mean quality score of included studies; ^ presence of carotid plaque; # increased carotid intima-media thickness.
Figure 3
Figure 3
Factors showing significant positive and negative association with carotid atherosclerosis. DM, diabetes mellitus; MetS, metabolic syndrome; Hcy, homocysteine; HDL, how density lipoprotein; LDL, low density lipoprotein; TC, total cholesterol; TG, Triglyceride; OSAS, obstructive sleep apnea syndrome; CPAP, continuous positive airway pressure. Risk factors of meta-analysis are above the dotted line; Risk factors of systematic review are below the dotted line; The dots with four different filled ratios below risk factors represent different total sample size ranges; Different colors represent different quality score ranges.
Figure S1
Figure S1
The forest plot shows the relationship between hypertension and the presence of carotid plaque. Each comparison is presented by the name of the first author and the year of publication. The contrast has an OR of 1.81 (95% CI: 1.55–2.13, P=0.28) in the random effects model. Values more than 1 denote an increased risk for the presence of carotid plaque with hypertension. CI indicates confidence interval; OR, odds ratio.
Figure S2
Figure S2
The forest plot shows the relationship between hypertension and the increased carotid intima media thickness. Each comparison is presented by the name of the first author and the year of publication. The contrast has an OR of 2.60 (95% CI: 1.33–5.08, P<0.01) in the random effects model. Values more than 1 denote an increased risk for the increased carotid intima media thickness with hypertension. CI, confidence interval; OR, odds ratio.
Figure S3
Figure S3
The forest plot shows the relationship between diabetes mellitus and the presence of carotid plaque. Each comparison is presented by the name of the first author and the year of publication. The contrast has an OR of 1.31 (95% CI: 1.13–1.53, P=0.74) in the random effects model. Values more than 1 denote an increased risk for the presence of carotid plaque with diabetes mellitus. CI, confidence interval; OR, odds ratio.
Figure S4
Figure S4
The forest plot shows the relationship between hyperlipidemia and the presence of carotid plaque. Each comparison is presented by the name of the first author and the year of publication. The contrast has an OR of 1.92 (95% CI: 1.39–2.65, P=0.56) in the random effects model. Values more than 1 denote an increased risk for the presence of carotid plaque with hyperlipidemia. CI, confidence interval; OR, odds ratio.
Figure S5
Figure S5
The forest plot shows the relationship between hypertriglyceridemia and the presence of carotid plaque. Each comparison is presented by the name of the first author and the year of publication. The contrast has an OR of 1.33 (95% CI: 1.14–1.55, P=0.85) in the random effects model. Values more than 1 denote an increased risk for the presence of carotid plaque with hyperlipidemia. CI, confidence interval; OR, odds ratio.
Figure S6
Figure S6
The forest plot shows the relationship between higher low density lipoprotein and the presence of carotid plaque. Each comparison is presented by the name of the first author and the year of publication. The contrast has an OR of 1.11 (95% CI: 1.08–1.13, P=0.46) in the random effects model. Values more than 1 denote an increased risk for the presence of carotid plaque with higher low-density lipoprotein. CI, confidence interval; OR, odds ratio.
Figure S7
Figure S7
The forest plot shows the relationship between hypercholesterolemia and the presence of carotid plaque. Each comparison is presented by the name of the first author and the year of publication. The contrast has an OR of 1.20 (95% CI: 0.80–1.82, P=0.34) in the random effects model. Values across 1 means there are no relationship between hypercholesterolemia and the presence of carotid plaque. CI, confidence interval; OR, odds ratio.
Figure S8
Figure S8
The forest plot shows the relationship between lower high density lipoprotein and the presence of carotid plaque. Each comparison is presented by the name of the first author and the year of publication. The contrast has an OR of 1.28 (95% CI: 0.99–1.67, P=0.22) in the random effects model. Values across 1 means there are no relationship between lower high-density lipoprotein and the presence of carotid plaque. CI, confidence interval; OR, odds ratio.
Figure S9
Figure S9
The forest plot shows the relationship between metabolic syndrome and the presence of carotid plaque. Each comparison is presented by the name of the first author and the year of publication. The contrast has an OR of 1.39 (95% CI: 1.23–1.57, P=0.36) in the random effects model. Values more than 1 denote an increased risk for the presence of carotid plaque with metabolic syndrome. CI, confidence interval; OR, odds ratio.
Figure S10
Figure S10
The forest plot shows the relationship between one component of metabolic syndrome and the presence of carotid plaque. Each comparison is presented by the name of the first author and the year of publication. The contrast has an OR of 1.71 (95% CI: 1.10–2.66, P=0.64) in the random effects model. Values more than 1 denote an increased risk for the presence of carotid plaque with one component of metabolic syndrome. CI, confidence interval; OR, odds ratio; MetS-1, one component of metabolic syndrome.
Figure S11
Figure S11
The forest plot shows the relationship between two components of metabolic syndrome and the presence of carotid plaque. Each comparison is presented by the name of the first author and the year of publication. The contrast has an OR of 2.17 (95% CI: 1.39–3.37, P=0.48) in the random effects model. Values more than 1 denote an increased risk for the presence of carotid plaque with two components of metabolic syndrome. CI, confidence interval; OR, odds ratio; MetS-2, two components of metabolic syndrome.
Figure S12
Figure S12
The forest plot shows the relationship between three components of metabolic syndrome and the presence of carotid plaque. Each comparison is presented by the name of the first author and the year of publication. The contrast has an OR of 2.21 (95% CI: 1.42–3.46, P=0.56) in the random effects model. Values more than 1 denote an increased risk for the presence of carotid plaque with three components of metabolic syndrome. CI, confidence interval; OR, odds ratio; MetS-3, three components of metabolic syndrome.
Figure S13
Figure S13
The forest plot shows the relationship between four components of metabolic syndrome and the presence of carotid plaque. Each comparison is presented by the name of the first author and the year of publication. The contrast has an OR of 2.65 (95% CI: 1.57–4.47, P=0.30) in the random effects model. Values more than 1 denote an increased risk for the presence of carotid plaque with four components of metabolic syndrome. CI, confidence interval; OR, odds ratio; MetS-4, four components of metabolic syndrome.
Figure S14
Figure S14
The forest plot shows the relationship between five components of metabolic syndrome and the presence of carotid plaque. Each comparison is presented by the name of the first author and the year of publication. The contrast has an OR of 4.78 (95% CI: 2.60–8.81, P=0.36) in the random effects model. Values more than 1 denote an increased risk for the presence of carotid plaque with five components of metabolic syndrome. CI, confidence interval; OR, odds ratio; MetS-5, five components of metabolic syndrome.
Figure S15
Figure S15
The forest plot shows the relationship between hyperuricemia and the presence of carotid plaque. Each comparison is presented by the name of the first author and the year of publication. The contrast has an OR of 1.57 (95% CI: 1.11–2.22, P<0.01) in the random effects model. Values more than 1 denote an increased risk for the presence of carotid plaque with hyperuricemia. CI, confidence interval; OR, odds ratio.
Figure S16
Figure S16
The forest plot shows the relationship between hyperhomocysteinemia and the presence of carotid plaque. Each comparison is presented by the name of the first author and the year of publication. The contrast has an OR of 1.88 (95% CI: 1.19–2.95, P<0.01) in the random effects model. Values more than an increased risk for the presence of carotid plaque with hyperhomocysteinemia. CI, confidence interval; OR, odds ratio.
Figure S17
Figure S17
The forest plot shows the relationship between current smoking and the presence of carotid plaque. Each comparison is presented by the name of the first author and the year of publication. The contrast has an OR of 1.52 (95% CI: 1.14–2.03, P=0.03) in the random effects model. Values more than an increased risk for the presence of carotid plaque with current smoking. CI, confidence interval; OR, odds ratio.
Figure S18
Figure S18
The forest plot shows the relationship between former smoking and the presence of carotid plaque. Each comparison is presented by the name of the first author and the year of publication. The contrast has an OR of 1.42 (95% CI: 1.08–1.87, P=0.33) in the random effects model. Values more than an increased risk for the presence of carotid plaque with former smoking. CI, confidence interval; OR, odds ratio.
Figure S19
Figure S19
Funnel plot for publication bias in studies on hypertension and the presence of carotid plaque. The asymmetry of the funnel plot suggests that publication bias may exist.
Figure S20
Figure S20
Funnel plot for publication bias in studies on diabetes mellitus and the presence of carotid plaque. The asymmetry of the funnel plot suggests that publication bias may exist.
Figure S21
Figure S21
Funnel plot for publication bias in studies on metabolic syndrome and the presence of carotid plaque. The asymmetry of the funnel plot suggests that publication bias may exist.
Figure S22
Figure S22
Funnel plot for publication bias in studies on current smoking and the presence of carotid plaque. The asymmetry of the funnel plot suggests that publication bias may exist.
Figure S23
Figure S23
After using the trim and filling method, the change of the merger effect was not obvious. The results were moderate, which means hypertension is a risk factor for the presence of carotid plaque.
Figure S24
Figure S24
After using the trim and filling method, the change of the merger effect was not obvious. The results were moderate, which means diabetes mellitus is a risk factor for the presence of carotid plaque.
Figure S25
Figure S25
After using the trim and filling method, the change of the merger effect was not obvious. The results were moderate, which means metabolic syndrome is a risk factor for the presence of carotid plaque.
Figure S26
Figure S26
After using the trim and filling method, the merger effect became non-significant. The results were not moderate, which means the caution is needed in drawing conclusion.

References

    1. Jose PO, Frank AT, Kapphahn KI, et al. Cardiovascular disease mortality in Asian Americans. J Am Coll Cardiol 2014;64:2486-94. 10.1016/j.jacc.2014.08.048 - DOI - PMC - PubMed
    1. Mehanna R, Jankovic J. Movement disorders in cerebrovascular disease. Lancet Neurol 2013;12:597-608. 10.1016/S1474-4422(13)70057-7 - DOI - PubMed
    1. Hankey GJ. Stroke. Lancet 2017;389:641-54. 10.1016/S0140-6736(16)30962-X - DOI - PubMed
    1. Inaba Y, Chen JA, Bergmann SR. Carotid plaque, compared with carotid intima-media thickness, more accurately predicts coronary artery disease events: a meta-analysis. Atherosclerosis 2012;220:128-33. 10.1016/j.atherosclerosis.2011.06.044 - DOI - PubMed
    1. Park J, Park H. Effects of 6 months of aerobic and resistance exercise training on carotid artery intima media thickness in overweight and obese older women. Geriatr Gerontol Int 2017;17:2304-10. 10.1111/ggi.12972 - DOI - PubMed