. 2020 Jan 13;11(1):6.
doi: 10.1186/s13244-019-0810-y.

Mapping the ischemic penumbra and predicting stroke progression in acute ischemic stroke: the overlooked role of susceptibility weighted imaging

Affiliations

Mapping the ischemic penumbra and predicting stroke progression in acute ischemic stroke: the overlooked role of susceptibility weighted imaging

Eman A F Darwish et al. Insights Imaging. .

Abstract

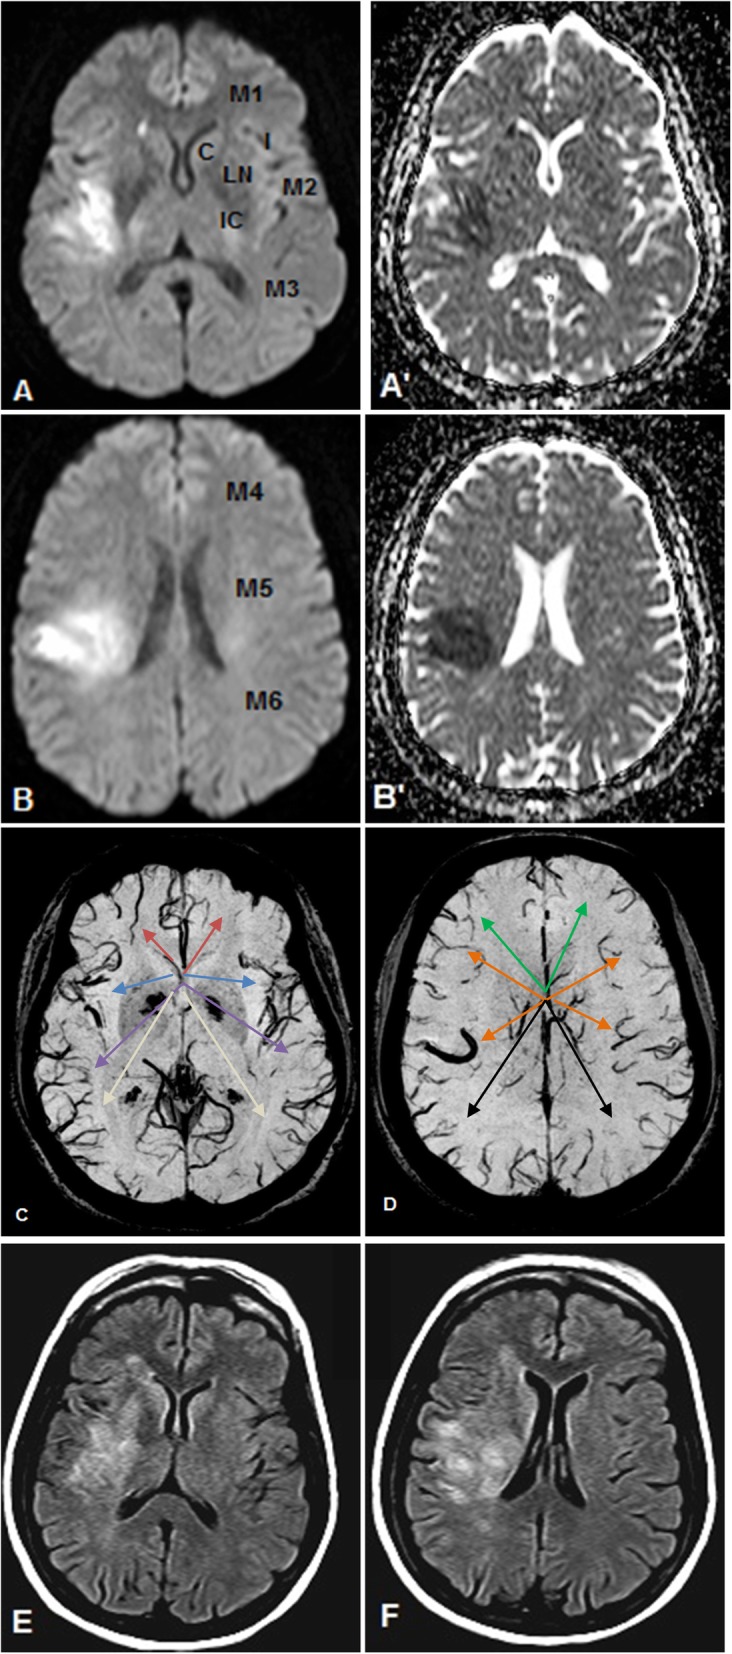
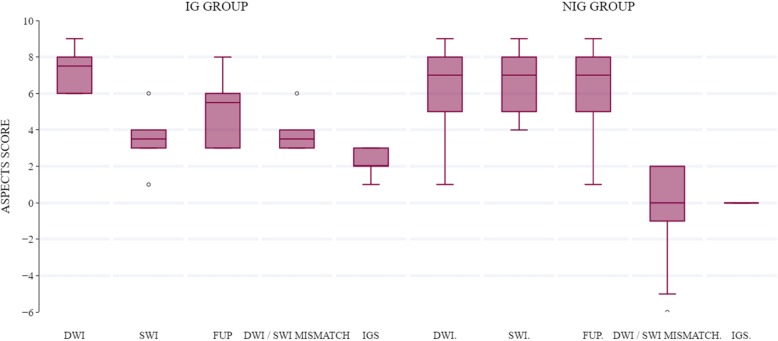
Objectives: Asymmetrically prominent veins (APVs) detected on susceptibility weighted imaging (SWI) in acute stroke patients are assumed to signify compromised cerebral perfusion. We aimed to explore the role of APVs in identifying the ischemic penumbra and predicting stroke progression in acute stroke patients METHODS: Twenty patients with a middle cerebral artery ischemic infarction presenting within 24 h of symptoms onset underwent SWI following our standard MR stroke protocol imaging sequences which included diffusion-weighted imaging (DWI). Follow-up (FUP) FLAIR images were obtained at least 5 days after the initial MRI study. The Alberta Stroke Program Early CT Score (ASPECTS) was used to determine the initial infarct size, extent of APVs and final infarct size on initial DWI, SWI, and FUP images respectively. For each patient, SWI was compared with DWI images to determine match/mismatch of their respective ASPECTS values and calculate mismatch scores, whereas acute DWI findings were compared with follow-up images to identify infarct growth (IG) and calculate infarction growth scores (IGS).

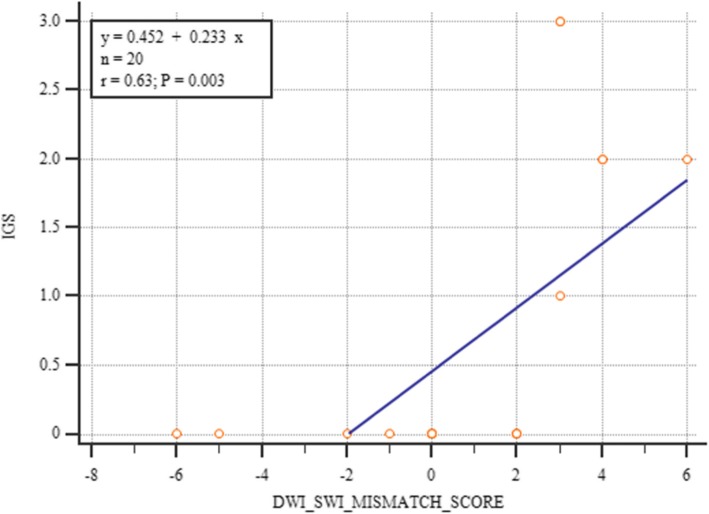
Results: IG occurred in 6/10 patients with a positive DWI-SWI mismatch and in none of the patients without a positive DWI-SWI mismatch. A positive DWI/SWI mismatch was significantly associated with IG (χ2 = 8.57, p = 0.0138, Cramer's V = 0.65). A significant inverse correlation was found between SWI ASPECTS and IGS (rs = - 0.702, p = 0.001). DWI-SWI mismatch scores were strongly correlated with IGS. (rs = 0.788, p = 0.000) CONCLUSION: A positive DWI-SWI mismatch is an indicator of the ischemic penumbra and a predictor of infarct expansion if left untreated.

Keywords: Asymmetrically prominent veins; DWI-SWI mismatch; Penumbra; Stroke; Susceptibility weighted imaging.


Conflict of interest statement

The authors declare that they have no competing interests.

Figures

Fig. 1
Fig. 1
af 60-year-old female with right MCA territory infarct. The 10 MCA zones designated by the ASPECTS scoring system are C caudate, L lentiform nucleus, IC internal capsule, I insular ribbon, M1–6 cortical regions (M1–3 at the level of basal ganglia, M4–6 at the level cranial to the basal ganglia). Initial DW images and their corresponding ADC maps at the basal ganglia level (a, a') and the supraganglionic level (b, b') reveal the presence of acute infarction in I, M1, M2, and M5 regions with a resultant ASPECTS score of 6. SW images at the basal ganglia level (c) and the supraganglionic level (d) reveal the presence of APVs, in terms of either density and/or caliber and/or hypointensity, in I (blue arrow) and in M1–6 regions (red, purple, gray, green, orange, and black arrows respectively) with a resultant ASPECTS score of 3 (similar colored arrows point to the corresponding areas in the contralateral normal hemisphere for comparison). DWI/SWI mismatch score is 3. Follow up FLAIR images, obtained 10 days later, at the basal ganglia level (e) and the supraganglionic level (f) reveal in addition to the originally infarcted zones, infarction growth in L, IC, and M4, giving an overall ASPECTS score of 3 and an IGS of 3. The faint hyperintensities noted at M3 and M6 zones were considered to be ischemic foci and not newly infarcted areas as they were evident in the FLAIR images of the initial MRI with no corresponding diffusion restriction
Fig. 2
Fig. 2
af 52-years-old male with left MCA territory infarct. Initial DW images and their corresponding ADC maps at the basal ganglia level (a, a') and the supraganglionic level (b, b') reveal the presence of an acute infarction in I, M1, M2, M4 and M5 regions with a resultant ASPECTS score of 5. SW images at the basal ganglia level (c) and the supraganglionic level (d) reveal the presence of APVs, in terms of either density and/or caliber and/or hypointensity, in I (red arrow) and in M2, M3 and to a milder extent in M4 regions (purple, green, and white arrows respectively) with a resultant ASPECTS score of 6 (similar colored arrows point to the corresponding areas in the contralateral normal hemisphere for comparison). DWI/SWI mismatch score is − 1. Despite the overall negative mismatch, the presence of APVs in the M3 zone, which did not show an acute infarction in the initial DW images, indicates the presence of a hidden mismatch. However, follow up FLAIR images obtained 5 days later, at the basal ganglia level (e) and the supraganglionic level (f), reveal the presence of signal alteration in precisely the same zones that showed restriction in the initial DW images with no infarct progression
Fig. 3
Fig. 3
Box plots of DWI, SWI, and FUP ASPECTS values as well as DWI/SWI mismatch and IG scores in both patient groups. Middle lines represent median values, boxes represent 25th to 75th percentiles, and whiskers demonstrate range. DWI diffusion-weighted imaging, SWI susceptibility-weighted imaging, FUP follow up, IG infarction growth, IGS infarction growth score, NIG no infarction growth
Fig. 4
Fig. 4
Correlation between DWI/SWI mismatch and IG scores. There was a significant positive correlation between DWI/SWI mismatch and IG scores (n = 20, rs = 0.788, p = 0.000 [HS])

References

    1. Tomandl BF, Klotz E, Handschu R, et al. Comprehensive imaging of ischemic stroke with multisection CT. Radiographics. 2003;23:565–592. - PubMed
    1. Lee Deok Hee, Kang Dong-Wha, Ahn Jae Sung, Choi Choong Gon, Kim Sang Joon, Suh Dae Chul. Imaging of the Ischemic Penumbra in Acute Stroke. Korean Journal of Radiology. 2005;6(2):64. - PMC - PubMed
    1. Wu X, Luo S, Wang Y, et al. Use of susceptibility-weighted imaging in assessing ischemic penumbra: A case report. Medicine (Baltimore) 2017;96(6):e6091. - PMC - PubMed
    1. Munich SA, Shakir HJ, Snyder KV. Role of CT perfusion in acute stroke management. Cor et Vasa. 2016;58(2):e215–e224.
    1. Kao Hung-Wen, Tsai Fong Y., Hasso Anton N. Predicting stroke evolution: comparison of susceptibility-weighted MR imaging with MR perfusion. European Radiology. 2012;22(7):1397–1403. - PubMed

LinkOut - more resources