

Pharmacometrics and Machine Learning Partner to Advance Clinical Data Analysis
- PMID: 31930487
- PMCID: PMC7158220
- DOI: 10.1002/cpt.1774
Pharmacometrics and Machine Learning Partner to Advance Clinical Data Analysis
Abstract
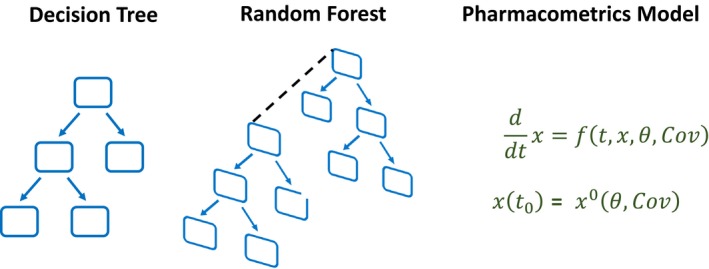
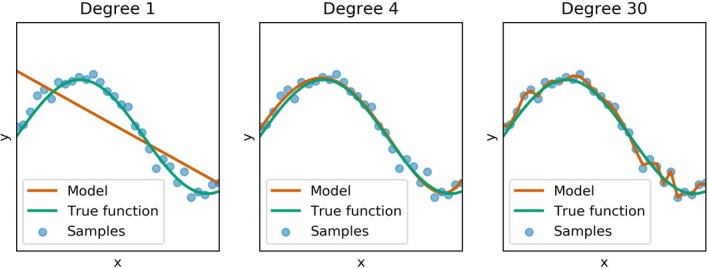
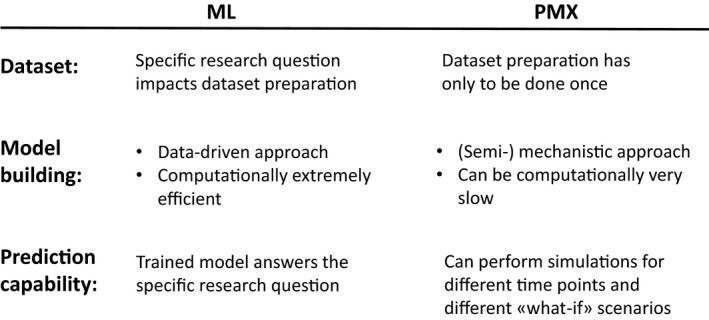
Clinical pharmacology is a multidisciplinary data sciences field that utilizes mathematical and statistical methods to generate maximal knowledge from data. Pharmacometrics (PMX) is a well-recognized tool to characterize disease progression, pharmacokinetics, and risk factors. Because the amount of data produced keeps growing with increasing pace, the computational effort necessary for PMX models is also increasing. Additionally, computationally efficient methods, such as machine learning (ML) are becoming increasingly important in medicine. However, ML is currently not an integrated part of PMX, for various reasons. The goals of this article are to (i) provide an introduction to ML classification methods, (ii) provide examples for a ML classification analysis to identify covariates based on specific research questions, (iii) examine a clinically relevant example to investigate possible relationships of ML and PMX, and (iv) present a summary of ML and PMX tasks to develop clinical decision support tools.
© 2020 The Authors. Clinical Pharmacology & Therapeutics published by Wiley Periodicals, Inc. on behalf of American Society for Clinical Pharmacology and Therapeutics.
Conflict of interest statement
All authors declared no competing interests for this work.
Figures
References
-
- Dhar, V. Data science and prediction. Commun. ACM 56, 64—73 (2013).
-
- Dost F. Der Blutspiegel (Georg Thieme, Leipzig, 1953).
-
- Sheiner, L.B. , Rosenberg, B. & Marathe, V.V. Estimation of population characteristics of pharmacokinetic parameters from routine clinical data. J. Pharmacokinet. Biopharmaceut. 5, 445–479 (1977). - PubMed
-
- Sheiner, L.B. & Beal, S.L. Evaluation of methods for estimating population pharmacokinetics parameters. I. Michaelis‐Menten model: routine clinical pharmacokinetic data. J. Pharmacokinet. Biopharmaceut. 8, 553–571 (1980). - PubMed
MeSH terms
LinkOut - more resources
Full Text Sources
