. 2020 Jun;102(5):1008-1025.
doi: 10.1111/tpj.14683. Epub 2020 Feb 28.

Genome ancestry mosaics reveal multiple and cryptic contributors to cultivated banana

Affiliations

Genome ancestry mosaics reveal multiple and cryptic contributors to cultivated banana

Guillaume Martin et al. Plant J. 2020 Jun.

Abstract

Hybridizations between closely related species commonly occur in the domestication process of many crops. Banana cultivars are derived from such hybridizations between species and subspecies of the Musa genus that have diverged in various tropical Southeast Asian regions and archipelagos. Among the diploid and triploid hybrids generated, those with seedless parthenocarpic fruits were selected by humans and thereafter dispersed through vegetative propagation. Musa acuminata subspecies contribute to most of these cultivars. We analyzed sequence data from 14 M. acuminata wild accessions and 10 M. acuminata-based cultivars, including diploids and one triploid, to characterize the ancestral origins along their chromosomes. We used multivariate analysis and single nucleotide polymorphism clustering and identified five ancestral groups as contributors to these cultivars. Four of these corresponded to known M. acuminata subspecies. A fifth group, found only in cultivars, was defined based on the 'Pisang Madu' cultivar and represented two uncharacterized genetic pools. Diverse ancestral contributions along cultivar chromosomes were found, resulting in mosaics with at least three and up to five ancestries. The commercially important triploid Cavendish banana cultivar had contributions from at least one of the uncharacterized genetic pools and three known M. acuminata subspecies. Our results highlighted that cultivated banana origins are more complex than expected - involving multiple hybridization steps - and also that major wild banana ancestors have yet to be identified. This study revealed the extent to which admixture has framed the evolution and domestication of a crop plant.

Keywords: Musa acuminata; admixture; diversity; genome ancestry; hybridization.


Conflict of interest statement

The authors declare no conflicts of interest.

Figures

Figure 1
Figure 1
Global genotyping statistics. (a) Heterozygosity levels among wild and cultivated banana accessions. Heterozygosity was calculated as the number of heterozygous sites within the accession divided by the total number of single nucleotide polymorphism sites in the vcf file. (b) Proportion of specific alleles in the studied accessions. This proportion was calculated as the percentage of polymorphic sites in which at least one allele was not found in other accessions of the dataset. (c) Global genetic structure of the dataset obtained via admixture analysis with six ancestral populations.
Figure 2
Figure 2
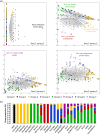
Factorial analysis performed on diploid accessions representing six ancestries. Correspondence analysis was performed only on diploid accessions identified as homogeneous according to admixture analysis. (a) Axis inertia. (b) Projection of accessions along synthetic axes 1 and 2 discriminating Musa acuminata and M. balbisiana accessions. (c) Projection of accessions along synthetic axes 2 and 3 discriminating M. a. ssp. banksii, M. a. ssp. zebrina and M. a. ssp. burmannica/siamea accessions. (d) Projection of accessions along synthetic axes 2 and 4 discriminating the ‘Pisang Madu’ accession from other accessions. (e) Projection of accessions along synthetic axes 2 and 5 discriminating M. a. ssp. malaccensis accessions from other accessions. (f) Projection of accessions along synthetic axes 2 and 6.
Figure 3
Figure 3
Clustering of ancestry informative alleles. (a) Alleles corresponding to variables of the correspondence analysis were projected along synthetic axes and clustered using a mean shift algorithm. Eight groups (0, 1, 2, 3, 4, 5, 6 and 7) were identified. (b) Proportions of alleles from each group in the 25 banana accessions. The proportion was calculated for each accession as the number of alleles specific to a group divided by the total number of grouped alleles in the accession. The central group (0), which corresponded to non‐informative alleles, was not used for the proportion estimation.
Figure 4
Figure 4
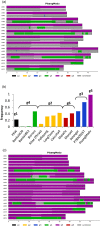
‘Pisang Madu’ local ancestry estimation. (a) Local ancestry estimation for the ‘Pisang Madu’ accession based on the first assumption that group 5 corresponded to a single ancestor. (b) Frequency of heterozygous alleles of the main ancestral group present in each representative accession. For each representative accession, the frequency was calculated as the number of sites having exactly one allele of the group over the number of sites with at least one allele of the group. Very high heterozygous frequency for group 5 suggested the contribution of two different ancestries to this group. This led to a new estimation of group 5 ancestry in the studied genotypes. (c) ‘Pisang Madu’ local ancestry mosaic based on the assumption that group 5 consisted of two distinct genetic pools.
Figure 5
Figure 5
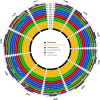
Circular representation of the local ancestry mosaic in wild M. acuminata accessions. The outer circle represents the 11 chromosomes of the M. acuminata reference genome with dark coloured centromeric regions. Inner circles represent, for each studied accession, the two predicted ancestry pseudo‐‘haplotypes’. Assigned ancestries are represented by coloured blocks: black, group 1 ‘balbisiana’ (M. balbisiana); yellow, group 2 ‘burmannica/siamea’; blue, group 3 ‘malaccensis’; green, group 4 ‘Banksii/Borneo’; purple, group 5 ‘Pisang Madu’ and red, group 6 ‘zebrina’. Unassigned regions are in grey. Accession names are abbreviated: 008, ‘PT‐BA‐00008’; Mic, ‘Microcarpa’; Bor, ‘Borneo’; THA, ‘THA018’; 267, ‘PT‐BA‐00267’; Sel, ‘Selangor’; Mon, ‘Monyet’; MaO, ‘Maia Oa’; Ba6, ‘Banksii ITC0620’; Ba8, ‘Banksii ITC0853’; KhP, ‘Khae Phrae’; PaR, ‘Pa Rayong’; LoT, ‘Long Tavoy’; Ca4, ‘Calcutta 4’; and PKW, M. balbisiana ‘Pisang Klutuk Wulung’.
Figure 6
Figure 6
Representation of the local ancestry mosaic in diploid ‘AAcv’ banana cultivars. Assigned ancestries are represented by coloured blocks: yellow, group 2 ‘burmannica/siamea’; blue, group 3 ‘malaccensis’; green, group 4 ‘Banksii/Borneo’; purple, group 5 ‘Pisang Madu’ and red, group 6 ‘zebrina’. Unassigned regions are in grey. (a) Circular representation of the ancestry mosaic of diploid ‘AAcv’ banana cultivars. The outer circle represents the 11 chromosomes of the M. acuminata reference genome with dark coloured centromeric regions. Inner circles represent, for each studied accession, the two predicted ancestry pseudo‐‘haplotypes’. Accession names are abbreviated: Kir, ‘Kirun’; GuN, ‘Gu Nin Chiao’; Man, ‘Manang’; Chi, ‘Chicame’; Gal, ‘Galeo’; SF2, ‘SF.215’; Mal, ‘Mala’; Guy, ‘Guyod’; Mad, ‘Pisang Madu’. (b) Linear representation of the relatively simple mosaic of the ‘Mala’ accession. (c) Linear representation of the mosaic of the ‘Manang’ accession with at least five ancestral group contributions.
Figure 7
Figure 7
Circular representation of the local ancestry mosaic of the triploid ‘Grande Naine’ banana cultivar and comparison with candidate 2n and n gamete donors. From the outer circle to the inner circle: (a) M. acuminata reference chromosomes with dark coloured centromeric regions. (b) Predicted mosaic structure of the diploid ‘Chicame’ accession. (c) Shared allele proportions along chromosomes, between ‘Grande Naine’ and ‘Chicame’ accessions. Green, blue and red curves represent the proportion of variant sites in which both one and no ‘Chicame’ alleles, respectively, were found in ‘Grande Naine’. (d) Predicted mosaic structure of the triploid ‘Grande Naine’ accession. (e) Shared allele proportions between the remaining haplotype of ‘Grande Naine’ and ‘Pisang Madu’ accession. Blue and red curves represent the proportion of variant sites in which one and no ‘Pisang Madu’ alleles, respectively, were found in ‘Grande Naine’. (f) Predicted mosaic structure of the ‘Pisang Madu’ accession. Assigned ancestries are represented by coloured blocks: blue, group 3 ‘malaccensis’; green, group 4 ‘Banksii/Borneo’; purple, group 5 ‘Pisang Madu’ and red, group 6 ‘zebrina’. Unassigned regions are in grey.

References

    1. Alexander, D.H. , Novembre, J. and Lange, K. (2009) Fast model‐based estimation of ancestry in unrelated individuals. Genome Res. 19, 1655–1664. - PMC - PubMed
    1. Ballenghien, M. , Faivre, N. and Galtier, N. (2017) Patterns of cross‐contamination in a multispecies population genomic project: detection, quantification, impact, and solutions. BMC Biol. 15, 25. - PMC - PubMed
    1. Baurens, F.C. , Martin, G. , Hervouet, C. et al . (2019) Recombination and large structural variations shape interspecific edible bananas genomes. Mol. Biol. Evol. 36, 97–111. - PMC - PubMed
    1. Boonruangrod, R. , Desai, D. , Fluch, S. , Berenyi, M. and Burg, K. (2008) Identification of cytoplasmic ancestor gene‐pools of Musa acuminata Colla and Musa balbisiana Colla and their hybrids by chloroplast and mitochondrial haplotyping. Theor. Appl. Genet. 118, 43–55. - PubMed
    1. Bredeson, J.V. , Lyons, J.B. , Prochnik, S.E. et al . (2016) Sequencing wild and cultivated cassava and related species reveals extensive interspecific hybridization and genetic diversity. Nat. Biotechnol. 34, 562–570. - PubMed

Publication types

MeSH terms

Associated data