. 2020 Mar:192:107926.
doi: 10.1016/j.exer.2020.107926. Epub 2020 Jan 10.

In-vivo longitudinal changes in thickness of the postnatal canine retina

Affiliations

In-vivo longitudinal changes in thickness of the postnatal canine retina

Valérie L Dufour et al. Exp Eye Res. 2020 Mar.

Abstract

The objectives of the present work were to assess by spectral domain optical coherence tomography (OCT) the changes in thickness of the outer nuclear layer (ONL), the ONL + photoreceptor inner segment (IS), and the retinal thickness, as a function of age in the normal canine retina. OCT retinal scans extending from the edge of the optic nerve head (ONH) along the superior and inferior meridians were captured in both eyes of 17 normal dogs at age ranging from 4 to 119 weeks. The different parameters along the superior and the inferior regions were determined following manual segmentation using the Heidelberg Eye Explorer software. Changes in thickness with age were modeled using one-phase exponential decay models. In vivo OCT imaging results showed no interocular statistically significant differences in ONL, ONL + IS, and retinal thickness at any age. All three parameters were however found to be statistically significantly thicker in the superior vs inferior retina. A rapid thinning of the three layers occurs in both the superior and inferior retina between 4 and 12 weeks of age, before reaching a plateau at around 20 weeks of age. In conclusion, the ONL, ONL + IS, and retinal thickness of the normal canine retina decrease significantly during the first three postnatal months, and is likely attributed to an overall increase in the eye volume and tangential dispersion of the photoreceptor since early photoreceptor developmental cell death is very limited at that age. Establishment of the natural history of ONL, ONL + IS, and retinal thinning will allow a more accurate assessment of the progression of a retinal degenerative condition as well as facilitate the detection of positive rescue effect of novel retinal therapies evaluated in this large animal model.

Keywords: Canine retina; Growth and development; ONL + IS; Optical coherence tomography; Outer nuclear layer; Photoreceptors; Retinal thickness.


Conflict of interest statement

Declaration of competing interest All authors have no conflicts of interest to disclose relating to this work.

Figures

Figure 1.
Figure 1.. Illustration of scans orientation and retinal layer segmentation
(A) cSLO en face images showing in the central (extending up to 30° from the ONH) superior/tapetal and the inferior/non-tapetal retina the location (white arrows) of a 30° cross-sectional OCT B-scan. (B) Retinal thickness was measured from the ILM to the outer limit of the EZ; the ONL + IS from the OPL-ONL transition zone to the outer limit of the EZ; and of the ONL only from the OPL-ONL transition zone to the ELM.
Figure 2.
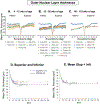
Figure 2.. Spider graphs along the central superior and inferior meridians measured by manual segmentation from cross-sectional OCT B-scans and one-phase exponential decay model fitting of the ONL thickness.
ONL thickness from 4 to 12 weeks of age (A), 13 to 36 weeks of age (B) and 40 to 119 weeks of age (C). For comparison, the ONL thickness at the 4 and 119 week time-points are represented on each of the three spider graphs. (D) Superior (dashed blue line) and inferior (black line) retinal ONL thickness with an exponential decay rate (SE) of −0.21 (0.02) Y of 57.1 μm and −0.16 (0.01) Y of 46.8 μm respectively, and (E) mean (superior + inferior) central ONL thickness with an exponential decay rate (SE) of −0.18 (0.01) and Y of 52.2 μm.
Figure 3.
Figure 3.. Spider graphs along the central superior and inferior meridians measured by manual segmentation from cross-sectional OCT B-scans and one-phase exponential decay model fitting of the ONL + inner segment thickness.
ONL + IS thickness from 4 to 12 weeks of age (A), 13 to 36 weeks of age (B) and 40 to 119 weeks of age (C). For comparison, the ONL + IS thickness at the 4 and 119 week time-points are represented on each of the three spider graphs. (D) Superior (dashed blue line) and inferior (black line) retinal ONL thickness with an exponential decay rate (SE) of −0.20 (0.02) Y of 81.3 μm and −0.18 (0.01) Y of 70.6 μm respectively, and (E) mean (superior + inferior) central ONL + IS thickness with an exponential decay rate (SE) of −0.20 (0.01) and Y of 76.2 μm.
Figure 4.
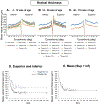
Figure 4.. Spider graphs along the central superior and inferior meridians measured by manual segmentation from cross-sectional OCT B-scans and one-phase exponential decay model fitting of the retinal thickness.
Retinal thickness from 4 to 12 weeks of age (A), 13 to 36 weeks of age (B) and 40 to 119 weeks of age (C). For comparison, the retinal thickness at the 4 and 119 week time-points are represented on each of the three spider graphs. (D) Superior (dashed blue line) and inferior (black line) retinal ONL thickness with an exponential decay rate (SE) of −0.12 (0.01) Y of 193.6 μm and −0.18 (0.01) Y of 146.9 μm respectively, and (E) mean (superior + inferior) central retinal thickness with an exponential decay rate (SE) of −0.14 (0.01) and Y of 170.6 μm
Figure 5.
Figure 5.. Adjustment of ONL rescue post therapy delivered to the young canine retina considering the natural course of ONL thinning.
Schematic Illustration of the natural course of ONL thinning in WT retinas (blue curve), in mutant retinas undergoing a rapid onset of retinal degeneration (red curve), and in mutant retinas post therapy (green curve). The black two-sided arrows represent the differences in ONL thickness of mutant retinas post therapy with (thick arrow) and without (thin arrow) consideration of the physiological thinning of the ONL that occurs during the first 3-month of life.

References

    1. Acland GM, Aguirre GD, 1987. Retinal degenerations in the dog: IV. Early retinal degeneration (erd) in Norwegian elkhounds. Exp. Eye Res 44, 491–521. 10.1016/S0014-4835(87)80160-4 - DOI - PubMed
    1. Adhi M, Alwassia AA, Duker JS, 2013. Analysis of choroidal thickness in eyes treated with focal laser photocoagulation using SD-OCT. Can. J. Ophthalmol 48, 535–538. 10.1016/j.jcjo.2013.05.010 - DOI - PubMed
    1. Aguirre GD, Rubin LF, Bistner SI, 1972. Development of the Canine Eye. Am. J. Vet. Res 33, 2399–2414. - PubMed
    1. Ávila-García M, García-Sánchez G, Lira-Romero E, Moreno-Mendoza N, 2012. Characterization of progenitor cells during canine retinal development. Stem Cells Int. 2012. 10.1155/2012/675805 - DOI - PMC - PubMed
    1. Beltran WA, Cideciyan AV, Iwabe S, Swider M, Kosyk MS, McDaid K, Martynyuk I, Ying G-S, Shaffer J, Deng W-T, Boye SL, Lewin AS, Hauswirth WW, Jacobson SG, Aguirre GD, 2015. Successful arrest of photoreceptor and vision loss expands the therapeutic window of retinal gene therapy to later stages of disease. Proc. Natl. Acad. Sci 112, E5844–E5853. 10.1073/pnas.1509914112 - DOI - PMC - PubMed

Publication types