. 2020 Mar:136:104742.
doi: 10.1016/j.nbd.2020.104742. Epub 2020 Jan 11.

APOE alters glucose flux through central carbon pathways in astrocytes

Affiliations

APOE alters glucose flux through central carbon pathways in astrocytes

Holden C Williams et al. Neurobiol Dis. 2020 Mar.

Abstract

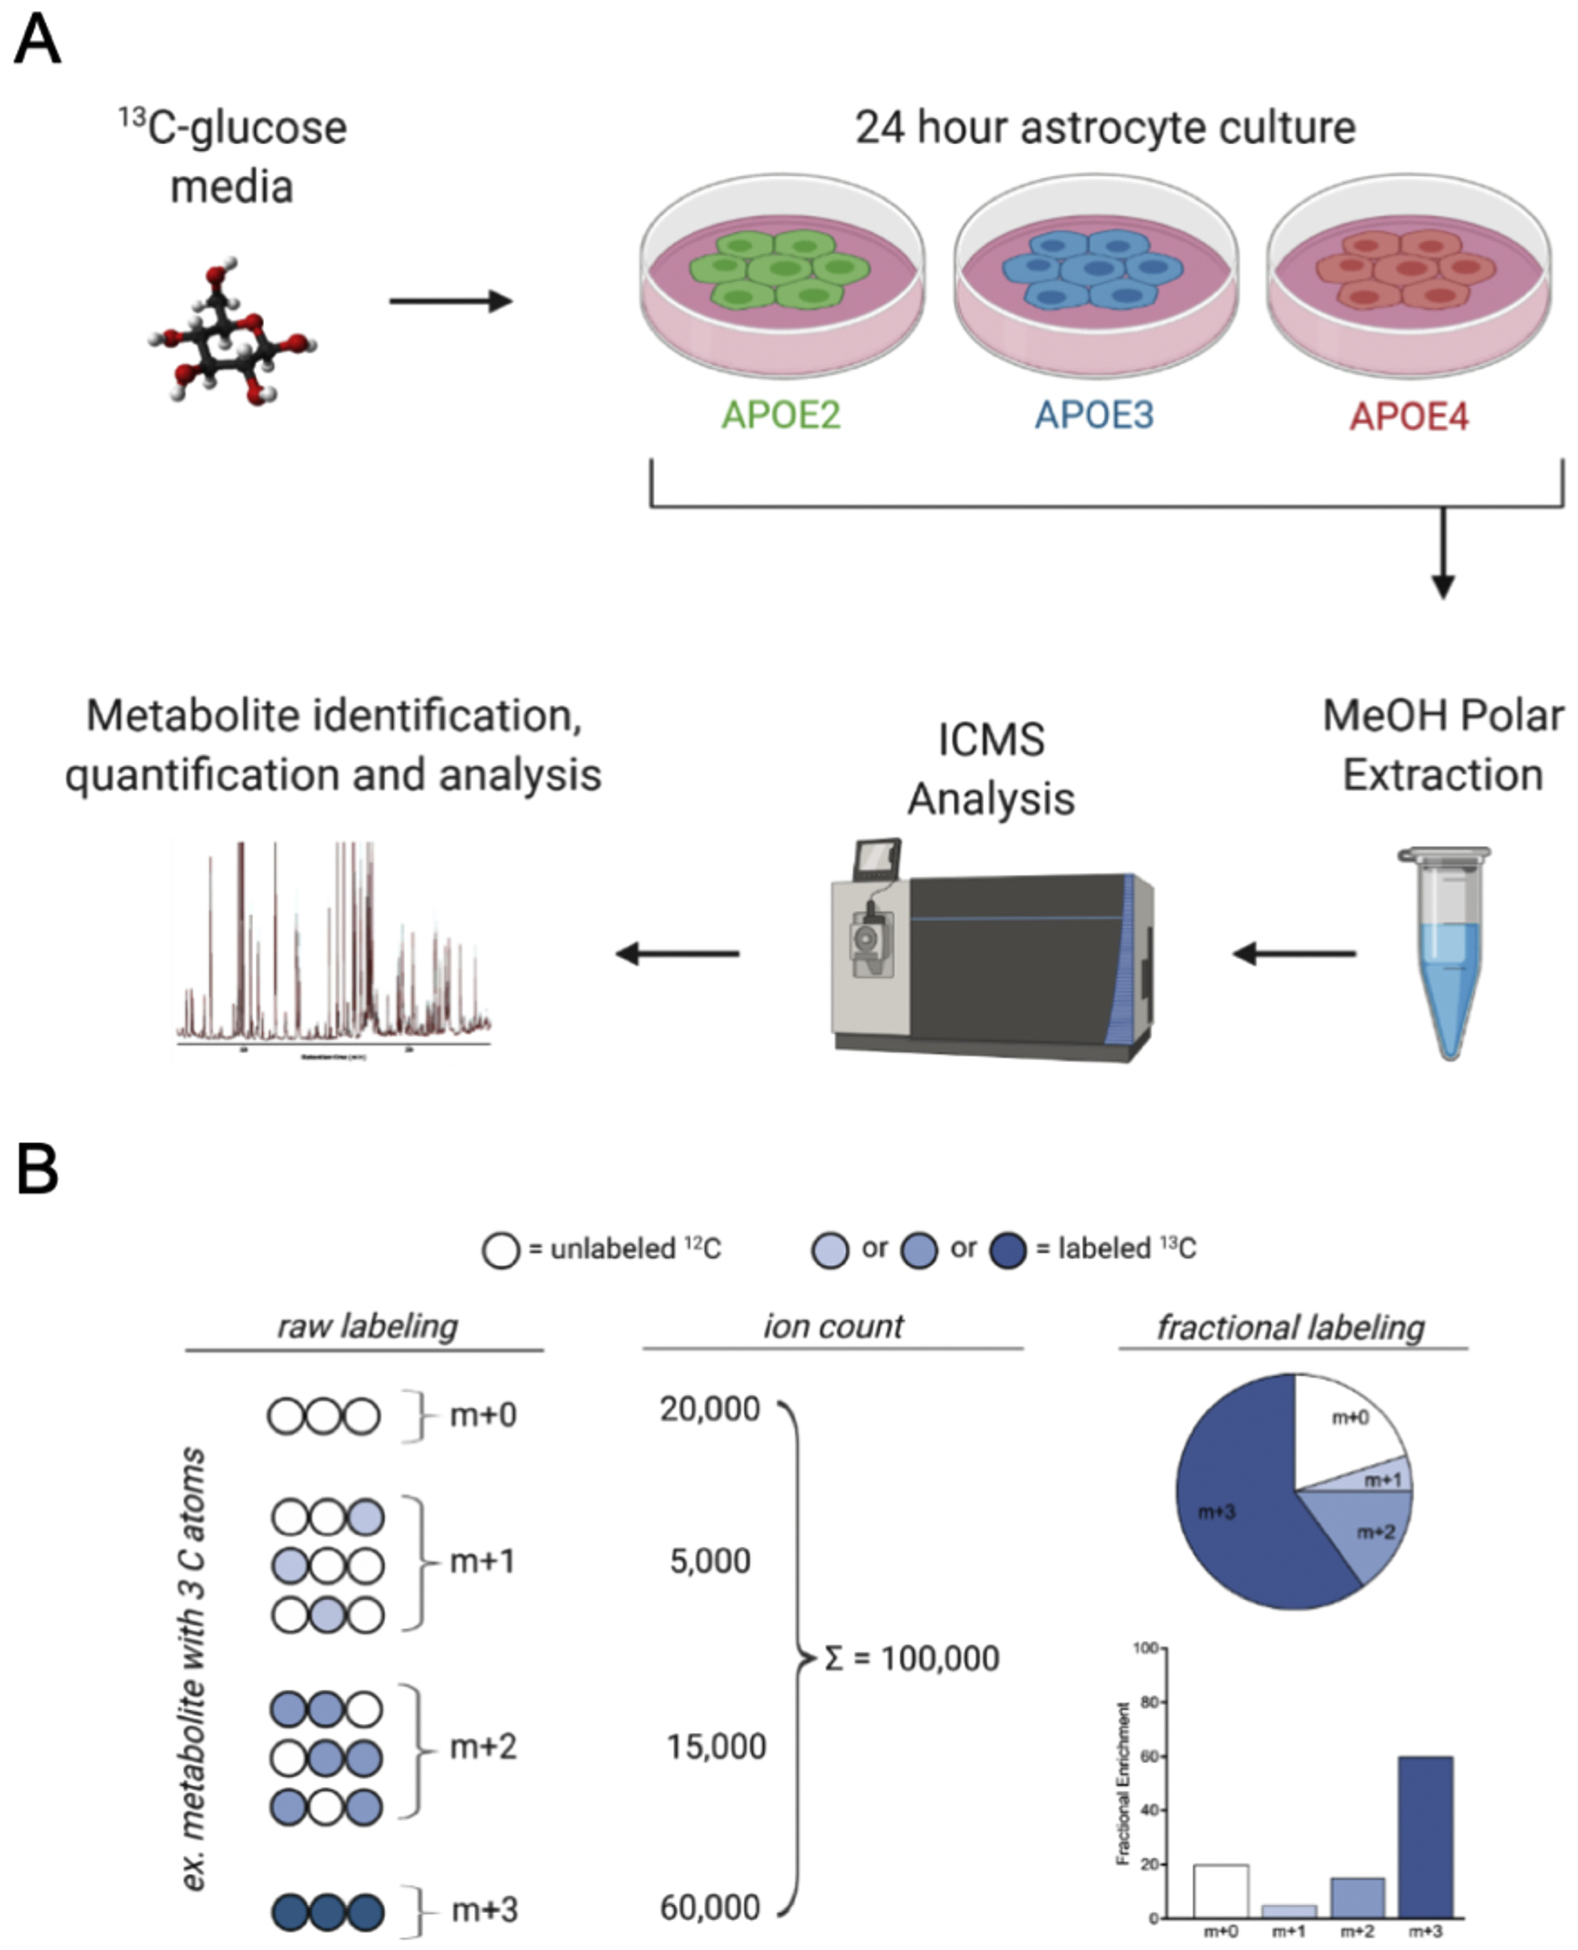
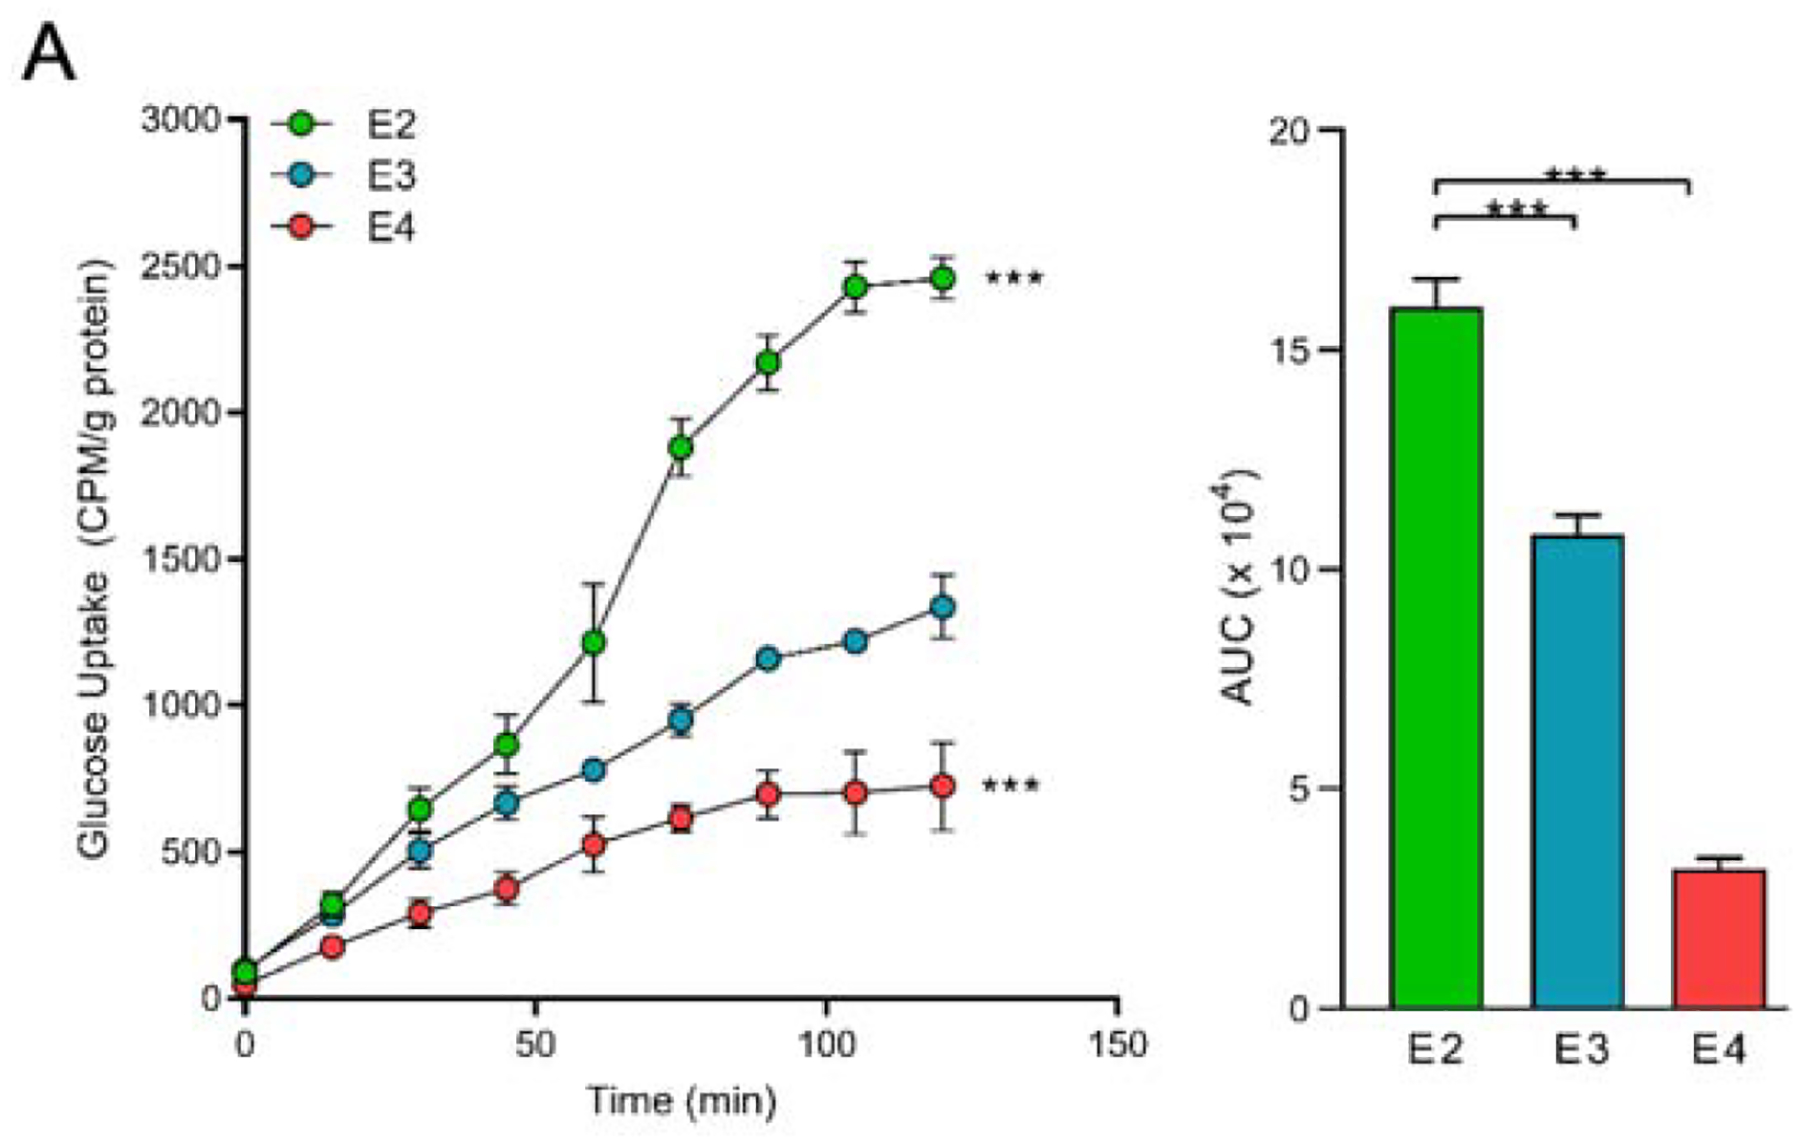
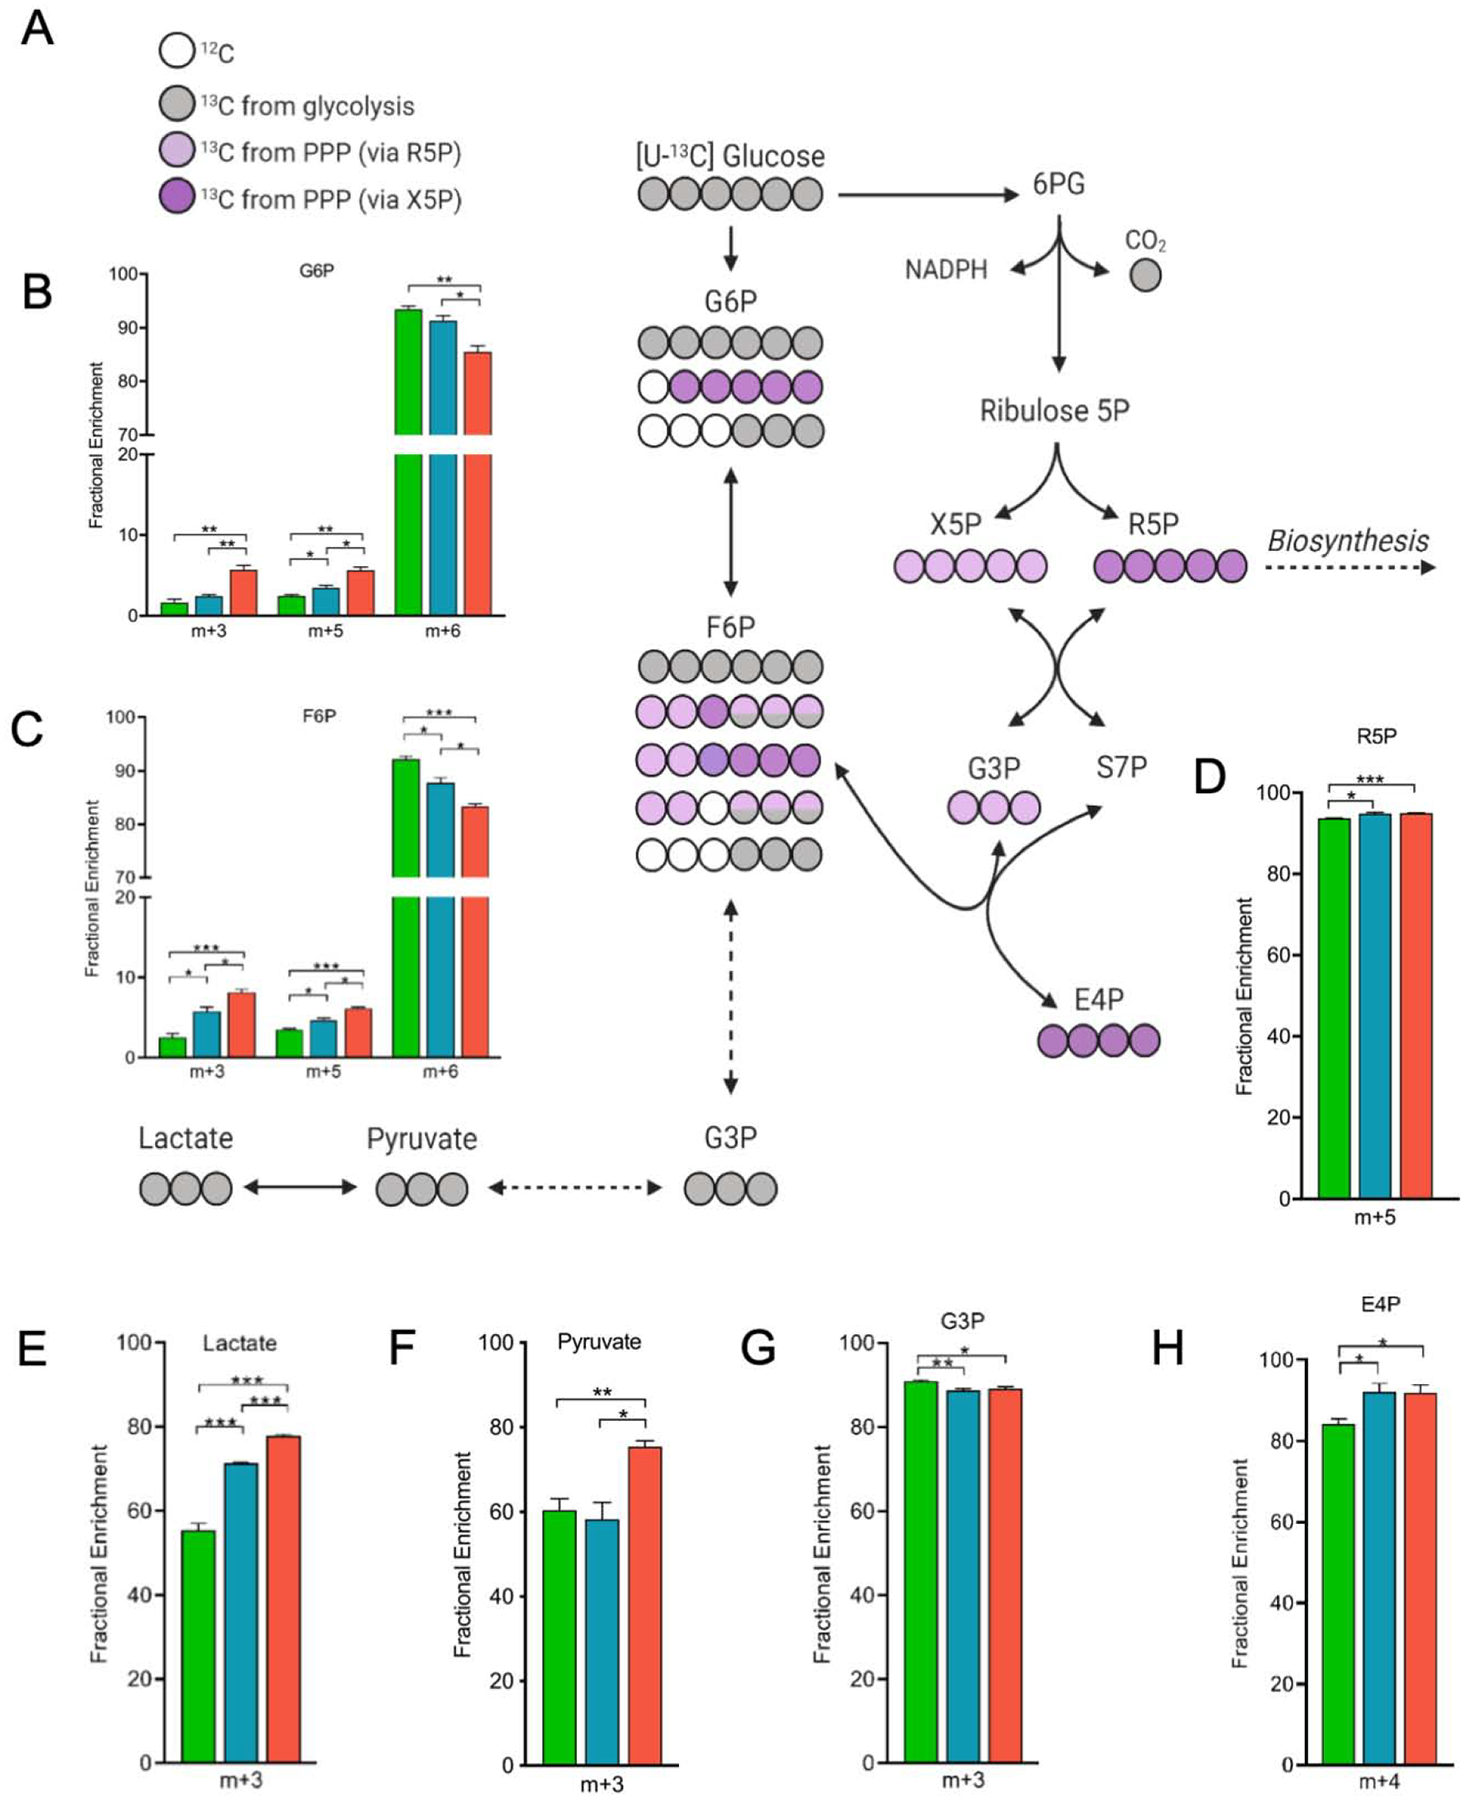
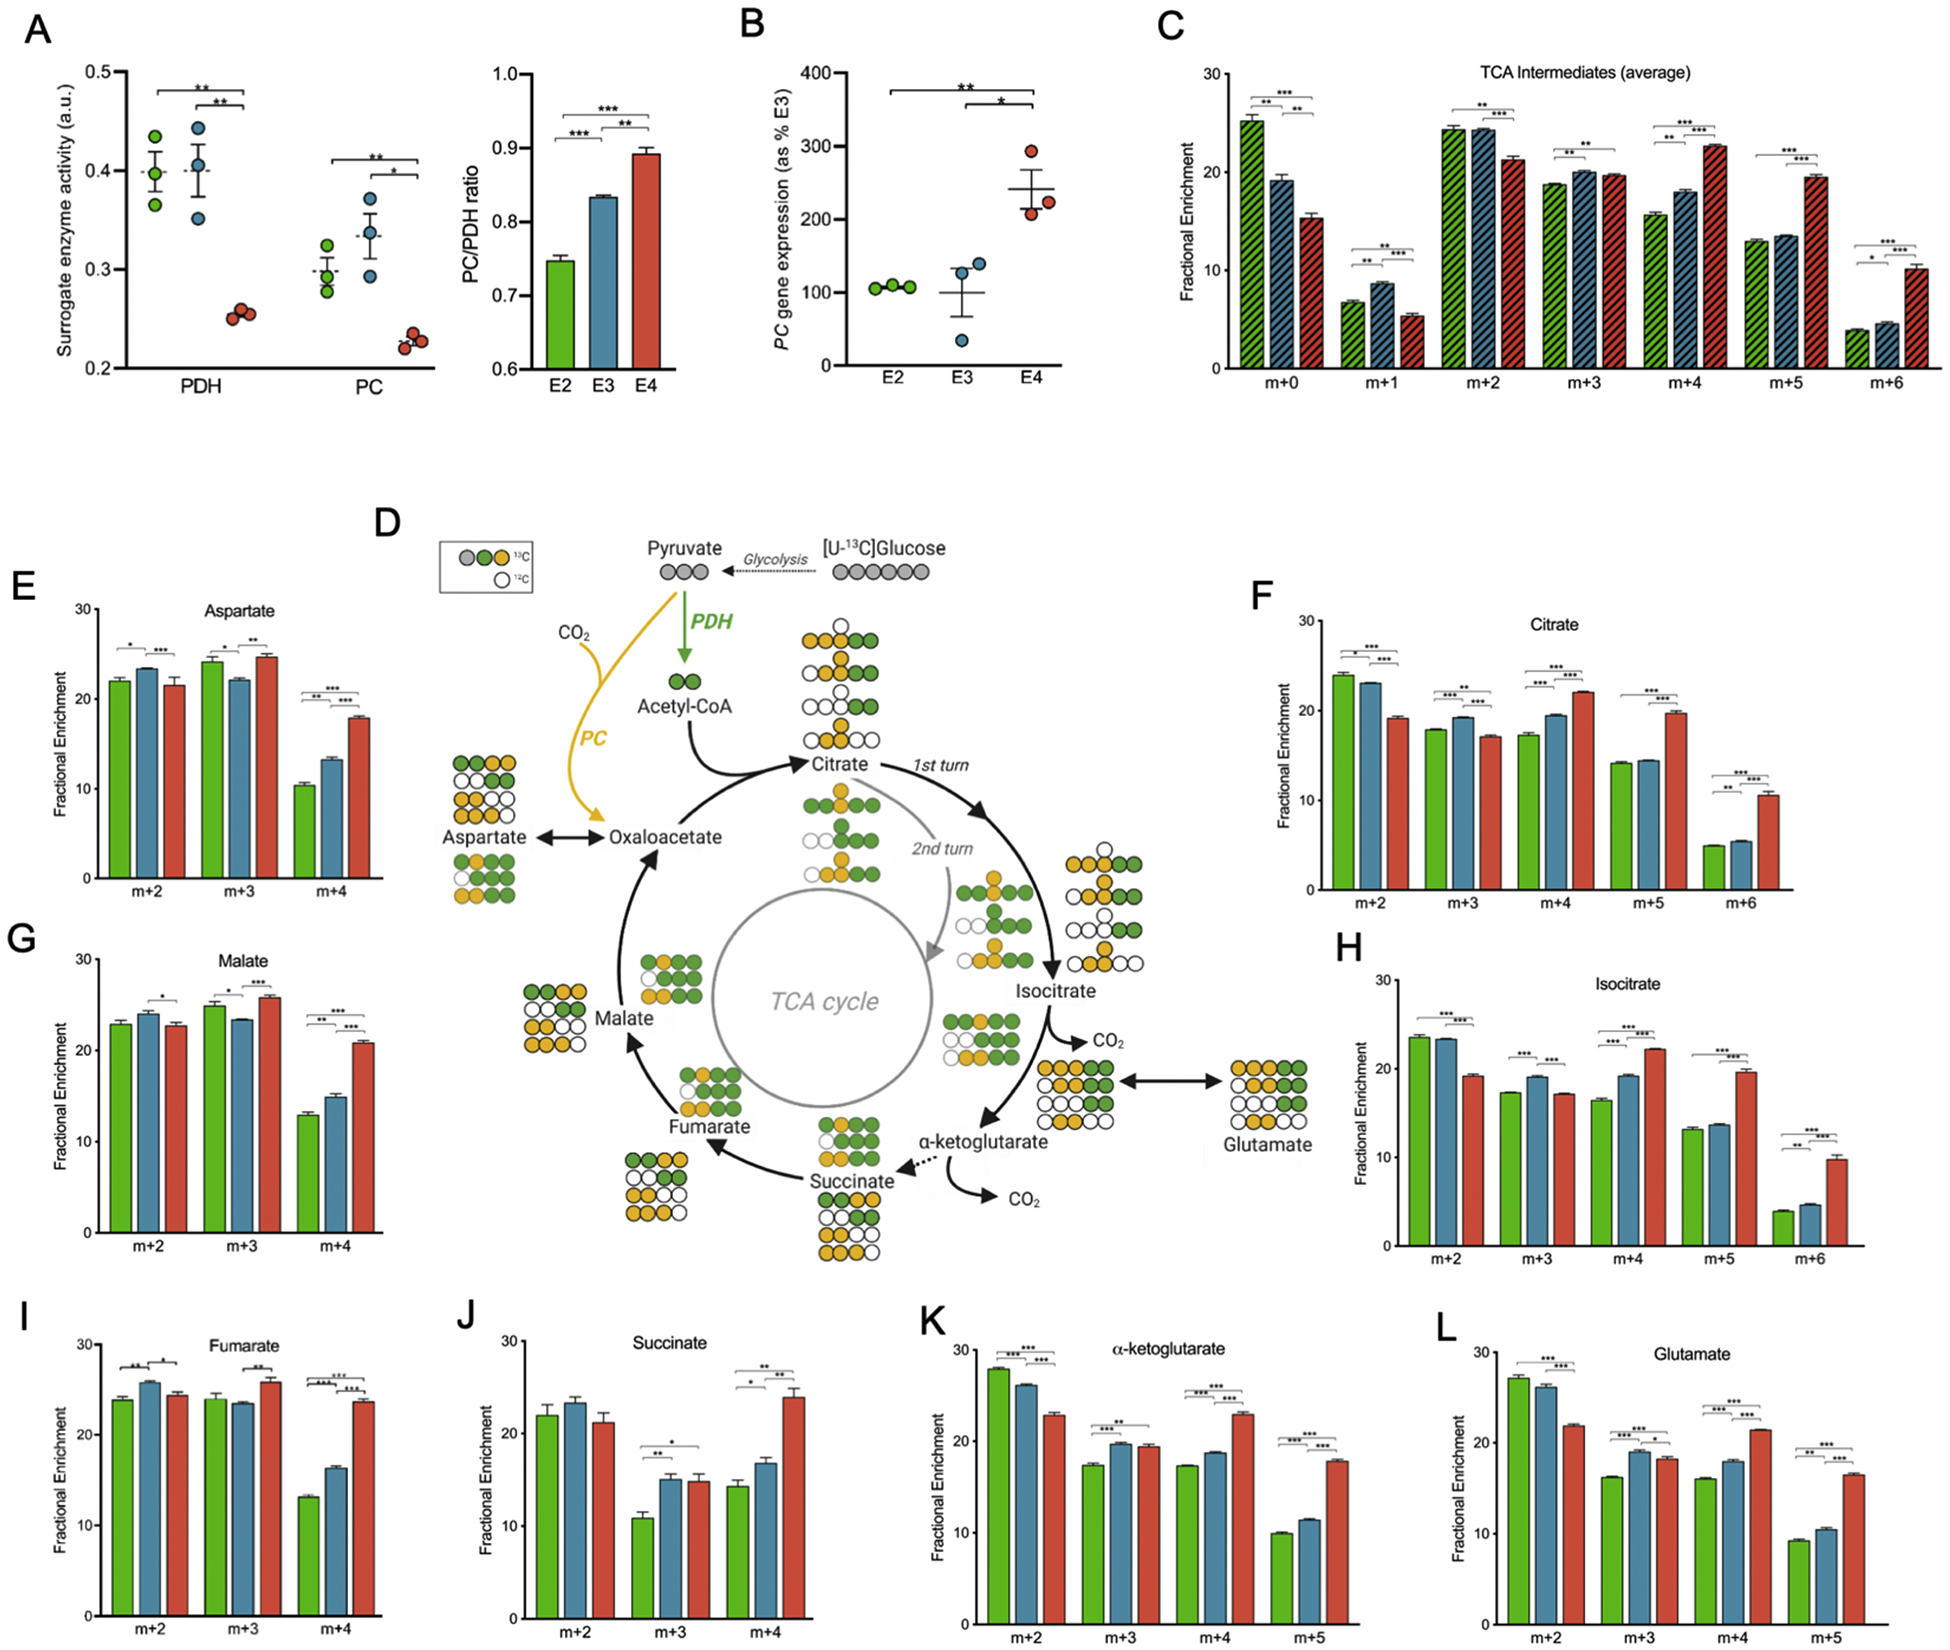
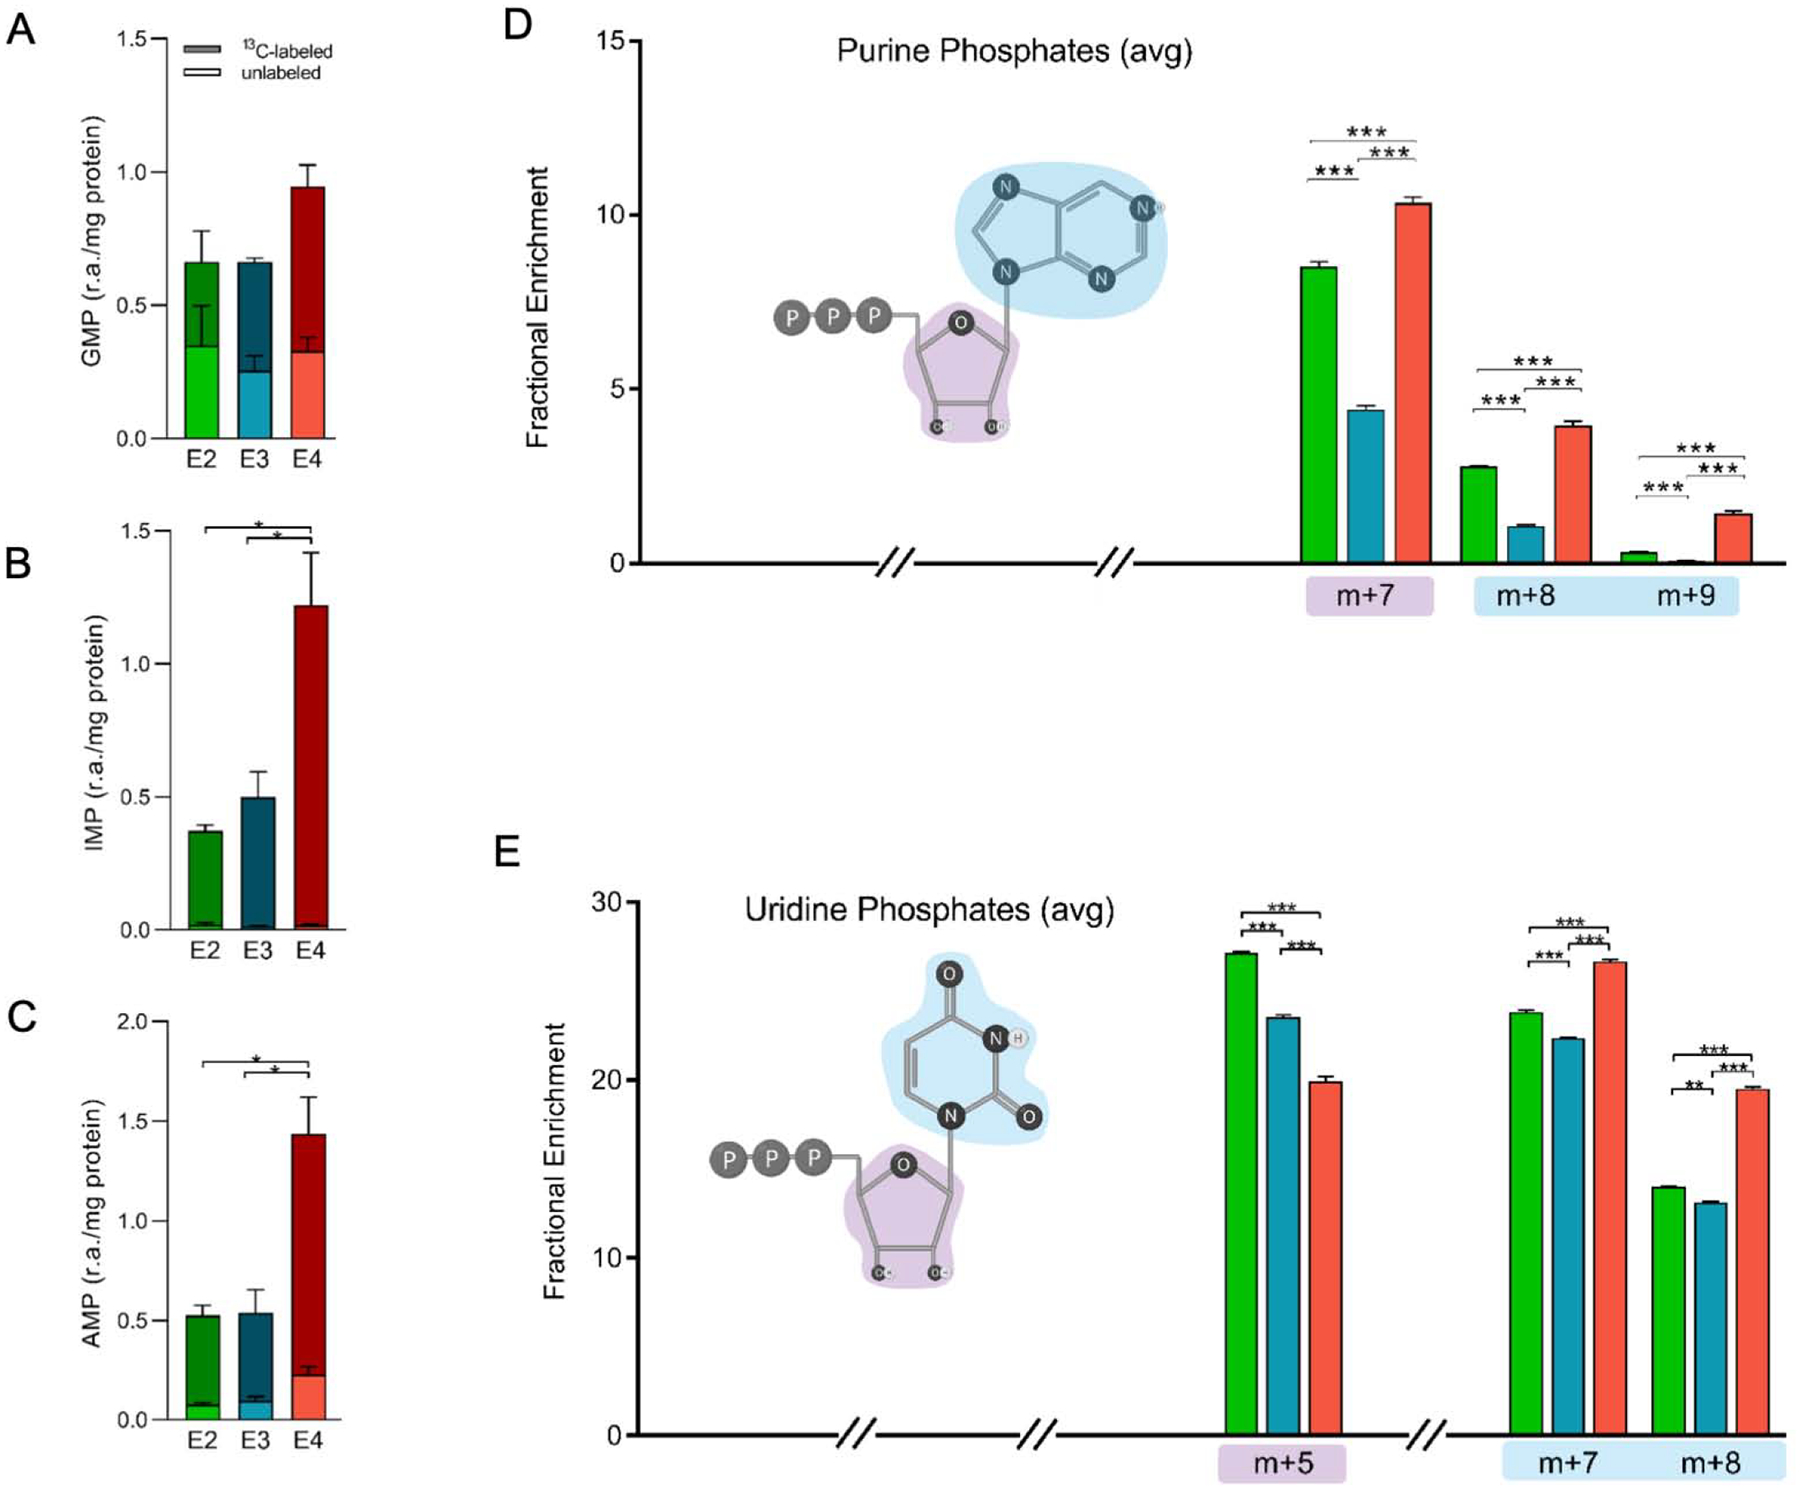
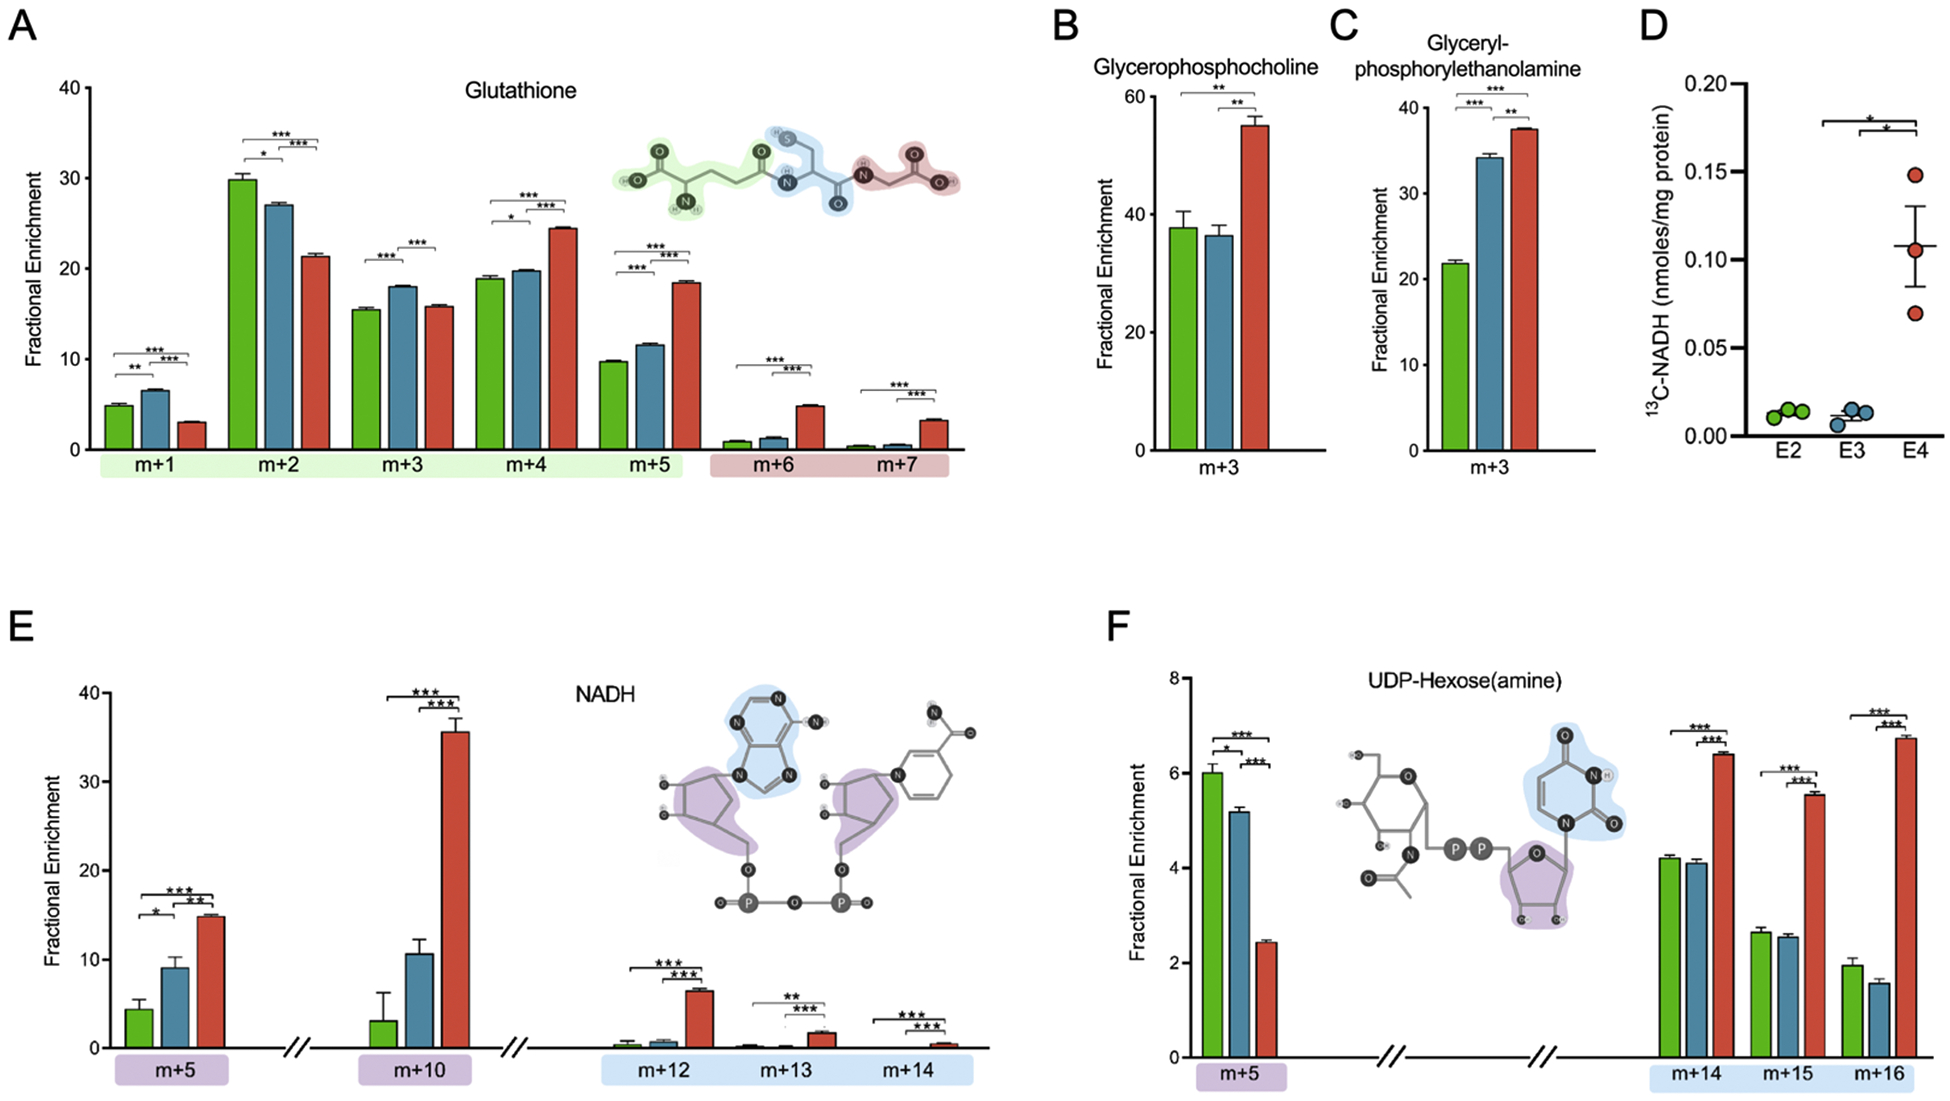
The Apolipoprotein E (APOE) gene is a major genetic risk factor associated with Alzheimer's disease (AD). APOE encodes for three main isoforms in humans (E2, E3, and E4). Homozygous E4 individuals have more than a 10-fold higher risk for developing late-onset AD, while E2 carriers are protected. A hallmark of AD is a reduction in cerebral glucose metabolism, alluding to a strong metabolic component in disease onset and progression. Interestingly, E4 individuals display a similar regional pattern of cerebral glucose hypometabolism decades prior to disease onset. Mapping this metabolic landscape may help elucidate the underlying biological mechanism of APOE-associated risk for AD. Efficient metabolic coupling of neurons and glia is necessary for proper neuronal function, and disruption in glial energy distribution has been proposed to contribute to neuronal cell death and AD pathology. One important function of astrocytes - canonically the primary source of apolipoprotein E in the brain - is to provide metabolic substrates (lactate, lipids, amino acids and neurotransmitters) to neurons. Here we investigate the effects of APOE on astrocyte glucose metabolism in vitro utilizing scintillation proximity assays, stable isotope tracer metabolomics, and gene expression analyses. Glucose uptake is impaired in E4 astrocytes relative to E2 or E3 with specific alterations in central carbon metabolism. Using stable isotope labeled glucose [U-13C] allowed analyses of astrocyte-specific deep metabolic networks affected by APOE, and provided insight to the effects downstream of glucose uptake. Enrichment of 13C in early steps of glycolysis was lowest in E4 astrocytes (highest in E2), while synthesis of lactate from glucose was highest in E4 astrocytes (lowest in E2). We observed an increase in glucose flux through the pentose phosphate pathway (PPP), with downstream increases in gluconeogenesis, lipid, and de novo nucleotide biosynthesis in E4 astrocytes. There was also a marked increase in 13C enrichment in the TCA cycle of E4 astrocytes - whose substrates were also incorporated into biosynthetic pathways at a higher rate. Pyruvate carboxylase (PC) and pyruvate dehydrogenase (PDH) are the two main enzymes controlling pyruvate entry to the TCA cycle. PC gene expression is increased in E4 astrocytes and the activity relative to PDH was also increased, compared to E2 or E3. Decreased enrichment in the TCA cycle of E2 and E3 astrocytes is suggestive of increased oxidation and non-glucose derived anaplerosis, which could be fueling mitochondrial ATP production. Conversely, E4 astrocytes appear to increase carbon flux into the TCA cycle to fuel cataplerosis. Together, these data demonstrate clear APOE isoform-specific effects on glucose utilization in astrocytes, including E4-associated increases in lactate synthesis, PPP flux, and de novo biosynthesis pathways.

Keywords: APOE; Alzheimers disease; Astrocytes; Glucose; Metabolism.


Conflict of interest statement

Declaration of Competing Interest None.

Figures

Figure 1.
Figure 1.. Experimental design and fractional labeling methodology.
A) Stable Isotope Resolved Metabolomics Experimental design. Immortalized astrocytes expressing human E2, E3 or E4 were cultured for 24 hours in glucose-free media supplemented with 10 mM [U-13C] glucose tracer. Polar metabolites were extracted from the cells and 13C distribution among >100 metabolites was determined via ICMS (please see Methods for details). B) Example description of fractional labeling. Fractional enrichment of a metabolite is the abundance of an individual isotopologue (number of 13C atoms present) divided by the sum of all isotopologues for that metabolite. The distribution of labeling can indicate flux through a particular pathway or highlight contributions from specific enzymes based on the labeling pattern observed. Figure adapted from Buescher et al., 2015
Figure 2.
Figure 2.. APOE effects astrocyte glucose uptake.
A) E2 astrocytes take up more glucose, while E4 astrocytes take up less glucose, relative to E3. Immortalized astrocytes expressing human APOE were treated with 3H-2-deoxyglucose (5.6uCi/mL) in vitro and uptake was measured by a scintillation proximity assay (SPA) over 120 minutes. Total area under the curve (AUC) was determined. Values represent mean +/− SEM (n=3). Data analyzed by two-way ANOVA of repeated measures (SPA) or t-test (AUC). *** p < 0.001.
Figure 3.
Figure 3.. APOE alters glucose flux through glycolysis and the pentose phosphate pathway.
A) Tracing of glucose carbon through glycolysis, pentose phosphate pathway (PPP), and gluconeogenesis in astrocytes expressing E2, E3 or E4 grown in glucose tracer supplemented media for 24 hours. Carbons are color coded based on the pathway and/or enzyme the carbon was provided from (Grey circles: 13C; light purple: 13C from xyulose-5-phospahte (X5P); dark purple: 13C from ribose-5-phosphate (R5P); white circle: non-labeled 12C.) B-H) Fractional enrichments in the isotopologues of glucose-6-phosphate (G6P), fructose-6-phosphate (F6P), R5P, lactate, pyruvate, glyceraldehyde-3-phosphate (G3P), and erythrose-4-phosphate (E4P). Not all possible labeled metabolites are shown. The x-axis denotes percentage of total isotopic distribution per isotopologue shown. Data analyzed by multiple t-tests. Values represent mean +/− SEM (n=3). * p < 0.05; **p < 0.01; *** p < 0.001.
Figure 4.
Figure 4.. Alterations in glucose utilization in the TCA cycle and associated enzymes with APOE genotype.
A) Decreased activity of TCA cycle entry enzymes pyruvate dehydrogenase (PDH) and pyruvate carboxylase (PC)Relative enzyme activity of PDH and PC; ratio of PC/PDH. (PC enzyme activity is estimated based on the ratio of m+3 citrate relative to m+3 pyruvate. PDH enzyme activity is estimated based on the ratio of m+2 citrate relative to m+3 pyruvate.) B) Increased PC/PDH ratio mRNA gene expression. Gene expression of PC mRNA as percentage of E3 C) Isotopic distribution pattern reveals greater incorporation of glucose-derived carbon into TCA cycle in E4, relative to E2 or E3. The average isotopic distribution of TCA cycle intermediates (shown individually in E-L). D) Glucose-derived carbon tracing through TCA cycle. Not all possible labeled metabolites are shown. Carbons are color coded based on the pathway and/or enzyme the carbon was provided from (Grey circles: 13C; yellow: 13C from PC; green circles: 13C from PDH; white circle: non-labeled 12C; black outlined circles: first round of TCA; grey outlined circles: second round of TCA). E-L) Fractional enrichments in the isotopologues of aspartate, citrate, malate, isocitrate, fumarate, succinate, alpha-ketoglutarate, and glutamate highlighting differences among apoE isoforms. The x-axis denotes isotopic distribution per isotopologue shown. Data analyzed by t-test (PDH and PC) and multiple t-tests (fractional enrichment). Values shown are mean +/− SEM (n=3). * p < 0.05; **p < 0.01; *** p < 0.001.
Figure 5.
Figure 5.. E4 astrocytes show increased de novo synthesis of nucleotides from of glucose -derived carbon.
A-C) Comparison of total labeled isotopologues (m+1 + m+2 + … m+n) and unlabeled (m+0) of GMP, IMP and AMP. The y-axis denotes relative abundance of each purine phosphate normalized to cell amount (protein). D-E) Fractional enrichment of D) purine phosphates (AMP, ADP, AMP, GMP, GDP, GTP) and E) uridine phosphates (UMP, UDP, UTP) highlighting structural components attributable to isotopic distribution. Purple and blue “clouds” denote contributions of various carbon positions to isotopologues shown (ex. purple, pentose ring). The x-axis denotes the percentage of total 13C distribution for each m+n fraction (select isotopologues shown). Data analyzed by multiple t-tests. Values shown are mean +/− SEM (n=3). * p < 0.05; **p < 0.01; *** p < 0.001.
Figure 6.
Figure 6.. Increased de novo biosynthesis of glutathione, NADH, phospholipids, and UDP-hexoses biosynthesis in E4 astrocytes.
A) Fractional enrichment of selected isotopologues of glutathione highlighting structural components attributable to isotopic distribution. Red, blue, or green outline denotes contributions of carbon positions to isotopologues shown. B) Total 13C-labeled NADH. The y-axis denotes total NADH containing at least one 13C atom (sum of m+1, m+2 … m+10). C-D) Fractional enrichment of (C) Glycerophosphocholine and (D) Glycerylphosphorylethanolamine E) Fractional enrichment of selected isotopologues of NADH highlighting structural components attributable to isotopic distribution. Blue and purple outlines denote contributions of carbon positions to isotopologues shown. F) Average fractional enrichment of selected isotopologues of UDP-hexoses (UDP-glucose, UDP-galactose, UDP-N-acetylglucose, and UDP-N-acetylgalactose highlighting structural components attributable to isotopic distribution. Blue and purple outlines denote contributions of carbon positions to isotopologues shown. X-axes denote percentage of total isotopic distribution per isotopologue shown. Data analyzed by multiple t-tests. Values shown are mean +/− SEM (n=3). * p < 0.05; *** p < 0.001.

References

    1. Alberini CM, et al., 2018. Astrocyte glycogen and lactate: New insights into learning and memory mechanisms. Glia. 66, 1244–1262. - PMC - PubMed
    1. Alves TC, et al., 2015. Integrated, Step-Wise, Mass-Isotopomeric Flux Analysis of the TCA Cycle. Cell Metab. 22, 936–47. - PMC - PubMed
    1. Ansoleaga B, et al., 2015. Deregulation of purine metabolism in Alzheimer’s disease. Neurobiol Aging. 36, 68–80. - PubMed
    1. Bak LK, et al., 2018. Astrocytic glycogen metabolism in the healthy and diseased brain. J Biol Chem. 293, 7108–7116. - PMC - PubMed
    1. Blass JP, 2002. Alzheimer’s disease and Alzheimer’s dementia: distinct but overlapping entities. Neurobiol Aging. 23, 1077–84. - PubMed

Publication types