. 2020 Nov;16(11):2004-2016.
doi: 10.1080/15548627.2020.1713640. Epub 2020 Jan 13.

Autophagy drives fibroblast senescence through MTORC2 regulation

Affiliations

Autophagy drives fibroblast senescence through MTORC2 regulation

Monique Bernard et al. Autophagy. 2020 Nov.

Abstract

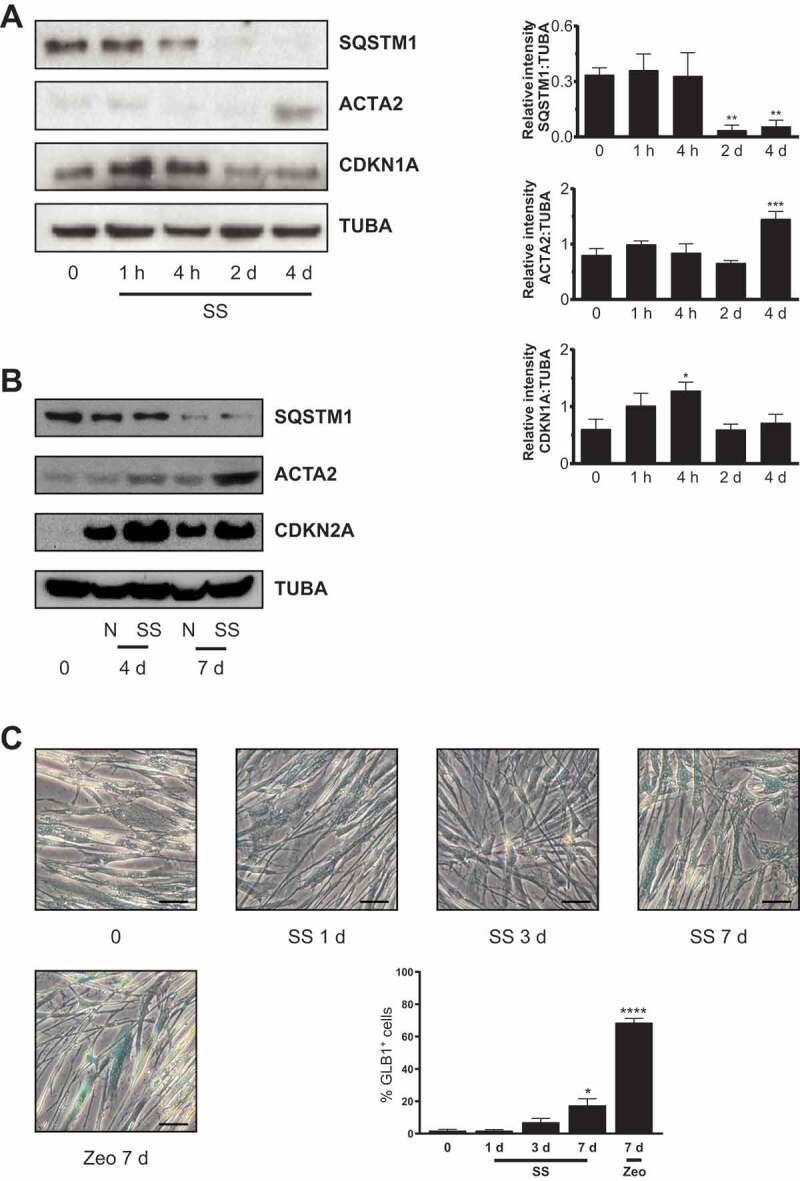
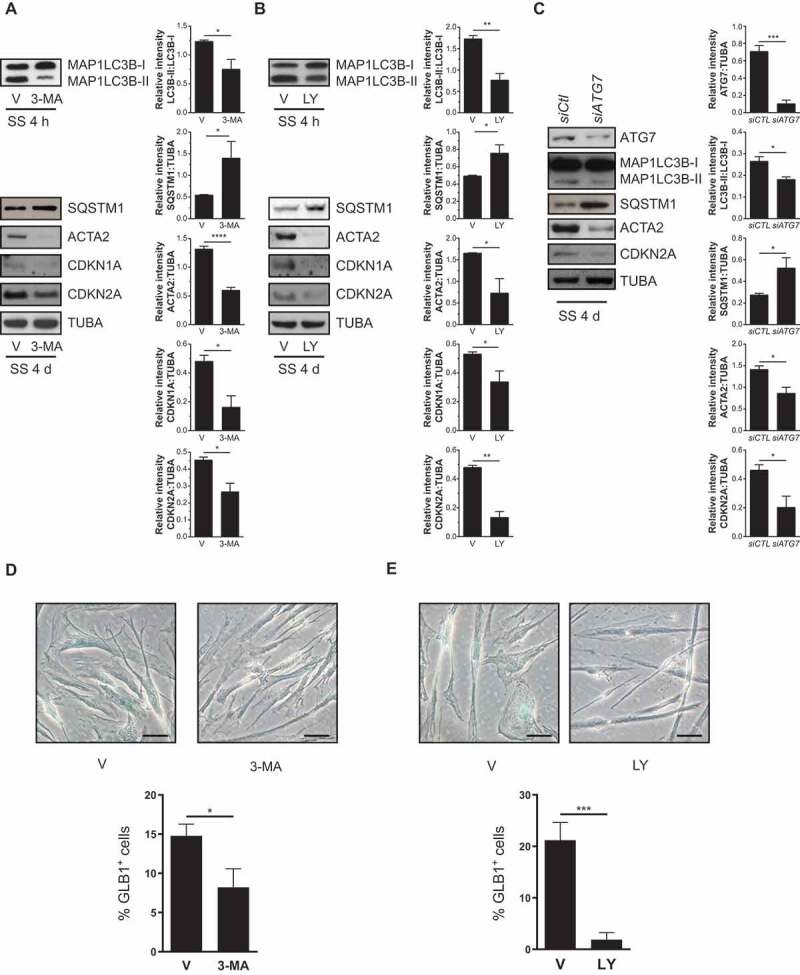
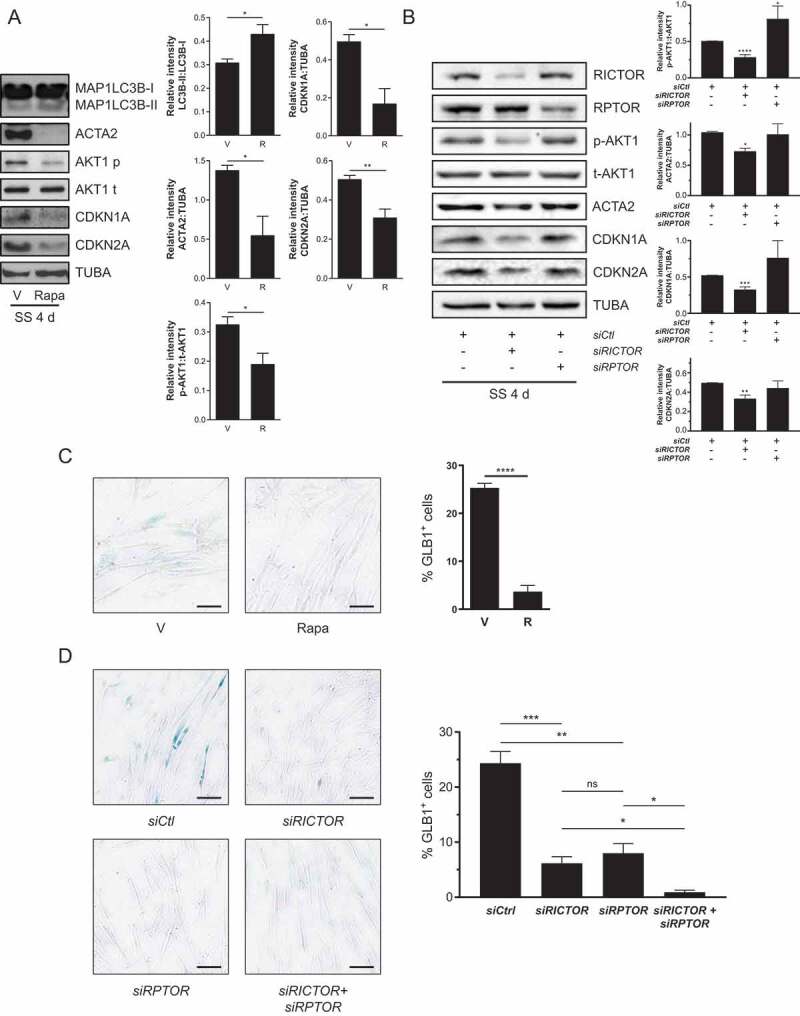
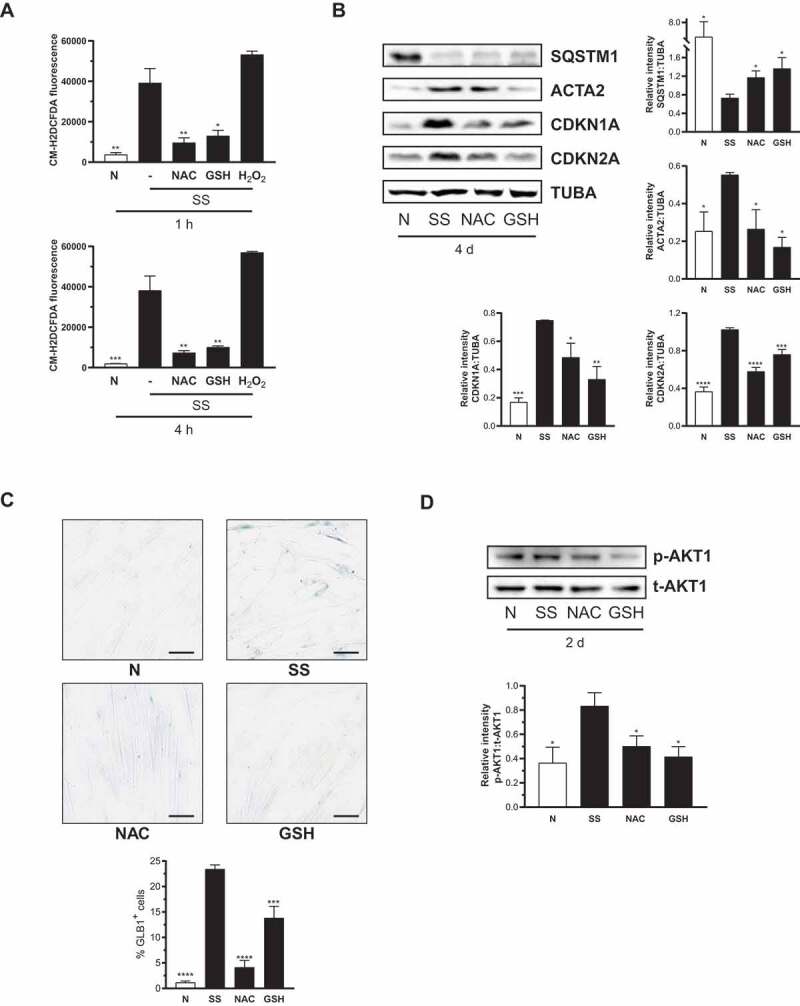
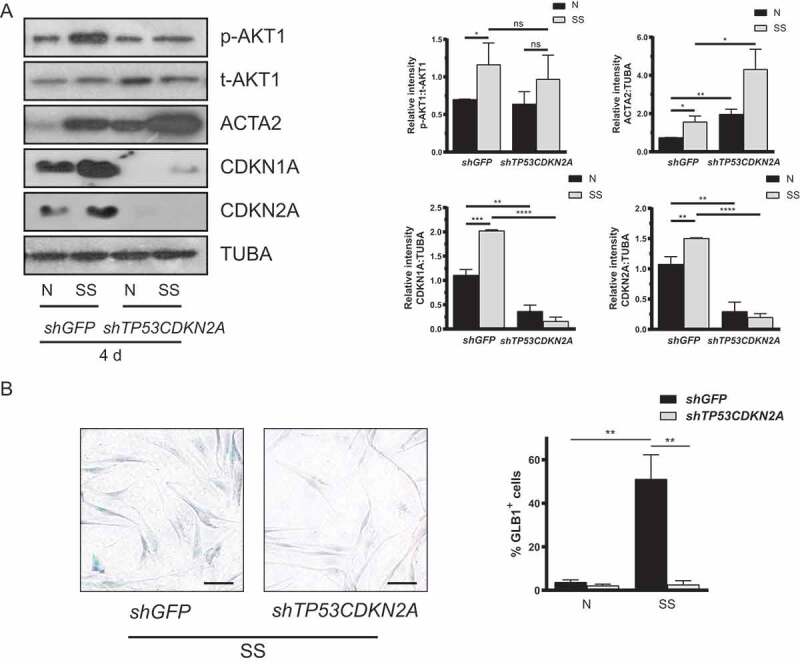
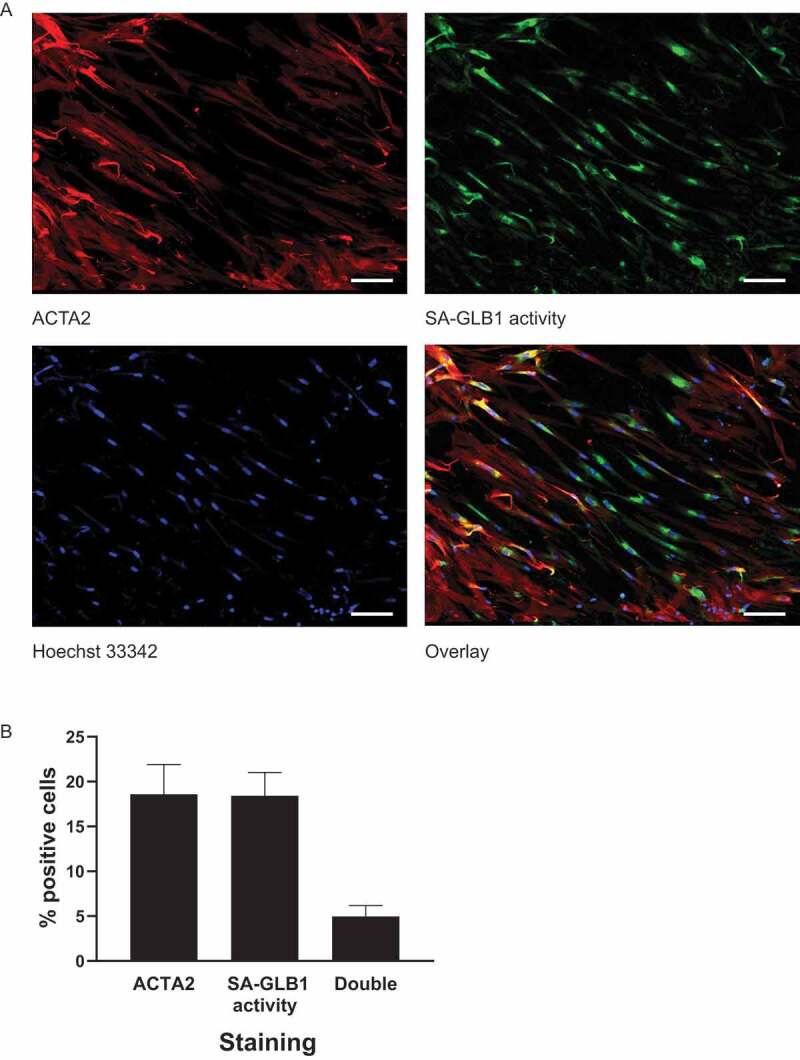
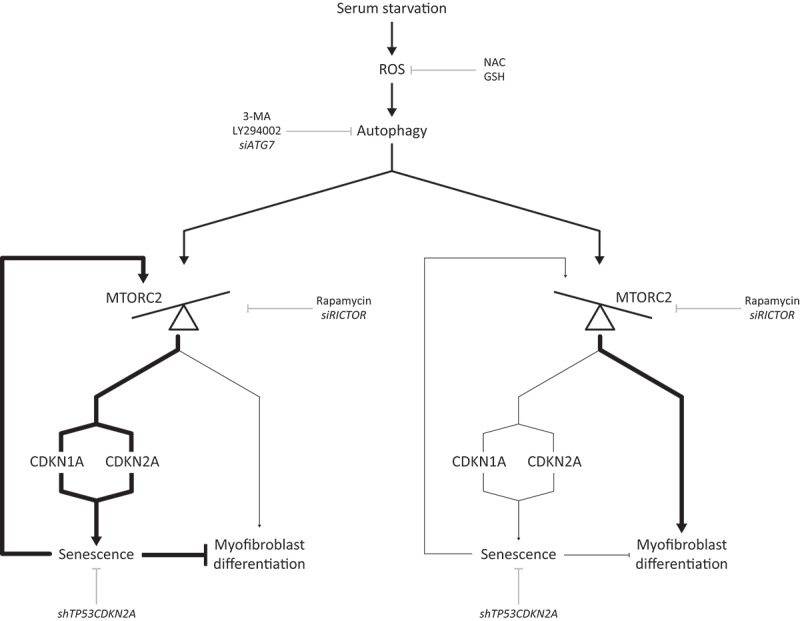
Sustained macroautophagy/autophagy favors the differentiation of fibroblasts into myofibroblasts. Cellular senescence, another means of responding to long-term cellular stress, has also been linked to myofibroblast differentiation and fibrosis. Here, we evaluate the relationship between senescence and myofibroblast differentiation in the context of sustained autophagy. We analyzed markers of cell cycle arrest/senescence in fibroblasts in vitro, where autophagy was triggered by serum starvation (SS). Autophagic fibroblasts expressed the senescence biomarkers CDKN1A/p21 and CDKN2A/p16 and exhibited increased senescence-associated GLB1/beta-galactosidase activity. Inhibition of autophagy in serum-starved fibroblasts with 3-methyladenine, LY294002, or ATG7 (autophagy related 7) silencing prevented the expression of senescence-associated markers. Similarly, suppressing MTORC2 activation using rapamycin or by silencing RICTOR also prevented senescence hallmarks. Immunofluorescence microscopy showed that senescence and myofibroblast differentiation were induced in different cells, suggesting mutually exclusive activation of senescence and myofibroblast differentiation. Reactive oxygen species (ROS) are known inducers of senescence and exposing fibroblasts to ROS scavengers decreased ROS production during SS, inhibited autophagy, and significantly reduced the expression of senescence and myofibroblast differentiation markers. ROS scavengers also curbed the AKT1 phosphorylation at Ser473, an MTORC2 target, establishing the importance of ROS in fueling MTORC2 activation. Inhibition of senescence by shRNA to TP53/p53 and shRNA CDKN2A/p16 increased myofibroblast differentiation, suggesting a negative feedback loop of senescence on autophagy-induced myofibroblast differentiation. Collectively, our results identify ROS as central inducers of MTORC2 activation during chronic autophagy, which in turn fuels senescence activation and myofibroblast differentiation in distinct cellular subpopulations. Abbreviations: 3-MA: 3-methyladenine; ACTA2: actin, alpha 2, smooth muscle, aorta; AKT1: AKT serine/threonine kinase 1; p-AKT1: AKT1 Ser473 phosphorylation; t-AKT1: total AKT serine/threonine kinase 1; ATG4A: autophagy related 4A cysteine peptidase; ATG7: autophagy gene 7; C12FDG: 5-dodecanoylaminofluorescein Di-β-D-Galactopyranoside; CDKN1A: cyclin dependent kinase inhibitor 1A; CDKN2A: cyclin dependent kinase inhibitor 2A; Ctl: control; DAPI: 4',6-diamidino-2-phenylindole, dilactate; ECM: extracellular matrix; GSH: L-glutathione reduced; H2O2: hydrogen peroxide; HLF: adult human lung fibroblasts; Ho: Hoechst 33342 (2'-[4-ethoxyphenyl]-5-[4-methyl-1-piperazinyl]-2.5'-bi-1H-benzimidazole); HSC: hepatic stellate cells; LY: LY294002; MAP1LC3B/LC3B: microtubule-associated protein 1 light chain 3 beta; MTORC1/2: mechanistic target of rapamycin kinase complex 1/2; N: normal growth medium; NAC: N-acetyl-L-cysteine; PBS: phosphate-buffered saline; PDGFA: platelet derived growth factor subunit A; PRKCA/PKCα: protein kinase C alpha; PtdIns3K: class III phosphatidylinositol 3-kinase; PTEN: phosphatase and tensin homolog; R: rapamycin; RICTOR: RPTOR independent companion of MTOR complex 2; ROS: reactive oxygen species; RPTOR: regulatory associated protein of MTOR complex 1; SA-GLB1/β-gal: senescence-associated galactosidase beta 1; SGK1: serum/glucocorticoid regulated kinase 1; shRNA: short hairpin RNA; siCtl: control siRNA; siRNA: small interfering RNA; SQSTM1: sequestosome 1; SS: serum-free (serum starvation) medium; TP53: tumor protein p53; TUBA: tubulin alpha; V: vehicle.

Keywords: Autophagy; MTORC2; myofibroblast; rapamycin; senescence.


Conflict of interest statement

No potential conflict of interest was reported by the authors.

Figures

Figure 1.
Figure 1.
Serum starvation (SS) induces senescence in fibroblasts. (A) Left panel: Representative immunoblots of SQSTM1, ACTA2, CDKN1A and TUBA protein levels in WI-38 fibroblasts exposed to SS. Right panel: Densitometric analysis of SQSTM1 (**P < 0.01, 4 h vs 2 d (D); **P < 0.01, 4 h vs 4 d, n = 5), ACTA2 (***P < 0.005, 2 d vs 4 d, n = 5) and CDKN1A (*P < 0.05, 0 vs 4 h, n = 4) relative to TUBA. Data are presented as mean ± SEM (B) Representative immunoblots of SQSTM1, ACTA2, CDKN2A and TUBA protein levels in WI-38 fibroblasts exposed to SS or grown under N at 4 and 7 d (n = 2). (C) Cytochemical evaluation of the senescence marker SA-GLB1/β-gal activity of cells grown in N or maintained SS for 1, 3 or 7 d. Zeocin (Zeo) in N (50 ug/ml) served as a positive control. Data are presented as % of SA-GLB1/β-gal-positive cells (mean ± SEM; *P < 0.05, 0 vs SS 7 d; ****P < 0.0001, 0 vs zeocin 7 d, n = 3) Scale bar: 50 µm
Figure 2.
Figure 2.
Autophagy induces senescence in serum-starved (SS) fibroblasts. (A) Upper left panel: Representative immunoblots of MAP1LC3B-I and -II protein levels in WI-38 fibroblasts starved in the presence of 3-MA (1 mM) or vehicle (V) for 4 h. Upper right panel: Densitometric analysis of MAP1LC3B-II relative to MAP1LC3B-I (*P < 0.05, n = 3). Lower left panel: Representative immunoblots of SQSTM1, ACTA2, CDKN1A, CDKN2A and TUBA protein levels in SS WI-38 fibroblasts and incubated with 3-MA (1 mM) or V for 4 d. Lower right panel: Densitometric analysis of SQSTM1 (*P < 0.05), ACTA2 (****P < 0.0001), CDKN1A (*P < 0.05) and CDKN2A (*P < 0.05) relative to TUBA (n = 3). (B) Upper left panel: Representative immunoblots of MAP1LC3B-I and -II protein levels in SS WI-38 fibroblasts in the presence of LY (5 µM) or V for 4 h. Upper right panel: Densitometric analysis of MAP1LC3B-II relative to MAP1LC3B-I (**P < 0.01, n = 3). Lower left panel: Representative immunoblots of SQSTM1, ACTA2, CDKN1A, CDKN2A and TUBA protein levels in SS WI-38 fibroblasts and incubated with LY (5 µM) or V for 4 d. Lower right panel: Densitometric analysis of SQSTM1 (*P < 0.05), ACTA2 (*P < 0.05), CDKN1A (*P < 0.05), CDKN2A (**P < 0.01) relative to TUBA (n = 3). (C) Left panel: Representative immunoblots of ATG7, MAP1LC3B-I and -II, SQSTM1, ACTA2, CDKN2A and TUBA protein levels in SS WI-38 fibroblasts for 4 d post-nucleofection with control siRNA (siCtl) or siATG7. Right panel: Densitometric analysis of ATG7 (***P < 0.001), MAP1LC3B-II:I ratios (*P < 0.05), SQSTM1 (*P < 0.05), ACTA2 (*P < 0.05) and CDKN2A (*P < 0.05) protein levels relative to TUBA in WI-38 fibroblasts silenced for ATG7 expression (n = 4). All densitometric analysis are presented as mean ± SEM (D) Cytochemical evaluation of the senescence marker SA-GLB1/β-gal activity in SS cells and incubated with 3-MA (1 mM) or V for 7 d. Data are presented as % of SA-GLB1/β-gal-positive cells (mean ± SEM; *P < 0.05, n = 3) Scale bar: 50 µm. (E) Cytochemical evaluation of the senescence marker SA-GLB1/β-gal activity in SS cells and incubated with LY (5 µM) or V for 7 d. Data are presented as % of SA-GLB1/β-gal-positive cells (mean ± SEM; ***P < 0.001, n = 3) Scale bar: 50 µm
Figure 3.
Figure 3.
Senescence induced by serum starvation (SS) depends on MTORC2 signaling. (A) Left panel: Representative immunoblots of western blots showing MAP1LC3B-I and – II, ACTA2, AKT1 Ser473 phosphorylation (p-AKT1), total AKT1 (t-AKT1), CDKN1A, CDKN2A and TUBA protein levels in WI-38 fibroblast exposed to SS for 4 d in the presence of R (10 nM) or V. Right panel: Densitometric analysis of MAP1LC3B-II relative to MAP1LC3B-I (*P < 0.05), ACTA2 relative to TUBA (*P < 0.05), p-AKT1 relative to t-AKT1 (*P < 0.05), CDKN1A (*P < 0.05) and CDKN2A (**P < 0.05) relative to TUBA (n = 3). (B) Left panel: Representative immunoblots of RICTOR, RPTOR, p-AKT1, t-AKT1, ACTA2, CDKN1A, CDKN2A and TUBA protein levels in SS WI-38 fibroblats for 4 d after transfection with siCtl, siRICTOR or siRPTOR. Right panel: Densitometric analysis of p-AKT1 relative to t-AKT1, ACTA2 relative to TUBA, CDKN1A and CDKN2A relative to TUBA (*P < 0.05, **P < 0.01, ***P < 0.001, and ****P < 0.0001 values compared to siCtl, n = 3). All densitometric analysis are expressed as mean ± SEM (C) Cytochemical evaluation of the senescence marker SA-GLB1/β-gal activity in SS cells and incubated with R (10 nM) or V for 7 d. Data are presented as % of SA-GLB1-positive cells (mean ± SEM; ****P < 0.0001, n = 3) Scale bar: 40 µm. (D) Cytochemical evaluation of the senescence marker SA-GLB1/β-gal activity in SS cells and transfected with siCtl, siRICTOR or siRPTOR for 7 d. Data are presented as % of SA-GLB1/β-gal-positive cells (mean ± SEM; *P < 0.05 between siRICTOR or siRPTOR and siRICTOR+siRPTOR and **P < 0.01, ***P < 0.001 values compared to siCtl, n = 3) Scale bar: 40 µm
Figure 4.
Figure 4.
ROS are required for autophagy-induced MTORC2 activation leading to senescence. (A) Upper panel: Starvation elicits ROS production in WI-38 fibroblasts. Quantification of ROS production in WI-38 fibroblasts stained with CM-H2DCFDA and cultured for 1 h in the N, SS, SS + 10 mM NAC, SS + 100 µM GSH or 500 µM hydrogen peroxide (H2O2; as positive control). Fluorescence is expressed as mean ± SEM (**P < 0.01 N vs SS, NAC vs SS and *P < 0.05 GSH vs SS, in triplicate). Lower panel: Stained cells were incubated for 4 h in the conditions described in A before fluorescence was measured (***P < 0.001 N vs SS, **P < 0.01 NAC vs SS and GSH vs SS, in triplicate). (B) Left panel: Representative immunoblots of SQSTM1, ACTA2, CDKN1A, CDKN2A and TUBA protein levels in WI-38 fibroblasts exposed to N, SS, SS + NAC 10 mM or SS + 100 µM GSH for 4 d. Right panels: Densitometric analysis of SQSTM1, ACTA2, CDKN1A and CDKN2A relative to TUBA. Data are presented as mean ± SEM (*P < 0.05, **P < 0.01, ***P < 0.001, and ****P < 0.0001 values compared to SS condition, n = 4). (C) Cytochemical evaluation of the senescence marker SA-GLB1/β-gal activity in SS cells or SS + NAC 10 mM or SS + 100 µM GSH for 7 d. Data are presented as % of SA-GLB1/β-gal-positive cells (mean ± SEM; ***p < 0.001 and ****P < 0.0001 compared to SS cells, n = 3) Scale bar: 40 µm. (D) Upper panel: Representative immunoblots of p-AKT1 and t-AKT1 in WI-38 fibroblasts exposed to N, SS, SS + 10 mM NAC or SS + 100 µM GSH for 2 d. Lower panel: Densitometric analysis of p-AKT1 relative to t-AKT1 compared to serum starved cells (*P < 0.05, n = 3). Data are presented as mean ± SEM
Figure 5.
Figure 5.
Inhibition of senescence leads to upregulated myofibroblast differentiation. (A) Left panel: Representative immunoblots of p-AKT1, t-AKT1, ACTA2, CDKN1A, CDKN2A and TUBA protein levels in WI-38 fibroblasts transfected with shGFP or shTP53CDKN2A plasmids exposed to N or SS for 4 d. Right panels: Densitometric analysis of p-AKT1 relative to t-AKT1, ACTA2, CDKN1A and CDKN2A relative to TUBA. Data are presented as mean ± SEM (*P < 0.05, **P < 0.01, ***P < 0.001, and ****P < 0.0001 values compared to shGFP-SS condition, n = 5). (B) Cytochemical evaluation of the senescence marker SA-GLB1/β-gal activity in transfected cells serum-starved for 7 d. Data are presented as % of SA-GLB1/β-gal-positive cells (mean ± SEM; **P < 0.001 value compared to shGFP-SS condition, n = 3) Scale bar: 50 µm
Figure 6.
Figure 6.
Cellular senescence and myofibroblast differentiation are not concomitantly activated in the same cells. (A) Representative photo of C12FGD and ACTA2 costaining in SS WI38 for 7 d, showing ACTA2 staining (upper left panel), SA-GLB1/β-gal activity (upper right panel), cell nuclei staining by Ho (lower left panel) and overlap of 3 images (lower right panel). Scale bar: 100 µm (B) Quantification of C12FGD and ACTA2 costaining. Numbers of nuclei stained by Ho were used as total numbers of cells. Data were shown as mean percentage of ACTA2, SA-GLB1/β-gal or double-positive cell in total cells (n = 4)
Figure 7.
Figure 7.
Proposed working model. Serum starvation induces ROS production which leads to increased autophagy. Sustained autophagy induces MTORC2 activity in fibroblasts. The activation of MTORC2 determines the fate of cells either toward senescence or myofibroblast differentiation. The factors downstream of MTORC2 that control the choice between either senescence or myofibroblast differentiation remain to be delineated. Senescence sustains MTORC2 activation while preventing myofibroblast differentiation

References

    1. Tomasek JJ, Gabbiani G, Hinz B, et al. Myofibroblasts and mechano-regulation of connective tissue remodelling. Nat Rev Mol Cell Biol. 2002;3:349–363. - PubMed
    1. Hinz B. Formation and function of the myofibroblast during tissue repair. J Invest Dermatol. 2007;127:526–537. - PubMed
    1. Hinz B, Gabbiani G.. Fibrosis: recent advances in myofibroblast biology and new therapeutic perspectives. F1000 Biol Rep. 2010;2:78. - PMC - PubMed
    1. Regulski MJ. Cellular senescence: what, why, and how. Wounds. 2017;29:168–174. - PubMed
    1. Beausejour CM, Krtolica A, Galimi F, et al. Reversal of human cellular senescence: roles of the p53 and p16 pathways. Embo J. 2003;22:4212–4222. - PMC - PubMed

Publication types

MeSH terms

Grants and funding