. 2020 Jan 13;21(1):16.
doi: 10.1186/s12859-019-3307-2.

Guidelines for cell-type heterogeneity quantification based on a comparative analysis of reference-free DNA methylation deconvolution software

Collaborators, Affiliations

Guidelines for cell-type heterogeneity quantification based on a comparative analysis of reference-free DNA methylation deconvolution software

Clémentine Decamps et al. BMC Bioinformatics. .

Abstract

Background: Cell-type heterogeneity of tumors is a key factor in tumor progression and response to chemotherapy. Tumor cell-type heterogeneity, defined as the proportion of the various cell-types in a tumor, can be inferred from DNA methylation of surgical specimens. However, confounding factors known to associate with methylation values, such as age and sex, complicate accurate inference of cell-type proportions. While reference-free algorithms have been developed to infer cell-type proportions from DNA methylation, a comparative evaluation of the performance of these methods is still lacking.

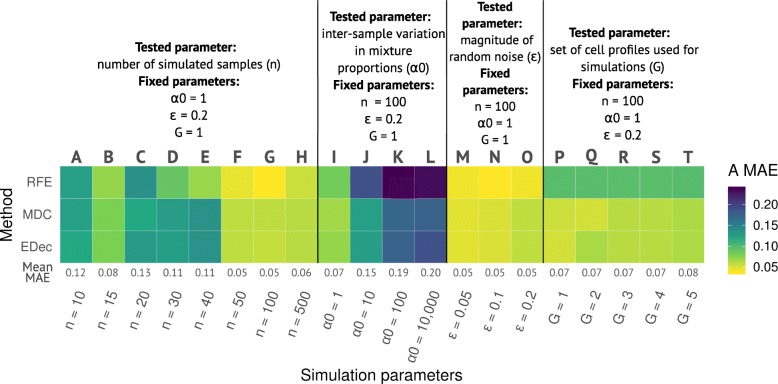
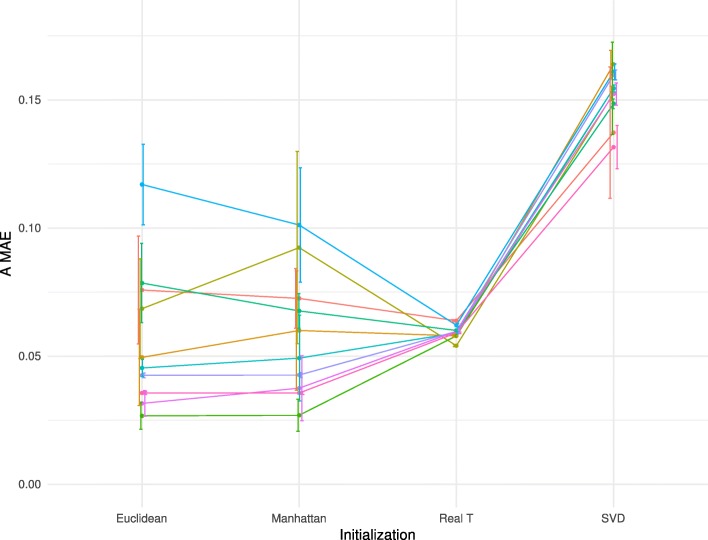
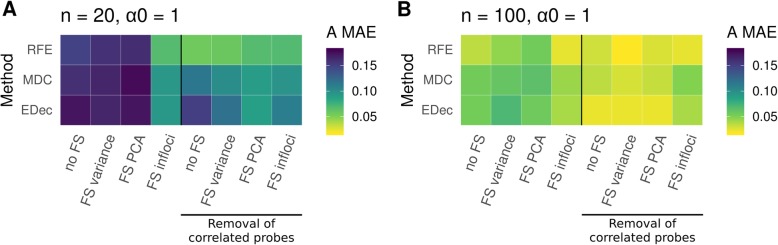
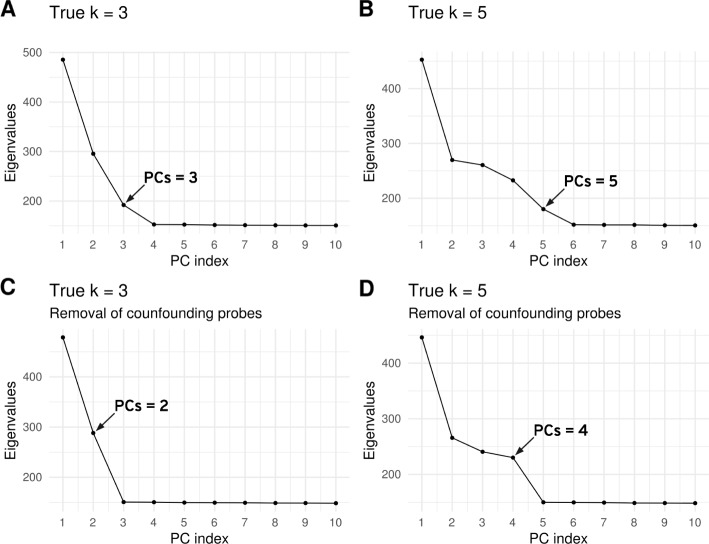
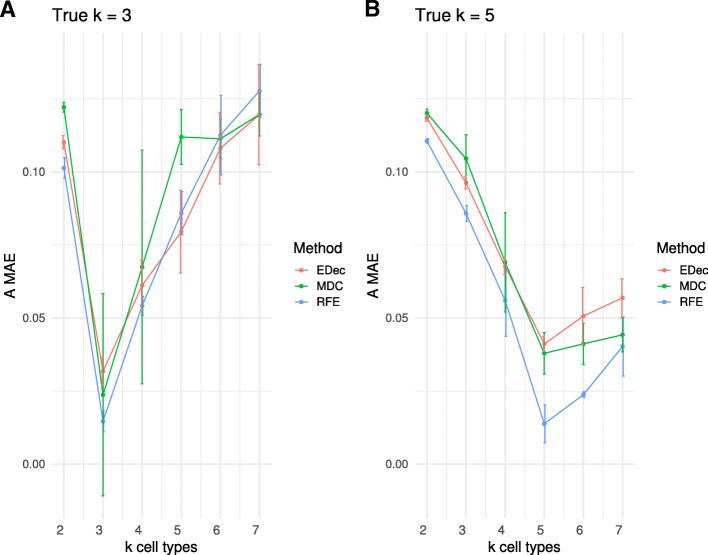
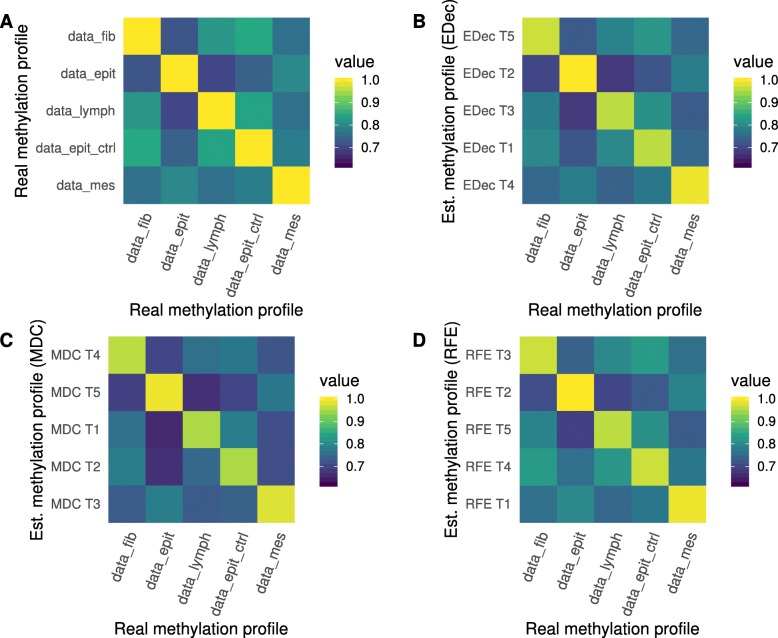
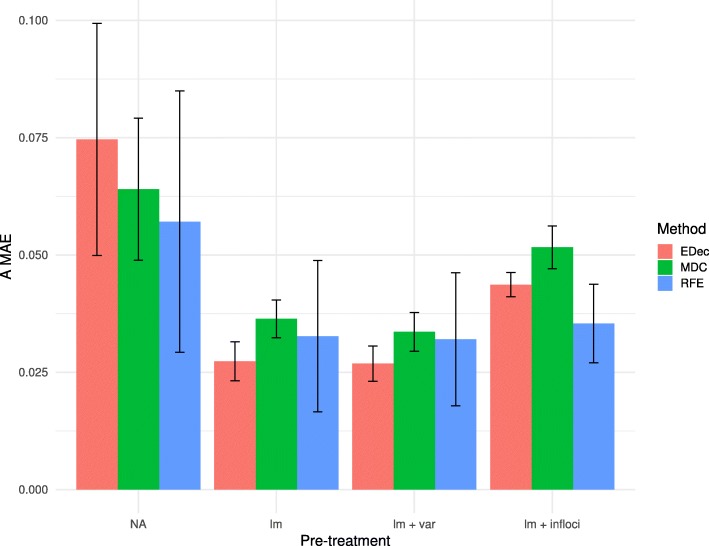
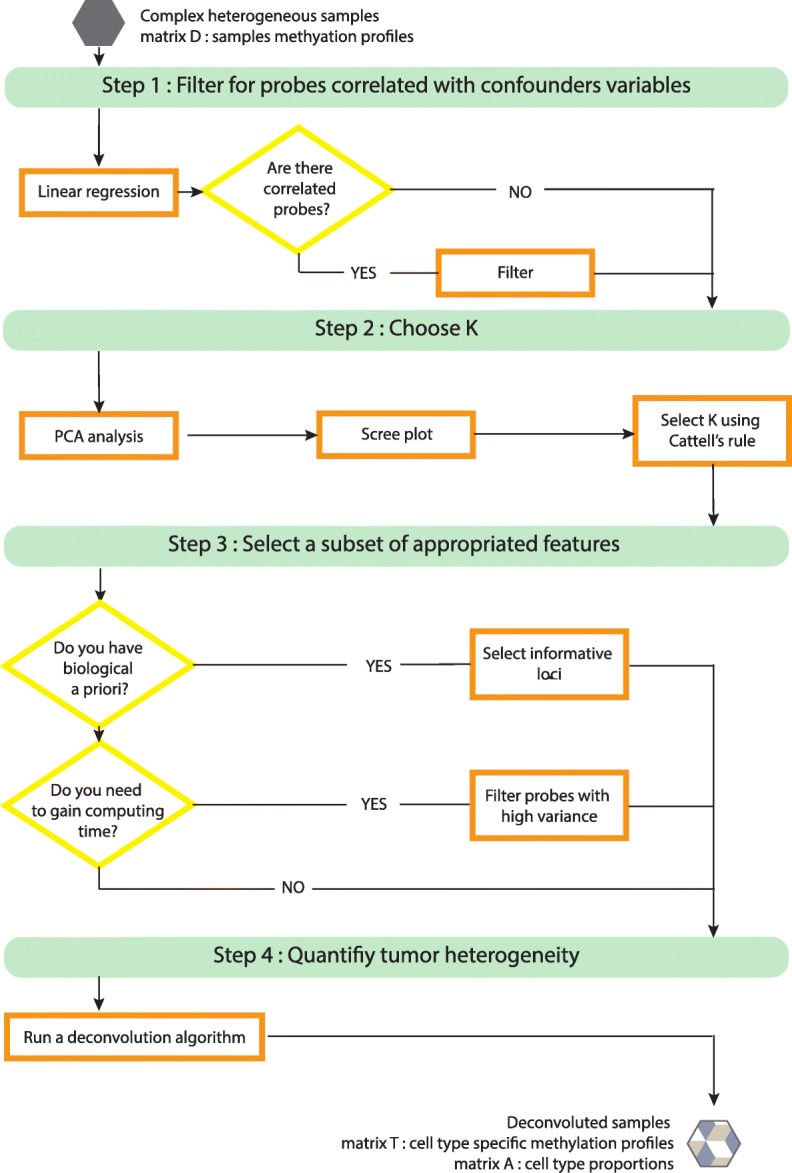
Results: Here we use simulations to evaluate several computational pipelines based on the software packages MeDeCom, EDec, and RefFreeEWAS. We identify that accounting for confounders, feature selection, and the choice of the number of estimated cell types are critical steps for inferring cell-type proportions. We find that removal of methylation probes which are correlated with confounder variables reduces the error of inference by 30-35%, and that selection of cell-type informative probes has similar effect. We show that Cattell's rule based on the scree plot is a powerful tool to determine the number of cell-types. Once the pre-processing steps are achieved, the three deconvolution methods provide comparable results. We observe that all the algorithms' performance improves when inter-sample variation of cell-type proportions is large or when the number of available samples is large. We find that under specific circumstances the methods are sensitive to the initialization method, suggesting that averaging different solutions or optimizing initialization is an avenue for future research.

Conclusion: Based on the lessons learned, to facilitate pipeline validation and catalyze further pipeline improvement by the community, we develop a benchmark pipeline for inference of cell-type proportions and implement it in the R package medepir.

Keywords: Cell heterogeneity; DNA methylation; Deconvolution; Epigenetics; Matrix factorization; R package/pipeline.


Conflict of interest statement

The authors declare that they have no competing interests.

Figures

Fig. 1
Fig. 1
Performance of the 3 deconvolution methods for different parameter settings. Heatmap of method performance (`A MAE`: Mean Absolute Error on estimated A, the matrix of cell proportions). RFE stands for RefFreeEWAS, MDC for MeDeCom and EDec for EDec stage 1. All algorithms were run on 10 D matrices corresponding to 10 different realizations of the random ε- controlled process on one D matrix computed from one simulated A matrix, each time, with the following parameters n (number of samples), α0 (inter-sample variation in mixture proportion), ε (magnitude of random noise applied on D) and G (the cell profiles used for simulations). Mean MAE corresponds to the average error of the three methods (computed for each parameter set). A random A matrix was used for testing the effect of G1 and G2, another random A matrix was used for testing the effect of ε magnitude. Testing the effect of n and α0 required independent simulation of A each time. As a consequence, the four simulations corresponding to the set of parameters n = 100, α0 = 1, ε = 0.2, G = 1 have different results, because these simulations are based on different randomly simulated A matrices (see Fig. 7 for a systematic analysis of performance variation according to the random simulations of A)
Fig. 2
Fig. 2
Impact of algorithm initialization of RefFreeEWAS method performance. `A MAE` is shown for 10 D matrices (mean value of 10 random noises applied on D) computed from 10 random A. Each color represents a different simulated A. Error bars represent standard deviation on 10 random noises. The following parameters were used to simulate D: K = 5, α0 = 1, ε = 0.2, G = 1 and n = 100). Euclidean corresponds to RefFreeEWAS::RefFreeCellMixInitialize function applied with the default parameter dist.method = “euclidean”. Manhattan corresponds to RefFreeEWAS::RefFreeCellMixInitialize function applied with the parameter dist.method = “manhattan”. Real T corresponds to RefFreeEWAS::RefFreeCellMix used with the parameter mu0 = real_T, with real_T the matrix composed of the 5 cell types used to simulate D. SVD corresponds to RefFreeEWAS::RefFreeCellMixInitializeBySVD function with default parameters
Fig. 3
Fig. 3
Impact of pre-processing on method performance. Heatmap of method performances (`A MAE`: Mean Absolute Error on estimated A, the matrix of cell proportions). RFE stands for RefFreeEWAS, MDC for MeDeCom and EDec for EDec stage 1. All algorithms are run on 10 D matrices: 10 different random noises ε were simulated on one matrix D computed from one simulated A matrix. In each heatmap, the left panel corresponds to algorithms run without accounting for confounders (no removal of confounding probes), the right panel corresponds to algorithms run accounting for confounders (removal of confounding probes by linear regression). In each case, different types of feature selection (FS) are tested: no FS = no feature selection, FS variance = selecting probes with high variance (var > 0.02), FS PCA = selecting probes highly correlated with the 4 first PCs (p-value < 0.1), FS infloci = selecting probes expected to biologically vary in methylation levels across constitutive cell types. a Simulations were performed with the following parameters K = 5, n = 20, α0 = 1, ε = 0.2 and G = 1. b Simulations were performed with the following parameters K = 5, n = 100, α0 = 1, ε = 0.2 and G = 1. The number of conserved probes is display Additional file 2: Table S1
Fig. 4
Fig. 4
Determining K with PCA scree plot. To choose K, we recommend to use Cattell’s rule, calculating the estimated K as K = PCs + 1. The number of PCs chosen by the Cattel’s rule is shown with an arrow. The D matrix was simulated with the following parameters: n = 100, α0 = 1, ε = 0.2, G = 1 and K = 3 (a and c) and n = 100, α0 = 1, ε = 0.2, G = 1 and K = 5 (b and d). a, b Scree plot of PCA applied on D matrix before removal of confounding probes (23,381 probes). c, d Scree plot of PCA applied on D matrix after removal of confounding probes (22,551 probes in C, 22,532 probes in d)
Fig. 5
Fig. 5
Impact of K selection on algorithm performance. `A MAE` is shown for D matrices (mean value of 10 random noises applied on D) computed from 1 random A. Each color represents a different method. Error bars represent standard deviation on 10 random noise realizations. RFE stands for RefFreeEWAS, MDC for MeDeCom and EDec for EDec stage 1, each method was applied with various imposed K parameters (from 2 to 7). a The following parameters were used to simulate D: K = 3, α0 = 1, ε = 0.2, G = 1 and n = 100. RFE and MDC methods were run after removal of confounding probes (between 22,517 and 22,624 remaining probes), EDec was run on informative loci, as recommended by the method’s authors (614 remaining probes). b The following parameters were used to simulate D: K = 5, α0 = 1, ε = 0.2, G = 1 and n = 100. RFE and MDC methods were run after removal of confounding probes (between 22,551 and 22,602 remaining probes), EDec was run on informative loci, as recommended by the method’s authors (614 remaining probes)
Fig. 6
Fig. 6
Correlation between estimated and real cell type-specific methylation profiles. Heatmap of the correlations between cell type-specific methylation profile used for the simulation and cell type-specific methylation profiles estimated (Est.) by different methods. In (a), the correlation between different cell types used for the simulation of the T matrix (data_fib = fibroblast, data_epith = cancerous epithelial, data_lymph = T lymphocytes, data_epit_ctrl = healthy epithelial and data_mes = cancerous mesenchymal). We applied EDec (b), MeDeCom (c) and RefFreeEwas (d) on a representative simulation of 100 patients (α0 = 1, ε = 0.2, G = 1, K = 5) after the removal of confounding probes by linear regression (22,483 remaining probes). We used the Pearson method to compute the correlation between the estimated cell type-specific methylation profiles and real cell type-specific methylation profiles used for the simulation
Fig. 7
Fig. 7
Comprehensive comparison of the pre-processing pipeline. Histogram of `A MAE` (`A MAE`: Mean Absolute Error on estimated A, the matrix of cell proportions) for 10 D matrices (mean value of 10 random noises applied on D) computed from 10 random A. Each color represents a different method. Error bars represent standard deviation on 10 random noises. RFE stands for RefFreeEWAS, MDC for MeDeCom and EDec for EDec stage 1. The following parameters were used to simulate D: K = 5, α0 = 1, ε = 0.2, G = 1. The methods were run without pre-processing (NA), after removal of confounding probes by linear regression (lm), after removal of confounding probes and filtering for the most variable probes (lm + var), and after removal of confounding probes and filtering of probes expected to biologically vary in methylation levels across constitutive cell types (lm + infloci)
Fig. 8
Fig. 8
Recommendations and benchmarking pipeline

References

    1. Alizadeh AA, Aranda V, Bardelli A, Blanpain C, Bock C, Borowski C, et al. Toward understanding and exploiting tumor heterogeneity. Nat Med. 2015;21:846–853. doi: 10.1038/nm.3915. - DOI - PMC - PubMed
    1. Houseman EA, Kile ML, Christiani DC, Ince TA, Kelsey KT, Marsit CJ. Reference-free deconvolution of DNA methylation data and mediation by cell composition effects. BMC Bioinformatics. 2016;17:259. doi: 10.1186/s12859-016-1140-4. - DOI - PMC - PubMed
    1. Lutsik P, Slawski M, Gasparoni G, Vedeneev N, Hein M, Walter J. MeDeCom: discovery and quantification of latent components of heterogeneous methylomes. Genome Biol. BioMed Central. 2017;18:55. doi: 10.1186/s13059-017-1182-6. - DOI - PMC - PubMed
    1. Onuchic V, Hartmaier RJ, Boone DN, Samuels ML, Patel RY, White WM, et al. Epigenomic Deconvolution of breast tumors reveals metabolic coupling between constituent cell types. Cell Rep. 2016;17:2075–2086. doi: 10.1016/j.celrep.2016.10.057. - DOI - PMC - PubMed
    1. Jones PA. Functions of DNA methylation: islands, start sites, gene bodies and beyond. Nat Rev Genet. 2012;13:484–492. doi: 10.1038/nrg3230. - DOI - PubMed