. 2020 Jan 13;20(1):5.
doi: 10.1186/s40644-019-0284-7.

Development and validation of a nomogram based on CT images and 3D texture analysis for preoperative prediction of the malignant potential in gastrointestinal stromal tumors

Affiliations

Development and validation of a nomogram based on CT images and 3D texture analysis for preoperative prediction of the malignant potential in gastrointestinal stromal tumors

Caiyue Ren et al. Cancer Imaging. .

Abstract

Background: Gastrointestinal stromal tumors (GISTs), which are the most common mesenchymal tumors of the digestive system, are treated varyingly according to the malignancy. The purpose of this study is to develop and validate a nomogram for preoperative prediction of the malignant potential in patients with GIST.

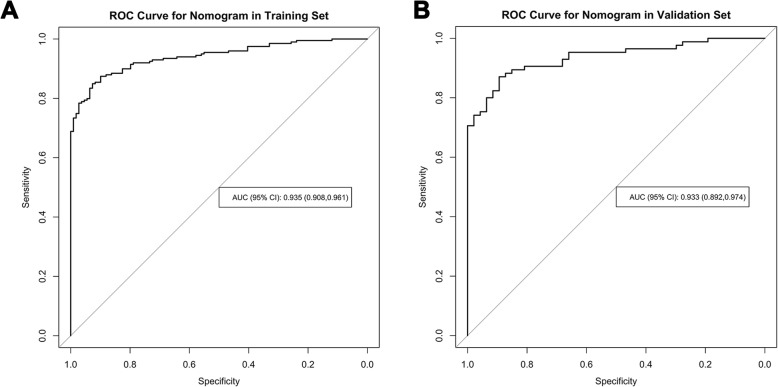
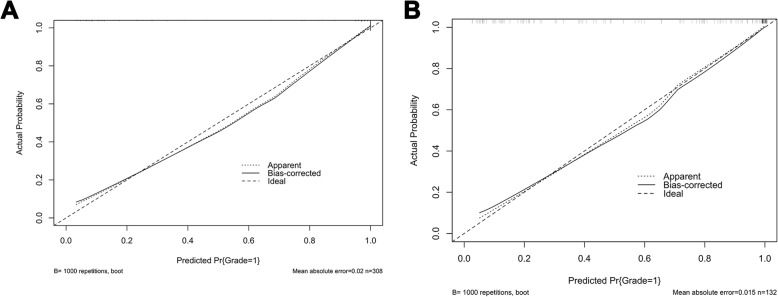
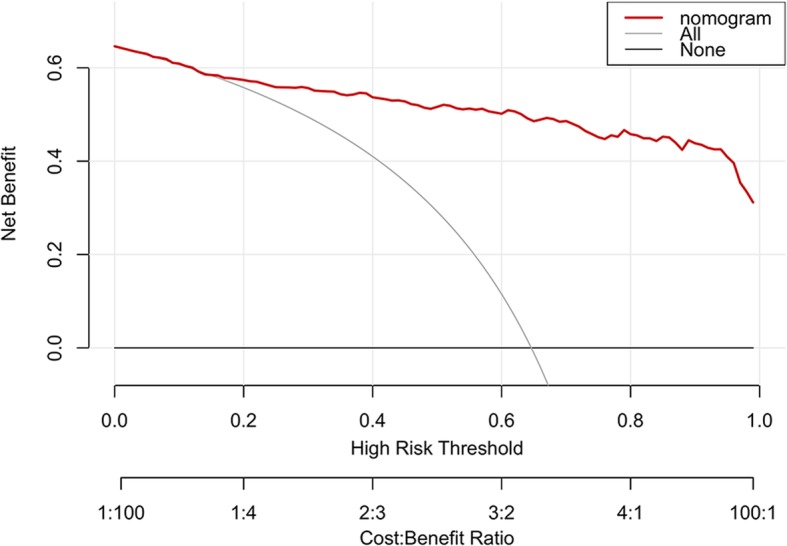
Methods: A total of 440 patients with pathologically confirmed GIST after surgery in our hospital from January 2011 to July 2019 were retrospectively analyzed. They were randomly divided into the training set (n = 308) and validation set (n = 132). CT signs and texture features of each patient were analyzed and predictive model were developed using the least absolute shrinkage and selection operator (lasso) regression. Then a nomogram based on selected parameters was developed. The predictive effectiveness of nomogram was evaluated by the area under receiver operating characteristic (ROC) curve (AUC). Concordance index (C-index) and calibration plots were formulated to evaluate the reliability and accuracy of the nomogram by bootstrapping based on internal (training set) and external (validation set) validity. The clinical application value of the nomogram was determined through the decision curve analysis (DCA).

Results: Totally 156 GIST patients with low-malignant (very low and low risk) and 284 ones with high-malignant potential (intermediate and high risk) are enrolled in this study. The prediction nomogram consisting of size, cystoid variation and meanValue had an excellent discrimination both in training and validation sets (AUCs (95% confidence interval(CI)): 0.935 (0.908, 0.961), 0.933 (0.892, 0.974); C-indices (95% CI): 0.941 (0.912, 0.956), 0.935 (0.901, 0.982); sensitivity: 81.4, 90.6%; specificity: 75.0, 75.7%; accuracy: 88.0, 88.6%, respectively). The calibration curves indicated a good consistency between the actual observation and nomogram prediction for differentiating GIST malignancy. Decision curve analysis demonstrated that the nomogram was clinically useful.

Conclusion: This study presents a prediction nomogram that incorporates the CT signs and texture parameter, which can be conveniently used to facilitate the preoperative individualized prediction of malignancy in GIST patients.

Keywords: Computed tomography; Gastrointestinal stromal tumors; Grade; Nomogram; Texture analysis.


Conflict of interest statement

The authors declare that they have no competing interests.

Figures

Fig. 1
Fig. 1
Abdominal portal venous phase CT images of a 33-years-old woman. Texture features were extracted from the primary tumor area (purple overlay). a transverse section, b median sagittal section, c coronal section, d Histogram
Fig. 2
Fig. 2
The cross-correlation matrix for covariates used to establish predictive model. The depth of color indicates the intensity of the correlation between covariates. The darker the color, the higher the correlation is. The lighter the color, the lower the correlation is. Blue represents positive correlation and red represents negative correlation
Fig. 3
Fig. 3
Features selection for predictive model. Tuning parameter (λ) selection in the lasso model used ten-fold cross-validation. The vertical axis shows the model misclassification rate, and the horizontal axis shows log (λ). The two vertical dashed lines represent one standard deviation on each side from the minimum value, corresponding to the chosen variables that better fit the models
Fig. 4
Fig. 4
Developed prediction nomogram. The nomogram was developed in the training set, with Size, Cystoid variation and meanValue incorporated. The probability of each predictor can be converted into scores according to the first scale “Points” at the top of the nomogram. After adding up the corresponding prediction probability at the bottom of the nomogram is the malignancy of the tumor. The cutoff point of our nomogram is 0.5. The patient would be diagnosed as high-malignant potential GIST when the total prediction probability is beyond the cutoff point
Fig. 5
Fig. 5
a, b Receiver-operating characteristic analysis of the prediction nomogram in training (a) and validation (b) sets
Fig. 6
Fig. 6
a, b Calibration curves of the prediction nomogram in training (a) and validation (b) sets. Calibration curves depict the calibration of the nomogram in terms of the agreement between the probability of the malignant potential of GISTs (Grade) and actual observation. The Y-axis represents the actual observed rates of high-malignant potential GIST whereas the X-axis represents the predicted malignancy probability estimated by the nomogram. The solid line represents the ideal reference line that predicted GIST malignant corresponds to the actual outcome, the short-dashed line represents the apparent prediction of nomogram, and the long-dashed line represents the ideal estimation. The actual GIST malignancy probability corresponded closely to the prediction of the nomogram
Fig. 7
Fig. 7
DCA for the prediction nomogram. The x-axis represented the threshold probability. The threshold probability was where the expected benefit of treatment was equal to the expected benefit of avoiding treatment. The y-axis represented the net benefit. The red line represented the prediction nomogram. The grey and black line represented the hypothesis that all patients with GIST were high-malignant potential or low-malignant potential, respectively

References

    1. Flejou JF. WHO classification of digestive tumors: the fourth edition. Ann Pathol. 2011;31:S27–S31. doi: 10.1016/j.annpat.2011.08.001. - DOI - PubMed
    1. Miettinen M, Lasota J. Gastrointestinal stromal tumors: pathology and prognosis at different sites. Semin Diagn Pathol. 2006;23:70–83. doi: 10.1053/j.semdp.2006.09.001. - DOI - PubMed
    1. Joensuu H. Risk stratification of patients diagnosed with gastrointestinal stromal tumor. Hum Pathol. 2008;39:1411–1419. doi: 10.1016/j.humpath.2008.06.025. - DOI - PubMed
    1. D'Ambrosio L, Palesandro E, Boccone P, et al. Impact of a risk-based follow-up in patients affected by gastrointestinal stromal tumour. Eur J Cancer. 2017;78:122–132. doi: 10.1016/j.ejca.2017.03.025. - DOI - PubMed
    1. DeMatteo RP, Heinrich MC, El-Rifai WM, Demetri G. Clinical management of gastrointestinal stromal tumors: before and after STI-571. Hum Pathol. 2002;33:466–477. doi: 10.1053/hupa.2002.124122. - DOI - PubMed

Publication types

MeSH terms