. 2020 Jan 14:9:e51862.
doi: 10.7554/eLife.51862.

Inflammation-induced IgE promotes epithelial hyperplasia and tumour growth

Affiliations

Inflammation-induced IgE promotes epithelial hyperplasia and tumour growth

Mark David Hayes et al. Elife. .

Abstract

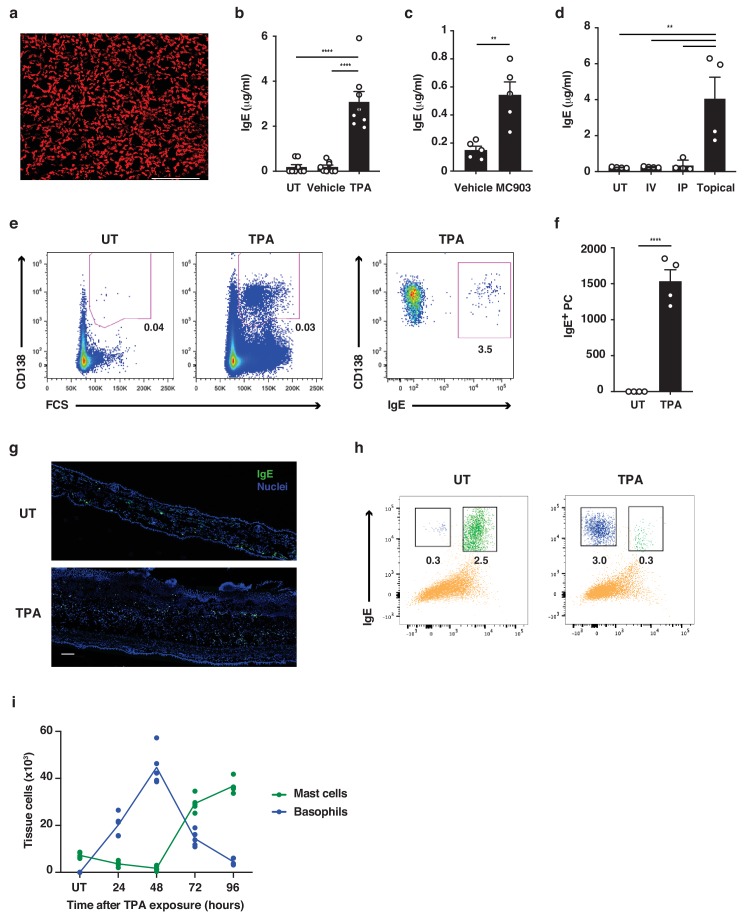
IgE is the least abundant circulating antibody class but is constitutively present in healthy tissues bound to resident cells via its high-affinity receptor, FcεRI. The physiological role of endogenous IgE antibodies is unclear but it has been suggested that they provide host protection against a variety of noxious environmental substances and parasitic infections at epithelial barrier surfaces. Here we show, in mice, that skin inflammation enhances levels of IgE antibodies that have natural specificities and a repertoire, VDJ rearrangements and CDRH3 characteristics similar to those of IgE antibodies in healthy tissue. IgE-bearing basophils are recruited to inflamed skin via CXCL12 and thymic stromal lymphopoietin (TSLP)/IL-3-dependent upregulation of CXCR4. In the inflamed skin, IgE/FcεRI-signalling in basophils promotes epithelial cell growth and differentiation, partly through histamine engagement of H1R and H4R. Furthermore, this IgE response strongly drives tumour outgrowth of epithelial cells harbouring oncogenic mutation. These findings indicate that natural IgE antibodies support skin barrier defences, but that during chronic tissue inflammation this role may be subverted to promote tumour growth.

Keywords: IgE; basophils; cancer; cancer biology; epithelial cells; immunology; inflammation; mouse; skin.


Conflict of interest statement

MH, SW, GC, RS, WJ, DK, DV, DD, JS No competing interests declared

Figures

Figure 1.
Figure 1.. Skin inflammation increases IgE levels locally and systemically.
(a) Representative image of IgE staining (red) in healthy dermal skin. Scale = 50 μm. The image is representative of tile-scans from healthy untreated (UT) dermal sheets of five independent mice. (b–d) ELISA of IgE in serum of UT wildtype (WT) BALB/c mice and mice treated on the dorsal ear skin with (b) 2.5 nM TPA 2x a week for 2 weeks or vehicle control (ethanol) (n = 8), (c) 1 nM MC903 5x a week for 2 weeks or vehicle control (ethanol) (n = 5) or (d) 100 μg R848 3x a week for 2 weeks or similarly i.v. or i.p. (n = 4). Data are expressed as means ± SEM. (e, f) Fluorescence-assisted cell sorting (FACS) analysis of IgE-secreting plasma cells in the skin draining LNs of UT WT mice and mice exposed topically to TPA on the dorsal side of the ears 2x a week for 2 weeks. (e) Representative plots of plasma cells gated as FSChiCD95+CD138+ cells, and with intracellular IgE staining to show isotype switching. (f) Enumeration of IgE+ plasma cells in skin draining LN (n = 4). (g) Representative images of IgE staining (green) in UT and TPA treated whole skin. Nuclei in blue. Scale = 100 μm. Images are representative of tile-scans from ear cross-sections from six independent mice. (h, i) FACS analysis of IgE-bearing cells in whole naïve UT skin and in TPA-treated skin (TPA 2x a week for 2 weeks). (h) Representative plots of IgE-bearing mast cells (green) and basophils (blue) 48 hr after last TPA exposure. (i) Enumeration of IgE-bearing mast cells and basophils at the indicated time points after topical TPA. Mast cells were defined as CD45hicKit+IgE+CD41 and basophils as CD45locKitIgE+CD41+(n = 5). One-way ANOVA multiple comparison (b, d) and two-tailed Student’s t-test for unpaired data (c, f) were used to test for statistical difference. **p<0.01 and ****p<0.0001. IP, intraperitoneal; IV, intravenous; UT, untreated.
Figure 2.
Figure 2.. Skin inflammation induces polyclonal ‘natural IgE’ antibodies with characteristics similar to those of IgE antibodies in naïve animals.
(a–d) High-throughput sequencing and heavy-chain repertoire analysis of IgE in sorted FSChiCD95hiCD138+ plasma cells from skin-draining LNs of wildtype (WT) mice 7 days after topical exposures to TPA (TPA 2x a week for 2 weeks) (n = 6) and in whole spleen from untreated (UT) naïve mice (n = 5). (a) % of the total repertoire consisting of clone sizes ≤ 10. (b) Igh-V gene family usage expressed as mean of total repertoire ± SEM. V genes that are not used in the repertoire of any mouse are not included for clarity. (b) Paired DJ repertoire shown as average Igh-D and Igh-J use of total repertoire in UT (left) and TPA-treated (right) mice. (d) Physicochemical properties of the CDRH3 regions; length (number of amino acids), % mutation compared to germline, aliphatic index and isoelectric point (pI) presented as mean ± SEM. (e) Level of IgE in serum specific for phosphorylcholine (PC) in UT WT (n = 6), UT Tcrb–/– (n = 5), 10x TPA-treated (2x/week) WT mice (n = 6) and in WT mice that have undergone 7,12-dimethylbenz[a]anthracene (DMBA)-TPA carcinogenesis (single low-dose DMBA + 20 weeks TPA, 2x/week) (n = 14). Data are presented as means ± SEM. Statistics by two-tailed Student’s t-test for unpaired data (a, b, d) and one-way ANOVA multiple comparison (e); *p<0.05 and ****p<0.0001.
Figure 3.
Figure 3.. Natural IgE promotes inflammation-driven outgrowth of tumours.
(a) Tumour susceptibility expressed as tumour latency (time to appearance of first tumour), tumour incidence (average number of tumours per mouse) and tumour area (average tumour size per mouse) in BALB/c WT and Igh7–/– mice (n = 9/group) mice following DMBA-TPA inflammation-driven carcinogenesis and following similar DMBA exposure without TPA (n = 6). Data are expressed as means ± SEM, and statistical significance assessed using a Log-rank (Mantel-Cox) test for tumour latency and linear regression for tumour incidence and area. (b) ELISA of IgE in serum of WT mice at indicated time-points during DMBA-TPA carcinogenesis (n = 9). (c) FACS analysis of IgE-bearing cells among the total CD45+ leukocyte infiltrate in tumour tissue, peri-lesional skin and untreated (UT) belly skin of WT mice (n = 6, tumours > 3 mm were picked). Mast cells were defined as CD45hicKit+IgE+CD41 and basophils as CD45locKitIgE+CD41+. (d) Quantitative RT-PCR analysis of Cpa3 transcripts (relative specific for mast cells) and Mcpt8 (relative specific for basophils) in tumour tissue, peri-lesional skin and UT belly skin from WT mice (n = 9). Data are expressed as mean ± SEM relative to the control gene cyclophilin. (e) Representative images of IgE staining (green) and basement membrane component CD49F (white) in inflammation (DMBA-TPA)-induced tumours. Nuclei in blue. Scale = 400 μm. Images are representative tile-scans of cross-sections from independent tumours in eight WT mice. Inset shows higher magnification of indicated area. Statistics by one-way ANOVA testing for linear trend of IgE increase with time (b) and one-way ANOVA multiple comparison (c,d); *p<0.05, **p<0.01, ***p<0.001 and ****p<0.0001. ns = not significant.
Figure 3—figure supplement 1.
Figure 3—figure supplement 1.. IgE-deficient mice acquire DNA-damage when exposed to DMBA but develop fewer antibodies during DMBA-TPA carcinogenesis.
(a) WT and Igh7–/mice were treated with a single dose of 200 nmol DMBA to the dorsal ear skin. Phosphorylation of the histone H2AX (γH2AX), as a measure of double-stranded DNA-breaks, was assessed by FACS in CD45 skin epithelial cells 24 hr later (n = 6 for DMBA-treated WT, n = 5 in all other groups). (b) WT and Igh7–/– mice were treated with a single subclinical dose of DMBA to the shaved dorsal back skin, and skin inflammation was promoted by twice-weekly TPA application for 19 weeks. Total IgE, IgG1and IgG2a antibodies were measured in the serum by ELISA at the end point (n = 9/group). Data are expressed as means ± SEM, and statistical significance was assessed by one-way ANOVA multiple comparison (a) or two-tailed Student’s t-test for unpaired data (b); **p<0.01 and ***p<0.001. UT = untreated; ns = not significant, nd = not detected.
Figure 4.
Figure 4.. IgE alters the inflamed skin microenvironment and induces epithelial hyperplasia.
(a–f) Analysis of the skin microenvironment in untreated (UT) or TPA-treated (topical TPA to the dorsal ear skin 2x/week for 2 weeks) wildtype (WT) and Igh7–/– mice. (a) FACS analysis of total CD45+ leukocytes in whole skin and enumeration of mast cells and basophil numbers (n = 6). Mast cells were defined as CD45hicKit+FcεRI+CD41 and basophils as CD45locKitFcεRI+CD41+. (b) Quantitative RT-PCR analysis of the levels of the indicated transcripts in whole skin relative to that of the control gene cyclophilin (n = 5). (c, d) ELISA assessing the amount of histamine released ex vivo from ear skin into media when floated overnight (c) and in vivo into the serum (d) (WT n = 3, Igh7–/– n = 4). (e) Representative images of H&E-stained cross-sections from inflamed TPA-treated ear skin of WT and Igh7–/– mice. (f) Epidermal thickness is enumerated. Data in (a–d, f) are expressed as means ± SEM. One-way ANOVA multiple comparison was used to assess statistical difference; *p<0.05, **p<0.01, ***p<0.001 and ****p<0.0001. UT = untreated; ns = not significant.
Figure 4—figure supplement 1.
Figure 4—figure supplement 1.. The cellular immune composition of inflamed skin is unaltered in the absence of IgE-mediated signalling.
(a, b) Ear skin of WT and (a) Igh7–/– or (b) FceR1a–/– mice was treated topically with TPA, twice a week for two weeks, and the cellular immune composition of the skin was analysed by FACS and compared to that of UT healthy skin. The gating strategy used for all cell populations is detailed in the 'Materials and methods' section. Data are presented as means ± SEM of total CD45+ leukocytes in the skin. The gating strategy for specific cell populations is outlined in methods. Statistical analysis was performed by one-way ANOVA multiple comparison; *p<0.05, **p<0.01 and ****p<0.0001. UT = untreated.
Figure 4—figure supplement 2.
Figure 4—figure supplement 2.. FcεRI+ cells from inflamed skin produce type-two cytokine proteins.
FcεRI+ cells were isolated from inflamed skin following topical treatment with TPA, twice a week for two weeks (n = 3). Cells were left in culture for 4 hr with brefeldin alone (unstimulated) or with 5 μg/ml α-IgE antibody to crosslink surface IgE (IgE crosslinking). Cells were subsequently FACS stained for intracellular IL-4, IL-5 and IL-13. (a) Representative FACS plots of cytokine expression and (b) quantification of % cytokine-producing cells. Data are presented as means ± SEM, and statistical significance was assessed by two-tailed Student’s t-test; *p<0.05, **p<0.01 and ***p<0.001.
Figure 5.
Figure 5.. IgE activity in inflamed skin is mediated via FcεRI-signalling in basophils.
(a–d, h) Healthy untreated (UT) ear skin of mice was examined and compared to inflamed TPA-treated skin (topical TPA 2x/week for 2 weeks). (a) Mast cells and basophils were FACS sorted from the skin of WT and Igh7–/– mice and (b) basophils were sorted from the spleen of WT mice 72 hr after the last TPA treatment (n = 3/group). Mast cells were defined as CD45hicKit+FcεRI+CD41 and basophils as CD45locKitFcεRI+CD41+. (a, b) Quantitative RT-PCR analysis of the levels of Il4, Il6 and Il13 transcripts in the FACS-sorted cell populations from the indicated tissues relative to levels of the control gene cyclophilin. (c) ELISA assessing the amount of histamine released ex vivo from ear skin into media when floated overnight (left panel) and in vivo into the serum (right panel) of WT, FceR1a–/– and Mcpt8Cre/+ mice (n = 3/group). (d) Epidermal thickness measured from H&E-stained cross-sections of WT and Mcpt8Cre/+ ear skin (n = 5/group). (e–g) Neonatal WT skin EC (keratinocytes) were grown in vitro to 70% confluency and then supplemented with (e) media from IgE-crosslinked basophils or media alone or (f) differing concentrations of histamine (n = 3/group). Histamine receptors on ECs were blocked by adding 10 μM H1R- or H4R-antagonist or both to cultures with added histamine (f) or basophil media (g) (n = 3/group). (e–g) EC were analysed by qRT-PCR for the expression levels of transcripts indicating cell cycling (Ki67) and differentiation (K5, K14, K1 and K10) relative to the expression level of the control gene cyclophilin. (h) Epidermal thickness measured from H&E-stained cross-sections of WT ear skin following in vivo blocking of H1R or H4R by i.p. administration of antagonist drug or vehicle control (n = 5/group). All data are expressed as means ± SEM. Statistical analysis was performed by one-way ANOVA multiple comparison (a–d, f–h) or two-tailed Student’s t-test (e); *p<0.05, **p<0.01, ***p<0.001 and ****p<0.0001. UT = untreated; ns = not significant.
Figure 5—figure supplement 1.
Figure 5—figure supplement 1.. Basophils are potently immune active in inflamed skin but require IgE for full activity.
Mast cells and basophils were FACS sorted from the inflamed TPA-treated skin of WT and Igh7–/– mice (topical TPA, 2x/week for 2 weeks) 72 hr after the last TPA treatment (n = 3/group). Mast cells were defined as CD45hicKit+FcεRI+CD41 and basophils as CD45locKitFcεRI+CD41+. Quantitative RT-PCR analysis of the indicated transcripts in the FACS-sorted cell populations are shown relative to the control gene cyclophilin. All data are expressed as means ± SEM. Statistical analysis was performed by one-way ANOVA multiple comparison; *p<0.05, **p<0.01, ***p<0.001 and ****p<0.0001.
Figure 5—figure supplement 2.
Figure 5—figure supplement 2.. IgE-activated basophils promote cytokine expression in skin EC.
Neonatal WT skin EC (keratinocytes) were grown in vitro to 70% confluency and then supplemented with media from IgE-crosslinked basophils or cell-free media alone (n = 3/group). EC expression of the indicated cytokines was analysed by qRT-PCR and presented relative to the expression of the control gene cyclophilin. Data are presented as means ± SEM, and statistical significance was assessed by two-tailed Student’s t-test; *p<0.05 and ***p<0.001.
Figure 6.
Figure 6.. Basophil recruitment to the skin requires TSLP/IL-3-mediated upregulation of CXCR4.
(a–f, h, l–n) Inflamed skin was analysed 24 hr after a single topical application of 2.5 nM TPA and compared to healthy UT skin. (a) Recruitment of basophils to inflamed skin was analysed by FACS and presented as absolute numbers of basophils in ear skin following i.v. injection of PTX or vehicle control. Basophils were gated as CD45locKitIgE+CD41+. (b) Expression of chemokines in whole skin and (c) expression of chemokine receptors in sorted skin basophils and mast cells were analysed by qRT-PCR and presented relative to the expression of the control gene cyclophilin. (d–f) Recruitment of basophils to inflamed skin was analysed as in panel (a): (d) after i.v. injection of 50 ng anti-CXCR2 antibody, (e) in Ccr2–/– mice, or (f) after i.v. injection of 50 ng anti-CXCR4 antibody. Suitable control populations were used to show the efficacy of a treatment where appropriate. (g, i–k) Basophils were isolated from the spleen of WT mice and (g) analysed for cell surface or intracellular expression of CXCR4 by flow cytometry. (h) Expression of IL-3 and TSLP in whole inflamed and untreated (UT) skin was analysed by qRT-PCR and presented relative to the expression of the control gene cyclophilin. (i) Splenic basophils were incubated with 1 μg/ml TSLP or media alone for 24 hr, and expression levels of CXCR4 transcripts were assessed by qRT-PCR. (j, k) Basophils were activated for 24 hr with 100 ng/ml IL-3, 1 μg/ml TSLP or isotype control, with PMA/ionomycin for 4 hr, or left UT before surface expression of CXCR4 was analysed by (j) FACS or (k) total CXCR4 expression (yellow) imaged with surface staining of CD45 (red) using Imagestream. (l–n) Recruitment of basophils to inflamed skin was analysed as in panel (a): (l) in Tcrb–/, Tcrd–/– and Tcrbd–/– mice, (m) following intradermal (i.d.) injection of 20 ng anti-TSLP or anti-IL-3 (or both) antibodies into the TPA treated ear or (n) into the contralateral ear. Representative data are shown in panels (g, j [left panels]) as histograms of CXCR4 FACS stain and in panel (k) as images from Imagestream; all other data are expressed as means ± SEM. Statistical analyses were performed by one-way ANOVA multiple comparison (a–c, e, g, j, l–n) or two-tailed Student’s t-test (d, f, h–i); *p<0.05, **p<0.01, ***p<0.001 and ****p<0.0001. UT = untreated; ns = not significant; BF = bright field.
Figure 6—figure supplement 1.
Figure 6—figure supplement 1.. Basophils demonstrate chemotaxis towards CXCL12.
Basophils were cultured from bone marrow (n = 5) and FACS sorted on day 14 of culture as CD45+cKitFcεRI+ cells. (a) Basophils were stained for expression of the CXCR4 receptor (representative histogram shown) and (b) assessed for chemotaxis towards CXCL12 using transwells. Data are expressed as absolute numbers of basophils migrated and as % migrated basophils ± SEM (n = 5). Statistical analysis was performed by one-way ANOVA multiple comparison; ****p<0.0001.
Figure 7.
Figure 7.. FcεRI-signalling in basophils promotes inflammation-driven outgrowth of cSCCs.
(a–h) Mice were treated with a single subclinical dose of DMBA to the shaved dorsal back skin, and skin inflammation was promoted by twice weekly TPA application for 18–25 weeks. Tumour susceptibility is expressed as tumour latency (time to appearance of first tumour), tumour incidence (average number of tumours per mouse) and tumour area (average tumour size per mouse) in (a) WT (n = 10) and FceR1a–/– mice (n = 9), (c) WT (n = 10) and Cpa3Cre/+ mice (n = 8), (e) WT and Mcpt8Cre/+ mice (n = 9/group) and (h) WT mice given the H1R antagonist cetirizine at 30 mg/kg or vehicle control in the drinking water throughout the experiment (n = 10/group). (b) FACS analysis of leukocyte infiltrate in tumour tissue and perilesional skin of WT and FceR1a–/– mice (n = 7 for WT groups; n = 3 for tumour, n = 7 for peri-lesional tissue for FceR1a–/–) presented as proportion of total CD45+ leukocytes. (d, f) FACS analysis of mast cells and basophils in tumours and peri-lesional tissue of (d) WT and Cpa3Cre/+ mice (n = 6 for WT groups; n = 3 for tumour, n = 6 for peri-lesional tissue for Cpa3Cre/+) and of (f) WT and Mcpt8Cre/+ mice (n = 5/group). Data are expressed as means ± SEM, and statistical significance was assessed using Log-rank (Mantel-Cox) test for tumour latency and linear regression for tumour incidence and area (a, c, e, h) and one-way ANOVA multiple comparison (b, d, f); p<0.05, **p<0.01 and ****p<0.0001.

References

    1. Abel EL, Angel JM, Kiguchi K, DiGiovanni J. Multi-stage chemical carcinogenesis in mouse skin: fundamentals and applications. Nature Protocols. 2009;4:1350–1362. doi: 10.1038/nprot.2009.120. - DOI - PMC - PubMed
    1. Bergot AS, Ford N, Leggatt GR, Wells JW, Frazer IH, Grimbaldeston MA. HPV16-E7 expression in squamous epithelium creates a local immune suppressive environment via CCL2- and CCL5- mediated recruitment of mast cells. PLOS Pathogens. 2014;10:e1004466. doi: 10.1371/journal.ppat.1004466. - DOI - PMC - PubMed
    1. Boring L, Gosling J, Chensue SW, Kunkel SL, Farese RV, Broxmeyer HE, Charo IF. Impaired monocyte migration and reduced type 1 (Th1) cytokine responses in C-C chemokine receptor 2 knockout mice. Journal of Clinical Investigation. 1997;100:2552–2561. doi: 10.1172/JCI119798. - DOI - PMC - PubMed
    1. Coussens LM, Raymond WW, Bergers G, Laig-Webster M, Behrendtsen O, Werb Z, Caughey GH, Hanahan D. Inflammatory mast cells up-regulate angiogenesis during squamous epithelial carcinogenesis. Genes & Development. 1999;13:1382–1397. doi: 10.1101/gad.13.11.1382. - DOI - PMC - PubMed
    1. Coussens LM, Zitvogel L, Palucka AK. Neutralizing tumor-promoting chronic inflammation: a magic bullet? Science. 2013;339:286–291. doi: 10.1126/science.1232227. - DOI - PMC - PubMed

Publication types

Substances