. 2020 Jan 28;117(4):2218-2224.
doi: 10.1073/pnas.1909726116. Epub 2020 Jan 13.

Effective fisheries management instrumental in improving fish stock status

Affiliations

Effective fisheries management instrumental in improving fish stock status

Ray Hilborn et al. Proc Natl Acad Sci U S A. .

Abstract

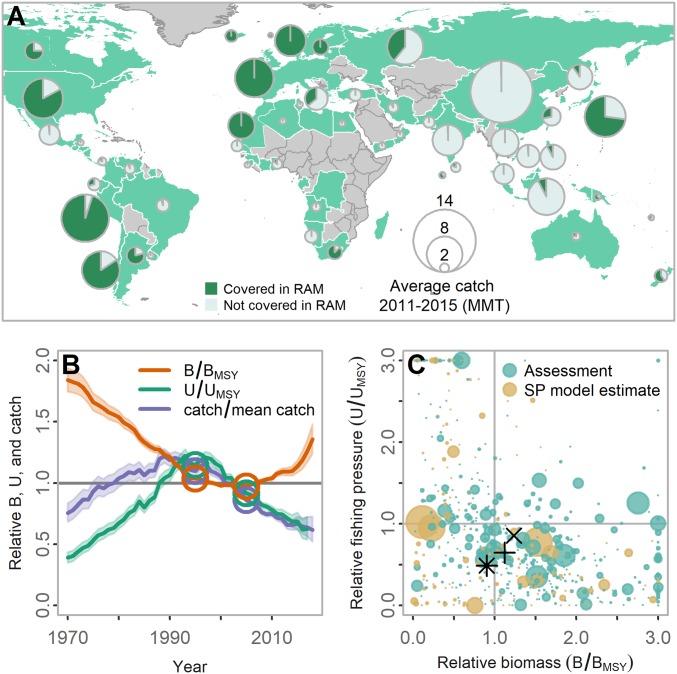
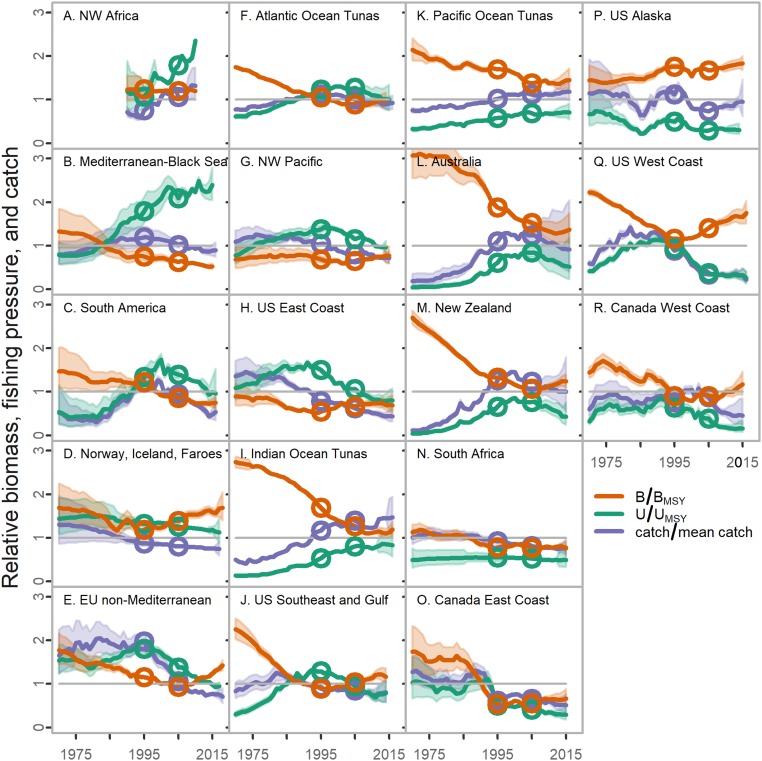
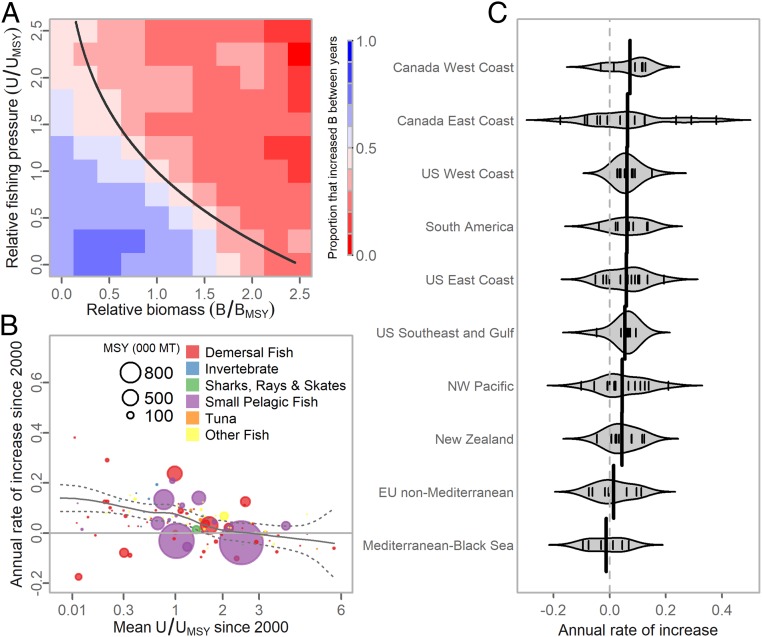
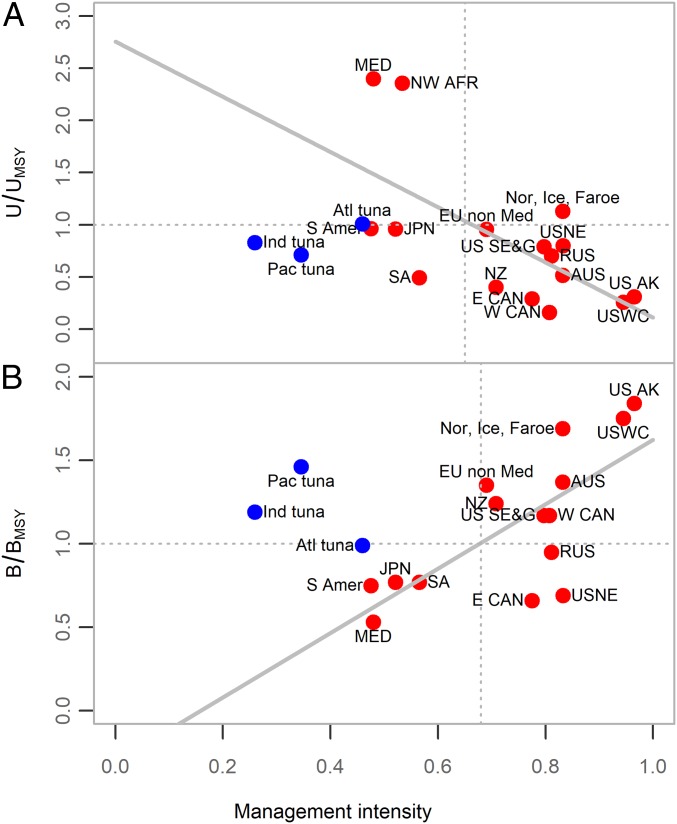
Marine fish stocks are an important part of the world food system and are particularly important for many of the poorest people of the world. Most existing analyses suggest overfishing is increasing, and there is widespread concern that fish stocks are decreasing throughout most of the world. We assembled trends in abundance and harvest rate of stocks that are scientifically assessed, constituting half of the reported global marine fish catch. For these stocks, on average, abundance is increasing and is at proposed target levels. Compared with regions that are intensively managed, regions with less-developed fisheries management have, on average, 3-fold greater harvest rates and half the abundance as assessed stocks. Available evidence suggests that the regions without assessments of abundance have little fisheries management, and stocks are in poor shape. Increased application of area-appropriate fisheries science recommendations and management tools are still needed for sustaining fisheries in places where they are lacking.

Keywords: harvest impacts; overfishing; sustainable fisheries.


Conflict of interest statement

Competing interest statement: All authors are involved in fisheries management or provide fisheries advice in ways that can be viewed as competing interests. Many are employed by national fisheries agencies or nongovernmental organizations that advocate for specific fisheries policies. The academic scientists have received funding from sources that include government fisheries agencies, fishing companies, and environmental nongovernmental organizations.

Figures

Fig. 1.
Fig. 1.
Global status of assessed fish and invertebrate stocks. (A) RAM Legacy Stock Assessment Database Version 4.44 coverage, showing countries with (pale green) and without (gray) data included. Pies are displayed for the top 50 countries by catch. Circle area of countries or groups of countries is proportional to landed tonnage reported to the FAO; dark green shaded pie areas are proportions of total landings accounted for by stocks in RAM Legacy Database. (B) State-space model estimates of geometric mean B/BMSY, U/UMSY and catch/(mean catch) from 1970 to 2016, rescaled to the median in years of high coverage. All stocks are given equal weight. Circles denote years 1995 and 2005. Shaded regions denote 95% finite population corrected confidence bounds. (C) Status of individual stocks in their latest year of assessment. Circle areas represent estimated MSY of the stock. Circles shaded green use reference points from stock assessments; circles shaded orange use reference points estimated from biomass dynamics model fits. Overlaid symbols show bivariate summary statistics across stocks: median (+), geometric mean with equal weighting (*), and geometric mean weighted by MSY (X).
Fig. 2.
Fig. 2.
State-space model estimates of geometric mean (rescaled to the median in years of high coverage) biomass relative to BMSY (orange), fishing pressure (green) relative to UMSY, and catch relative to mean catch (purple), for assessed stocks in contrasting regions. (AR) Stocks are equally weighted. Circles denote years 1995 and 2005. Shaded regions denote 95% finite population-corrected confidence bounds; in years when all stocks are assessed, there is no uncertainty considered. Panels are sorted according to mean U/UMSY in 2010 (highest in A, lowest in R).
Fig. 3.
Fig. 3.
(A) Fraction of stocks that increased in abundance given a stock was at a specific value of B/BMSY (x axis) and U/UMSY (y axis) in the preceding year. The black solid line represents the combinations of B/BMSY and U/UMSY for which the population is predicted to remain stable (13) under a Pella-Tomlinson stock-production model. At all combinations below or left of the line, the population should increase; at all combinations above and to the right, the population should decline; and near the line, populations should have an equal probability of increase or decrease. All stocks and years in which B/BMSY and U/UMSY were available from assessments or from biomass dynamics model fits were used to calculate fractions of increase (dark red means 0% of the stocks increased in biomass, dark blue means 100% of the stocks increased in biomass). (B) The relationship between annual rate of increase in biomass since 2000 (y axis) and average annual exploitation rate since 2000 (x axis, shown on a square root scale) for the 115 stocks that were below 0.5 BMSY in 2000. Gray line is a loess smoother fit to the data. Circle area is proportional to MSY. (C) Rate of biomass increase for regions with more than 5 stocks below 0.5 BMSY in 2000. Small hatch marks indicate individual stocks, violin plots show overall distributions, and large hatch marks denote regional means.
Fig. 4.
Fig. 4.
Relationship between regional geometric mean (rescaled to the median in years of high coverage) (A) U/UMSY and (B) B/BMSY and the joint management and enforcement scores for FMI surveys in corresponding regions. Blue points represent tuna fisheries from the Atlantic, Pacific, and Indian Oceans, and red points represent other regions shown in Fig. 2. Solid gray line is a linear fit to the data plotted in red. Dotted gray lines mark where U/UMSY or B/BMSY = 1 and where the best fit line intersects with U/UMSY or B/BMSY = 1. Abbreviations for regions are as follows: Atl tuna, Atlantic Ocean tunas; Ind tuna, Indian Ocean tunas; Pac tuna, Pacific Ocean tunas; AUS, Australia; E CAN, Canada East; W CAN, Canada West; EU non Med, EU non-Mediterranean; JPN, Japan; Med, Mediterranean; NZ, New Zealand; Nor, Ice, Faroe, Norway, Iceland, and Faroe Islands; NW AFR, NW Africa; RUS, Russia; SA, South Africa; S Amer, South America; US AK, US Alaska; USNE, US North East; US S&G, US Southeast and Gulf; USWC, US West Coast.

References

    1. Ludwig D., Hilborn R., Walters C., Uncertainty, resource exploitation, and conservation: Lessons from history. Science 260, 17–36 (1993). - PubMed
    1. Sætersdal G., A review of past management of some pelagic stocks and its effectiveness. Rapp. P. V. Reun. Cons. Int. Explor. Mer. 177, 505–512 (1980).
    1. Dickey-Collas M., et al. , Lessons learned from stock collapse and recovery of North Sea herring: A review. ICES J. Mar. Sci. 67, 1875–1886 (2010).
    1. Glantz M. H., Science, politics and economics of the Peruvian anchoveta fishery. Marine Policy 3, 201–210 (1979).
    1. Hutchings A., Myers R., What can be learned from the collapse of a renewable resource? Atlantic cod, Gadus morhua, of Newfoundland and labrador. Can. J. Fish. Aquat. Sci. 51, 2126–2146 (1994).

Publication types

LinkOut - more resources