. 2020 Jan 28;117(4):2201-2210.
doi: 10.1073/pnas.1916548117. Epub 2020 Jan 13.

Multifeature analyses of vascular cambial cells reveal longevity mechanisms in old Ginkgo biloba trees

Affiliations

Multifeature analyses of vascular cambial cells reveal longevity mechanisms in old Ginkgo biloba trees

Li Wang et al. Proc Natl Acad Sci U S A. .

Abstract

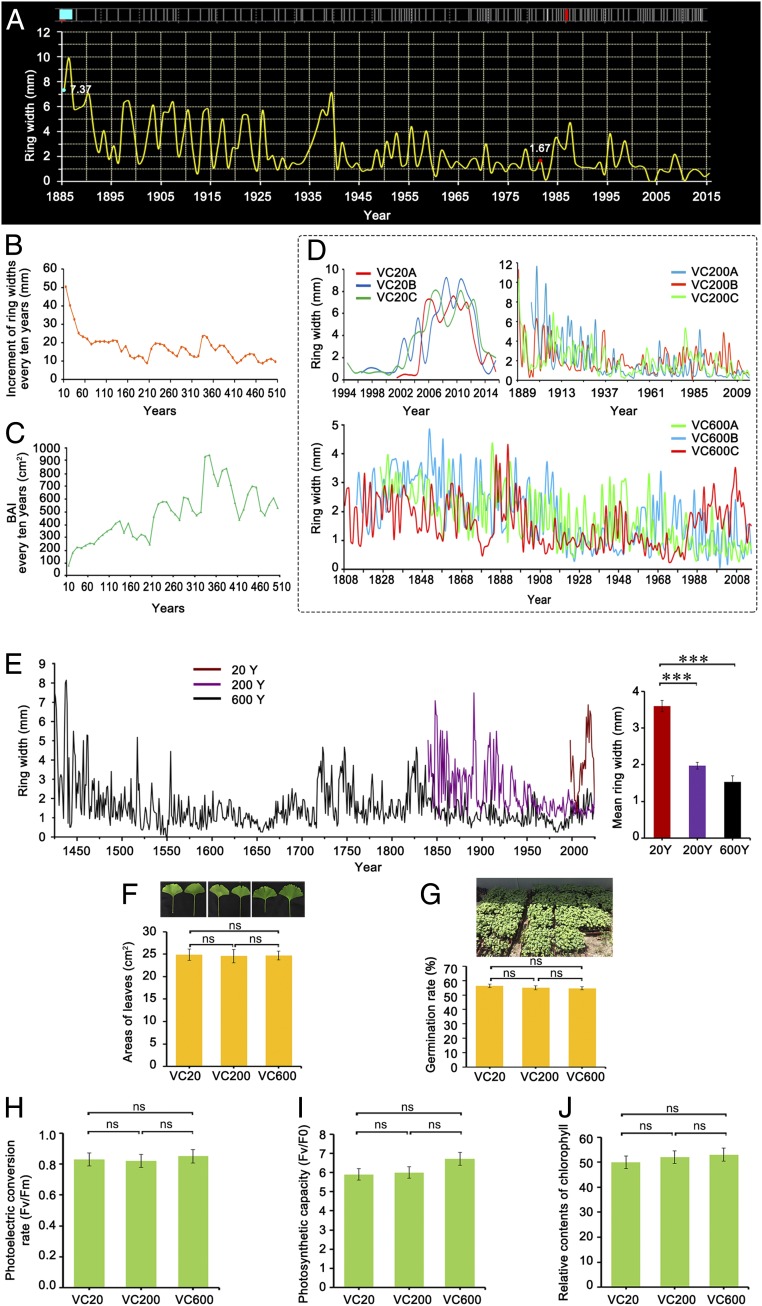
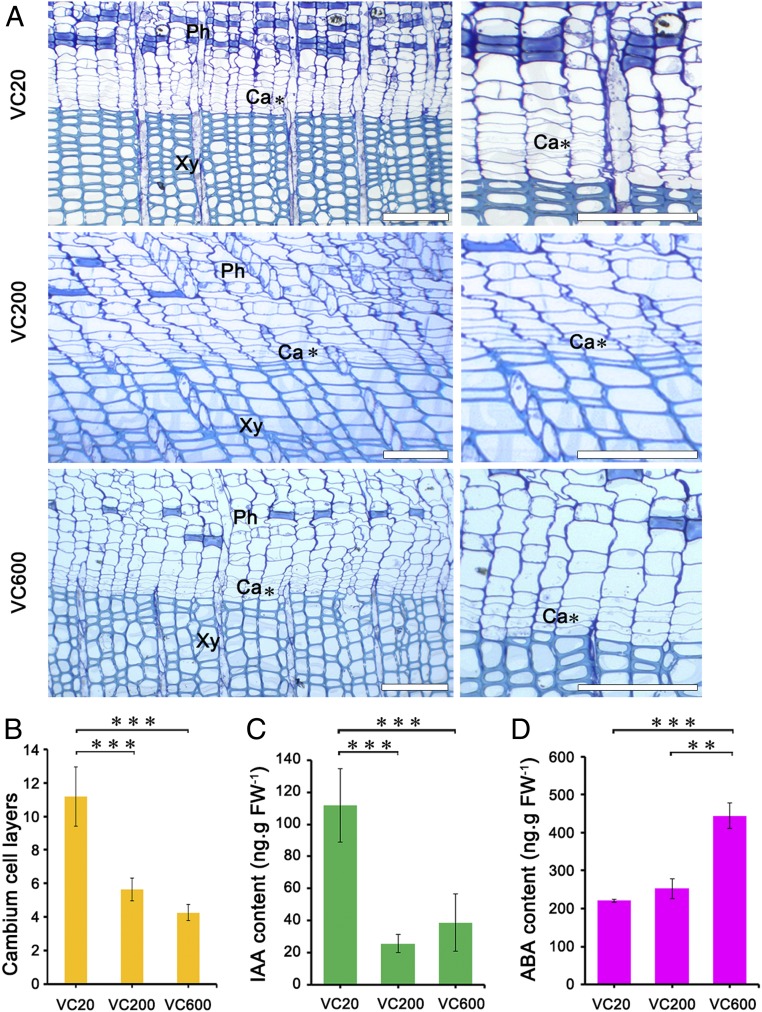
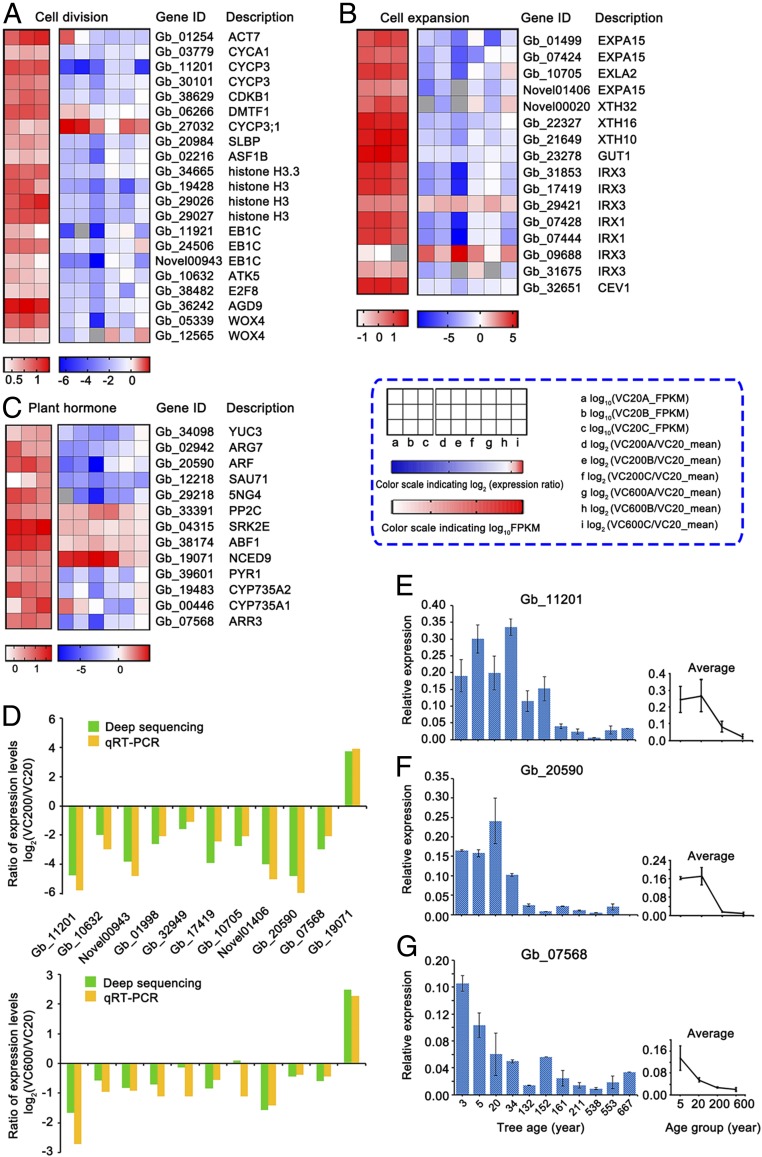
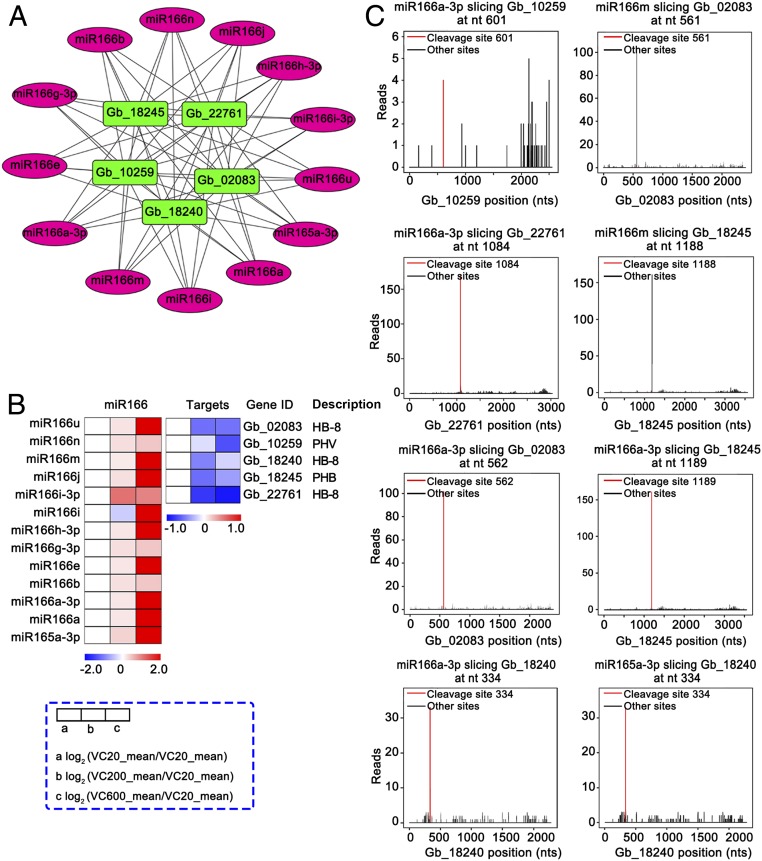
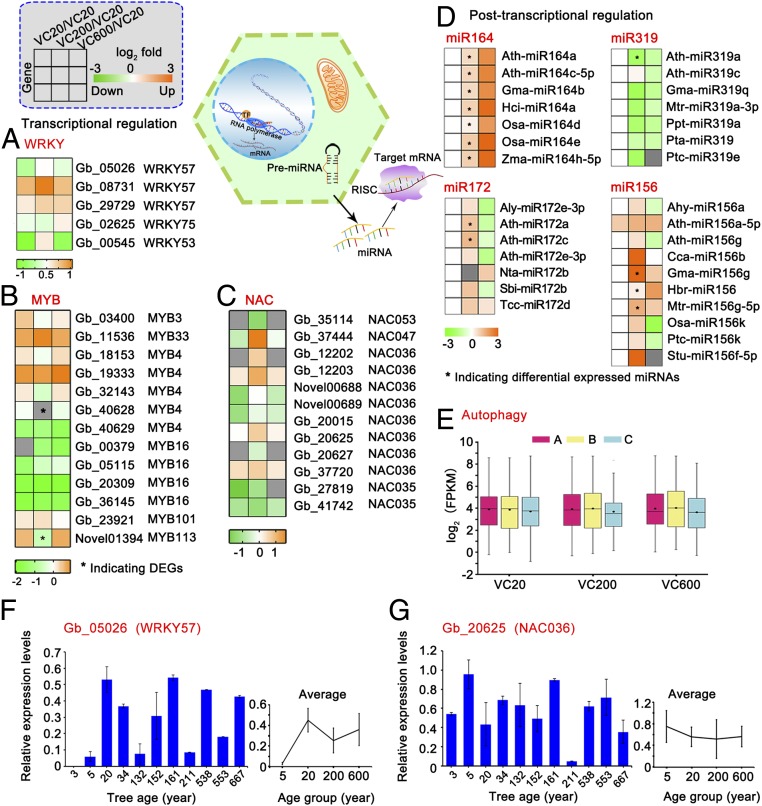
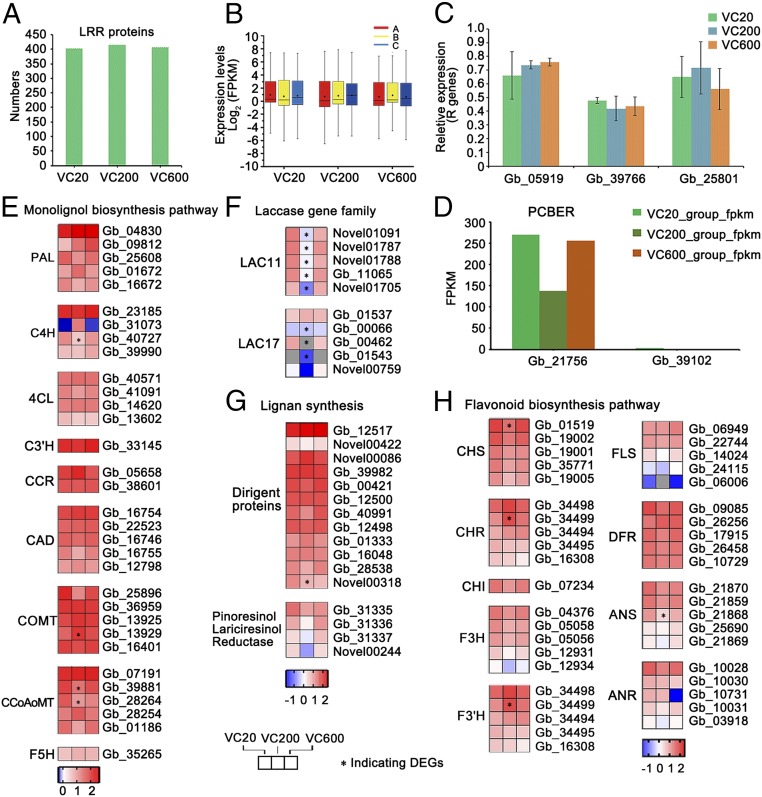
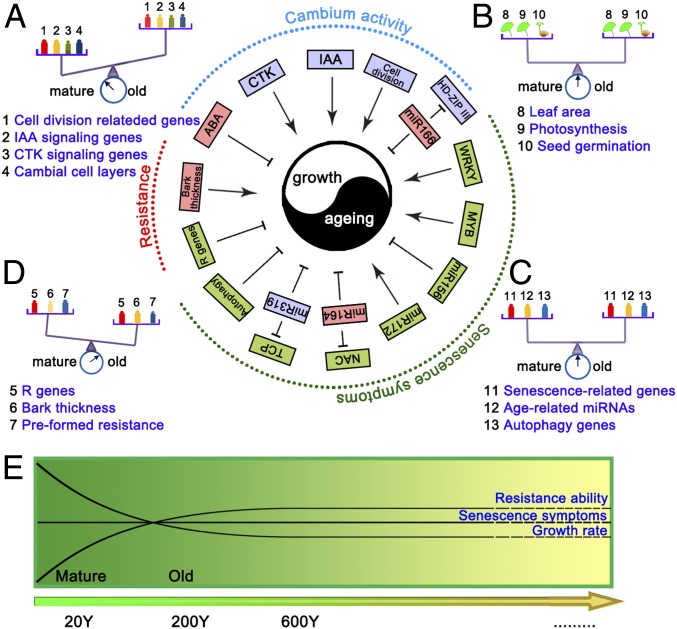
Aging is a universal property of multicellular organisms. Although some tree species can live for centuries or millennia, the molecular and metabolic mechanisms underlying their longevity are unclear. To address this, we investigated age-related changes in the vascular cambium from 15- to 667-y-old Ginkgo biloba trees. The ring width decreased sharply during the first 100 to 200 y, with only a slight change after 200 y of age, accompanied by decreasing numbers of cambial cell layers. In contrast, average basal area increment (BAI) continuously increased with aging, showing that the lateral meristem can retain indeterminacy in old trees. The indole-3-acetic acid (IAA) concentration in cambial cells decreased with age, whereas the content of abscisic acid (ABA) increased significantly. In addition, cell division-, cell expansion-, and differentiation-related genes exhibited significantly lower expression in old trees, especially miR166 and HD-ZIP III interaction networks involved in cambial activity. Disease resistance-associated genes retained high expression in old trees, along with genes associated with synthesis of preformed protective secondary metabolites. Comprehensive evaluation of the expression of genes related to autophagy, senescence, and age-related miRNAs, together with analysis of leaf photosynthetic efficiencies and seed germination rates, demonstrated that the old trees are still in a healthy, mature state, and senescence is not manifested at the whole-plant level. Taken together, our results reveal that long-lived trees have evolved compensatory mechanisms to maintain a balance between growth and aging processes. This involves continued cambial divisions, high expression of resistance-associated genes, and continued synthetic capacity of preformed protective secondary metabolites.

Keywords: Ginkgo biloba; aging; cambium; old trees; senescence.


Conflict of interest statement

The authors declare no competing interest.

Figures

Fig. 1.
Fig. 1.
Phenotypic analysis of G. biloba trees of different ages. (A) Schematic diagram of tree-ring width generated by TSAP-Win software. (B) Increment of tree-ring width every 10 y over 510 y. (C) BAI every 10 y (in square centimeters). (D) Measured tree-ring widths of nine selected trees. (E) Average tree-ring width. The columns and error bars indicate the means and SDs (n = 3). ***P < 0.001. (F) Leaf areas (in square centimeters) of VC20, VC200, and VC600. (G) Germination rates of seeds from VC20, VC200, and VC600. (H) Photoelectric conversion rates (Fv/Fm), (I) photosynthetic capacities (Fv/F0), and (J) relative chlorophyll contents of leaves from VC20, VC200, and VC600. The columns and error bars indicate the means and SDs (n = 3). ns, not significant.
Fig. 2.
Fig. 2.
Structural and physiological analysis of G. biloba cambium. (A) Transverse sections of cambial zones of different ages. Ca, vascular cambium; Ph, phloem; Xy, xylem. (Scale bars, 100 μm.) (B) Number of cambial cell layers. The columns and error bars indicate the means and SDs (n = 3). ***P < 0.001. Changes of IAA (C) and ABA (D) contents. Data are the means of three biological replicates, and the error bars represent SD. ***P < 0.001 and **0.001 < P < 0.01.
Fig. 3.
Fig. 3.
Changes in the expression of genes associated with cell division, cell expansion, and phytohormone signaling in the cambium of trees of different ages. In the heatmaps (AC), the Left grid (red) shows the log10 FPKM value of VC20, and the Right grid the log2 (expression ratio) [log2(VC200A/VC20_mean), log2(VC200B/VC20_mean), log2(VC200C/VC20_mean), log2(VC600A/VC20_mean), log2(VC600B/VC20_mean), log2(VC600C/VC20_mean)]. (D) Expression ratios [log2(VC200/VC20)] and [log2(VC600/VC20)] of selected DEGs as determined by qRT-PCR and deep sequencing. Expression levels of genes related to (E) cell division, (F) IAA signaling, and (G) CTK signaling by qRT-PCR among more ages. The columns and error bars indicate the means and SDs (n = 3). The mean expression levels of these genes are from trees of four age groups (3 and 5 y, 5Y; 20 and 34 y, 20Y; 132, 152, 161, and 211 y, 200Y; and 538, 553, and 667 y, 600Y).
Fig. 4.
Fig. 4.
Network and heatmap analysis of miR166/165 and their targets. (A) Network of miRNA166/165 family members (magenta) and their targets (green). (B) Inverse correlation between the expression of miRNAs and that of their target genes in VC20, VC200, and VC600. The heatmaps are color coded by expression ratios [log2(VC20_mean/VC20_mean), log2(VC200_mean/VC20_mean), log2 (VC600_mean/VC20_mean)]; blue, lower expression; red, higher expression. (C) Target plots show signature abundance at the positions of target transcripts identified by degradome sequencing. Red lines, signatures corresponding to miRNA cleavage sites.
Fig. 5.
Fig. 5.
Old trees lack senescence symptoms. (AC) Heatmaps of changes in the expression of senescence-related transcription factors. The heatmaps are color coded by average expression of VC20, VC200, and VC600 (log10FPKM). (D) Heatmaps of changes in the expression of miR164, miR319, miR156, and miR172. The heatmaps are color coded by expression ratios [log2 (VC20_mean/VC20_mean), log2 (VC200_mean/VC20_mean), log2 (VC600_mean/VC20_mean)]; green, down-regulated miRNAs; orange, up-regulated miRNAs. (E) Boxplot of the expression (log2 [FPKM]) of autophagy-related genes in VC20A, VC20B, VC20C, VC200A, VC200B, VC200C, VC600A, VC600B, and VC600C. Transcript levels of (F) WRKY57 and (G) NAC036 by qRT-PCR among more ages. The columns and error bars indicate the means and SDs (n = 3). The mean transcript levels of these genes are from trees of four age groups (3 and 5 y, 5Y; 20 and 34 y, 20Y; about 132, 152, 161, and 211 y, 200Y; and about 538, 553, and 667 y, 600Y).
Fig. 6.
Fig. 6.
Expression of defense-related genes in trees of different ages. (A) Numbers of LRR genes in VC20, VC200, and VC600. (B) Boxplot of the expression levels [log2 (FPKM)] of LRR genes in VC20A, VC20B, VC20C, VC200A, VC200B, VC200C, VC600A, VC600B, and VC600C. (C) Expression levels of R genes (Gb_05919, Gb_39766, Gb_25801) by qRT-PCR. The columns and error bars indicate the means and SDs (n = 3). Changes in the expression of genes in (D) the PCBRE gene family, (E) the monolignol biosynthesis pathway, (F) the laccase gene family, (G) lignan synthesis, and (H) the flavonoid biosynthesis pathway. The heatmaps are color coded by average expression of VC20, VC200, and VC600 (log10FPKM).
Fig. 7.
Fig. 7.
Schematic representation of the balance between aging and growth. The blue, red, and green boxes represent decreased, increased, and invariant index values in old trees, respectively. (A) Balance diagram; the balance between growth and aging is maintained by decreased cambium activity. (B and C) Old G. biloba trees lack senescence symptoms. (D) Resistance mechanisms delay senescence in old trees. The color gradation shows the values of indices. (E) Variation in growth rate, senescence symptoms, and the resistance ability with age.

References

    1. Munné-Bosch S., Ageing in perennials. Crit. Rev. Plant Sci. 26, 123–138 (2007).
    1. Thomas H., Senescence, ageing and death of the whole plant. New Phytol. 197, 696–711 (2013). - PubMed
    1. Schippers J.-H., Transcriptional networks in leaf senescence. Curr. Opin. Plant Biol. 27, 77–83 (2015). - PubMed
    1. Kim H.-J., Nam H.-G., Lim P.-O., Regulatory network of NAC transcription factors in leaf senescence. Curr. Opin. Plant Biol. 33, 48–56 (2016). - PubMed
    1. Spicer R., Groover A., Evolution of development of vascular cambia and secondary growth. New Phytol. 186, 577–592 (2010). - PubMed

Publication types