. 2020 Feb;31(2):257-278.
doi: 10.1681/ASN.2019040419. Epub 2020 Jan 13.

The Kidney Contains Ontogenetically Distinct Dendritic Cell and Macrophage Subtypes throughout Development That Differ in Their Inflammatory Properties

Affiliations

The Kidney Contains Ontogenetically Distinct Dendritic Cell and Macrophage Subtypes throughout Development That Differ in Their Inflammatory Properties

Natallia Salei et al. J Am Soc Nephrol. 2020 Feb.

Abstract

Background: Mononuclear phagocytes (MPs), including macrophages, monocytes, and dendritic cells (DCs), are phagocytic cells with important roles in immunity. The developmental origin of kidney DCs has been highly debated because of the large phenotypic overlap between macrophages and DCs in this tissue.

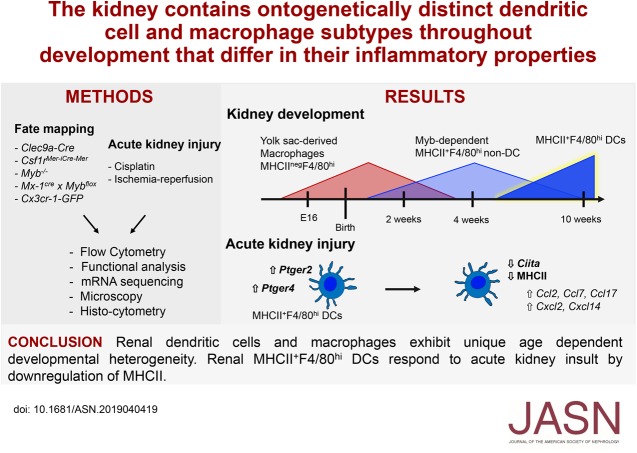
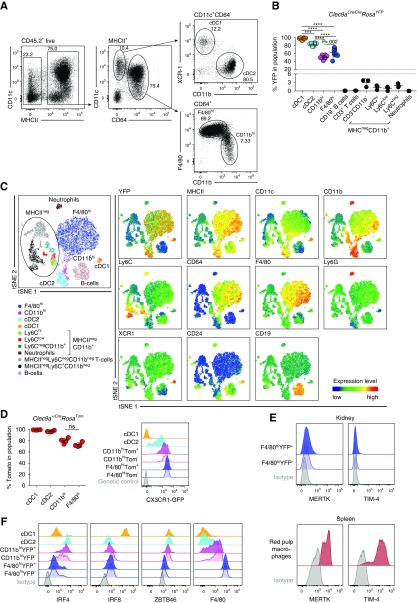
Methods: We used fate mapping, RNA sequencing, flow cytometry, confocal microscopy, and histo-cytometry to assess the origin and phenotypic and functional properties of renal DCs in healthy kidney and of DCs after cisplatin and ischemia reperfusion-induced kidney injury.

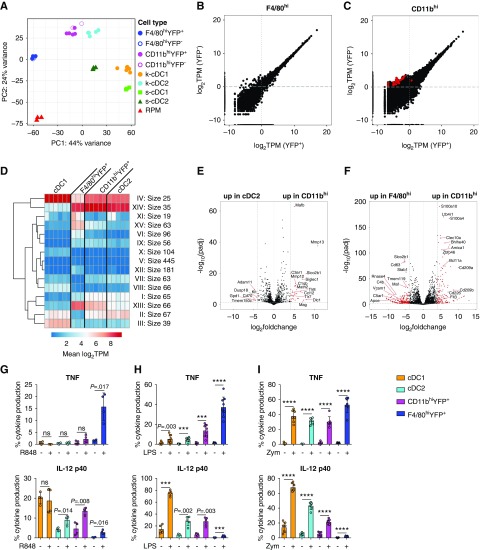
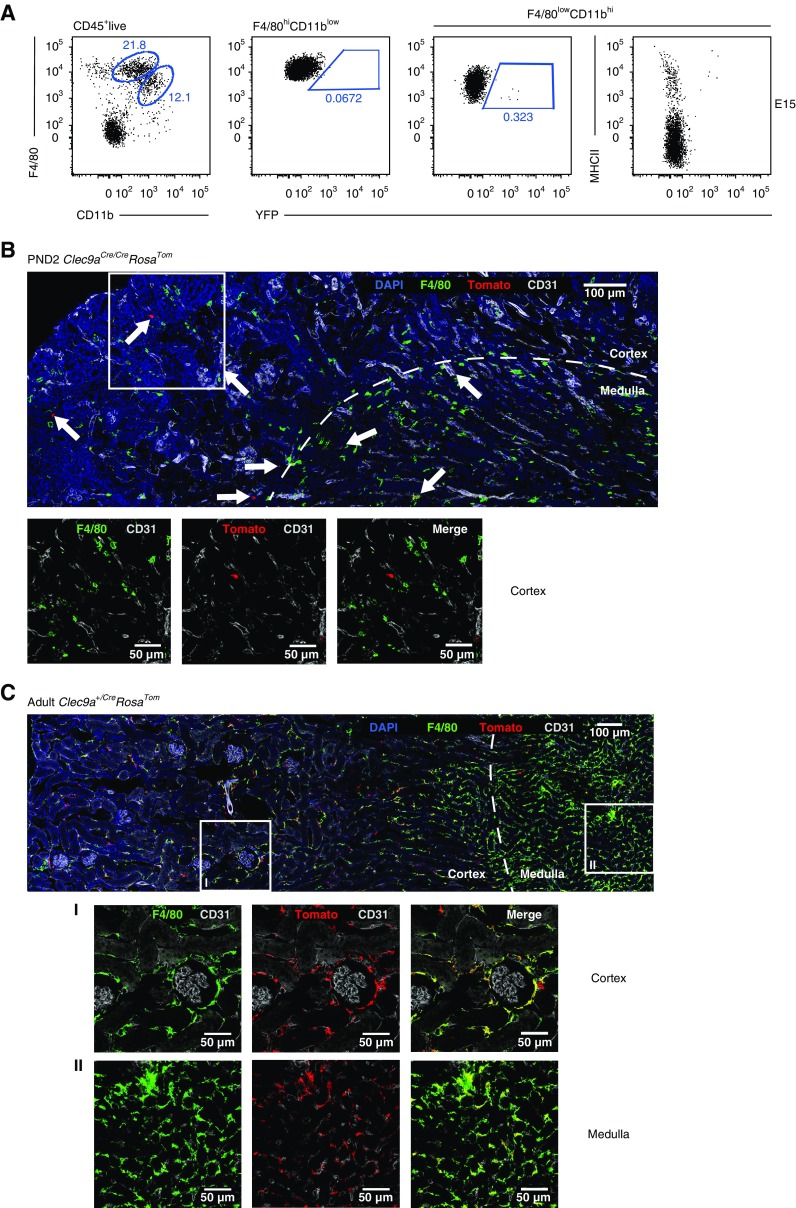
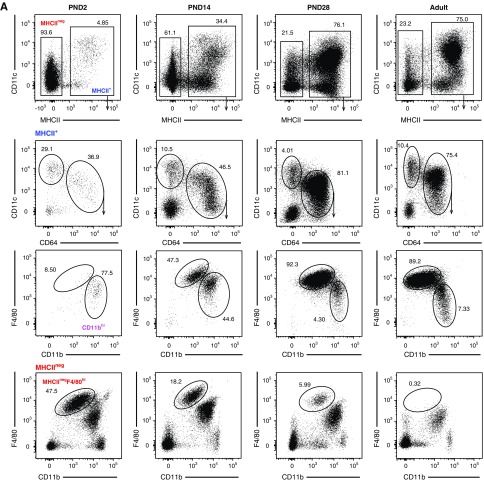
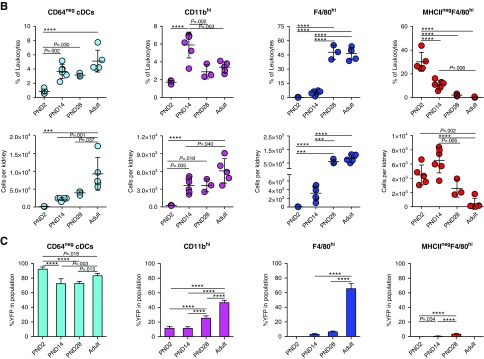
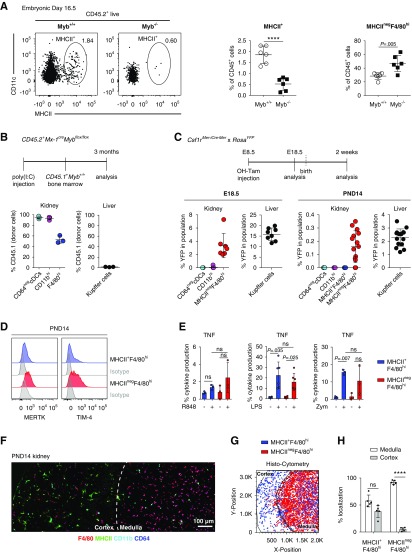
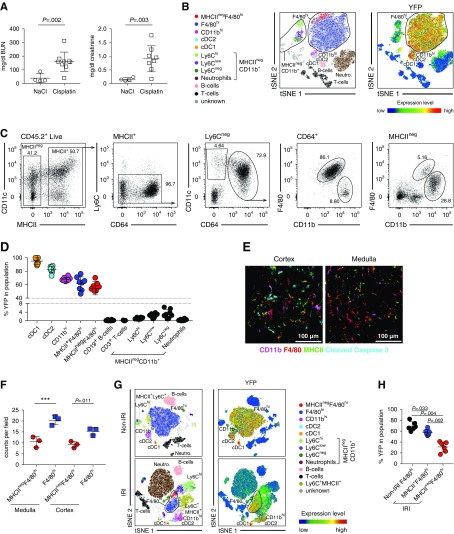
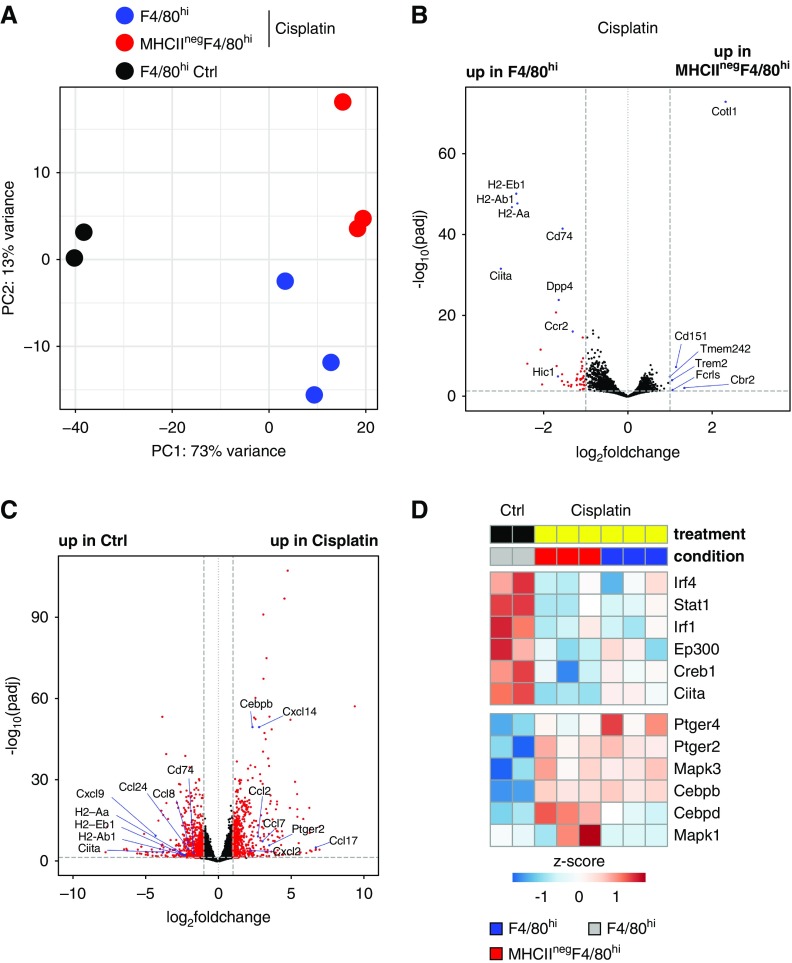
Results: Adult kidney contains at least four subsets of MPs with prominent Clec9a-expression history indicating a DC origin. We demonstrate that these populations are phenotypically, functionally, and transcriptionally distinct from each other. We also show these kidney MPs exhibit unique age-dependent developmental heterogeneity. Kidneys from newborn mice contain a prominent population of embryonic-derived MHCIInegF4/80hiCD11blow macrophages that express T cell Ig and mucin domain containing 4 (TIM-4) and MER receptor tyrosine kinase (MERTK). These macrophages are replaced within a few weeks after birth by phenotypically similar cells that express MHCII but lack TIM-4 and MERTK. MHCII+F4/80hi cells exhibit prominent Clec9a-expression history in adulthood but not early life, indicating additional age-dependent developmental heterogeneity. In AKI, MHCIInegF4/80hi cells reappear in adult kidneys as a result of MHCII downregulation by resident MHCII+F4/80hi cells, possibly in response to prostaglandin E2 (PGE2). RNA sequencing further suggests MHCII+F4/80hi cells help coordinate the recruitment of inflammatory cells during renal injury.

Conclusions: Distinct developmental programs contribute to renal DC and macrophage populations throughout life, which could have important implications for therapies targeting these cells.

Keywords: acute kidney injury; dendritic cell; hematopoiesis; immunology; kidney development; macrophages.


Figures

None
Graphical abstract
Figure 1.
Figure 1.
The adult kidney contains four phenotypically distinct subsets of MPs with Clec9a-expression history. (A–C) Kidney leukocytes from 10- to 12-week-old Clec9acre/creRosaYFP mice were analyzed by flow cytometry. (A) Live CD45.2+ MHCII+ cells were gated as indicated and subdivided into CD11c+CD64 and CD64+ cells. CD11c+CD64 cells were further analyzed for XCR-1 and CD11b expression to identify cDC1s and cDC2s, respectively. CD64+ cells were further divided into F4/80hi and CD11bhi cells. (B) The percentage of YFP+ cells in the indicated populations (see also Supplemental Figure 1A) is shown. (C) Representative t-distributed stochastic neighbor embedding (tSNE) of kidney leukocytes. Cells were clustered independently of their YFP labeling and manually gated populations were overlaid on the tSNE plot in the indicated colors. Blue-to-red gradient indicates increasing intensity of marker expression. (D) Left panel shows the percentage of tomato+ cells in each population; right panel, CX3CR-1-GFP expression in cDC1s, cDC2s, as well as F4/80hi and CD11bhi cells, further divided into tomato+ and tomato cells. Gray traces represent GFP fluorescence in control mice lacking the CX3CR-1-GFP allele. (E) Renal YFP+ and YFP F4/80hi cells were analyzed for MERTK and TIM-4 expression by flow cytometry. Expression of these markers on splenic RPMs is shown as positive control. (F) Renal cDC1s, cDC2s, YFP+ and YFP F4/80hi cells, as well as YFP+ and YFP CD11bhi cells from Clec9acre/creRosaYFP mice were analyzed for IRF4, IRF8, ZBTB46, and F4/80 expression. Gray traces represent staining with isotype-matched control antibodies. (B–D) Each dot represents one mouse, horizontal bars represent mean, error bars represent SD. ***P<0.001, ****P<0.0001.
Figure 2.
Figure 2.
Renal F4/80hi are transcriptionally distinct from cDC1s, cDC2s, and CD11bhi cells. (A–F) YFP+ and YFP fractions of F4/80hi and CD11bhi cells as well as YFP+ cDC1s and YFP+ cDC2s were sorted from kidneys of adult Clec9acre/creRosaYFP mice. Splenic YFP+ cDC1s, YFP+ cDC2s, and RPMs were isolated as reference populations from the same mice. Sorted populations were subjected to mRNA-sequencing analysis. (A) PCA of the top 500 genes as defined by the highest variance across all samples. Each dot of the same color represents a biologic replicate. (B and C) Comparison of gene expression in (B) YFP+ and YFP F4/80hi cells and (C) YFP+ and YFP CD11bhi cells displayed as transcripts per kilobase million (TPM) reads. Red circles indicate genes with a log2 fold change greater than four between samples and an adjusted P (padj)<0.05. (D) k-means clustering of differentially expressed genes (log2 fold change>4; adjusted P<0.05) between renal cDC1s, cDC2s, YFP+ CD11bhi cells, and YFP+ F4/80hi cells. (E and F) Pairwise comparison of (E) cDC2s with YFP+ CD11bhi cells or (F) YFP+ F4/80hi with YFP+ CD11bhi cells was performed on RNA-seq data using the DEseq2 plugin in R. Red circles indicate genes with a log2 fold change greater than four between samples and an adjusted P value <0.05. (G–I) Renal leukocytes from adult Clec9acre/creRosaYFP mice were isolated and stimulated in vitro with (G) R848, (H) LPS, or (I) zymosan (Zym) for 6 hours. Intracellular levels of TNF and IL-12 p40 were analyzed by flow cytometry. Each dot represents one mouse, error bars represent SD. ***P<0.001, ****P<0.0001.
Figure 3.
Figure 3.
Embryonic macrophages do not show Clec9a-Cre expression history. (A) Kidneys from Clec9acre/creRosaYFP mice were isolated at E15 and analyzed for F4/80 and CD11b expression by flow cytometry to identify F4/80hi YS-derived macrophages and CD11bhiF4/80low cells. Populations were further analyzed for YFP and MHCII expression. (B and C) Immunofluorescence staining of kidneys from Clec9acreRosaTom mice (B) at PND2 and (C) at 10 weeks of age. Kidney sections were stained for the following markers: tomato (red), F4/80 (green), CD31 (gray), and DAPI (blue). Deconvoluted confocal tile scans were generated. (B) Arrows indicate tomato+ cells. Scale bar, 100 µm. Square marks the inset that is magnified below the tile scan to indicate absence of F4/80 signal on tomato+ cells. (C) Squares mark magnified areas of (I) the cortex or (II) the medulla that are shown below the tile scan image (scale bar, 50 µm) to indicate colocalization of F4/80 and tomato signal.
Figure 4.
Figure 4.
Renal MP populations exhibit dynamic age-dependent changes. (A–C) Kidneys isolated from Clec9acre/creRosaYFP mice on PND2, PND14, PND28, and 10–12 weeks after birth were analyzed by flow cytometry. (A) Cells were first gated on live CD45.2+ cells and further subdivided into MHCIIneg and MHCII+ cells (top row). MHCII+ cells were further analyzed for CD11c and CD64 expression (second row). MHCII+CD64+ cells (third row) and MHCIIneg cells (bottom row) were further analyzed for CD11b and F4/80 expression. (B) Frequency and total number of kidney CD64 cDCs, CD11bhi, F4/80hi and MHCIInegF4/80hi cells at the indicated ages are shown. (C) Percentage of YFP+ cells in each population from Clec9acre/creRosaYFP mice at the indicated ages. Each dot represents one mouse, horizontal lines indicate mean, error bars represent SD. ***P<0.001, ****P<0.0001, only statistically significant differences are marked.
Figure 4.
Figure 4.
Renal MP populations exhibit dynamic age-dependent changes. (A–C) Kidneys isolated from Clec9acre/creRosaYFP mice on PND2, PND14, PND28, and 10–12 weeks after birth were analyzed by flow cytometry. (A) Cells were first gated on live CD45.2+ cells and further subdivided into MHCIIneg and MHCII+ cells (top row). MHCII+ cells were further analyzed for CD11c and CD64 expression (second row). MHCII+CD64+ cells (third row) and MHCIIneg cells (bottom row) were further analyzed for CD11b and F4/80 expression. (B) Frequency and total number of kidney CD64 cDCs, CD11bhi, F4/80hi and MHCIInegF4/80hi cells at the indicated ages are shown. (C) Percentage of YFP+ cells in each population from Clec9acre/creRosaYFP mice at the indicated ages. Each dot represents one mouse, horizontal lines indicate mean, error bars represent SD. ***P<0.001, ****P<0.0001, only statistically significant differences are marked.
Figure 5.
Figure 5.
MHCII+ cells in the kidney are Myb dependent and do not arise from embryonic progenitors. (A) Kidneys from Myb−/− and wild-type littermate control mice were analyzed by flow cytometry on E16.5. Left: CD11c and MHCII expression of live CD45.2+ cells in mouse embryos of the indicated genotype is shown. Right: The frequency of MHCII+ and MHCIInegF4/80hi cells among live CD45.2+ cells is shown. (B) CD45.2+Mx-1creMybflox/flox were treated with serial polyI:C injections to induce deletion of HSCs and subsequently transplanted with bone marrow from congenic CD45.1+ wild-type mice. The percentage of donor-derived CD45.1+ cells in the indicated populations in the liver and kidney is shown. (C) Csf1rMer-iCre-Mer females were mated with male Rosa+/YFP mice and injected with 4-hydroxytamoxifen (OH-TAM) on E8.5. On E18.5 and 2 weeks after birth, kidneys and liver from offspring mice were analyzed for YFP expression by flow cytometry. Renal populations were identified as in Figure 4A. Liver Kupffer cells were identified as live CD45.2+F4/80hi cells. The percentage of YFP-positive cells in the indicated populations in kidneys and liver is shown. (D) Renal MHCII+F4/80hi and MHCIInegF4/80hi cells from 2-week-old mice were analyzed for MERTK and TIM-4 expression by flow cytometry. Gray traces represent staining with isotype-matched control antibodies. (E) Renal leukocytes from 2-week-old mice were stimulated in vitro with R848, LPS, or zymosan (Zym) for 6 hours and analyzed for intracellular TNF production by flow cytometry. The frequency of TNF-positive MHCII+F4/80hi and MHCIInegF4/80hi cells was calculated and plotted. (F–H) Kidney sections from two-week-old Clec9acreRosaTom mice were analyzed by histo-cytometry. (F) Immunofluorescence image of the following markers: F4/80 (red), MHCII (green), CD11b (magenta), and CD64 (blue). Scale bar, 100 µm. (G) Histo-cytometry was used to identify the x and y position of MHCIInegF4/80hi and MHCII+F4/80hi cells in the kidney sections. Lines separating renal medulla and cortex were drawn by hand based on tissue structure, autofluorescence properties, and presence of glomeruli. (H) The frequency of MHCIIneg F4/80hi and MHCII+F4/80hi cells located in the renal cortex and medulla was quantified using gates on the renal cortex or medulla in histo-cytometry analysis and plotted. Each dot represents one mouse. Horizontal bars represent mean, error bars represent SD. ****P<0.0001.
Figure 6.
Figure 6.
Renal MHCIInegF4/80hi cells appear in adult kidneys after cisplatin and ischemia-induced AKI due to a phenotypic switch of MHCII+F4/80hi cells. (A–D) Clec9acre/creRosaYFP mice, 10 weeks of age, were injected i.p. with 15 mg/kg cisplatin and analyzed 72 hours later. (A) Serum creatinine and BUN levels are shown. (B–D) Kidney leukocytes from cisplatin-treated Clec9acre/creRosaYFP mice were analyzed by flow cytometry. (B) Representative tSNE analysis of kidney leukocytes 3 days after cisplatin treatment. Left panel: Cells were clustered independently of YFP labeling and manually gated populations were overlaid on the tSNE plot in the indicated colors. Right panel: The intensity of YFP expression in the indicated populations. Blue-to-red gradient indicates level of marker expression. (C and D) CD45.2+ cells were subdivided into MHCIIneg and MHCII+ cells. MHCII+ cells were further analyzed for CD11c and CD64 expression. After exclusion of Ly6Cneg cells, MHCII+CD64+ cells (first row) and MHCIIneg cells (second row) were further analyzed for CD11b and F4/80 expression. (D) The percentage of YFP+ labeling in the indicated renal leukocyte populations from cisplatin-treated mice is shown. (E) Kidney sections from cisplatin-treated mice were analyzed by immunofluorescence microscopy for the following markers: CD11b (magenta), F4/80 (red), MHCII (green), and cleaved caspase-3 (cyan). Representative cutouts of renal cortex and medulla are shown. Scale bar, 100 µm. (F) Quantification of MHCII+F4/80hi and MHCIInegF4/80hi cells in the renal cortex and medulla in cisplatin-treated mice. Each dot represents the average amount of cells per field from one biologic replicate. (G and H) FACS analysis of renal leukocytes from Clec9acre/creRosaYFP mouse 72 hours after unilateral ischemia-reperfusion injury. (G) Representative tSNE analyses of kidney leukocytes from ischemic and nonischemic control kidneys. Left panel: Cells were clustered independently of YFP labeling and manually gated populations were overlaid on the tSNE plot in the indicated colors. Right panel: YFP expression in the indicated populations. Blue-to-red gradient indicates increasing intensity of marker expression. (H) The percentage of YFP+ cells in renal MHCII+F4/80hi cells from nonischemic control kidneys and MHCIIneg and MHCII+F4/80hi cells from ischemic kidneys is shown. Each dot represents one mouse. Horizontal bars represent mean, error bars represent SD. ***P<0.001. IRI, ischemic-reperfusion injury; NaCl, sodium chloride.
Figure 7.
Figure 7.
Renal F4/80hi cells downregulate MHCII expression and induce inflammatory chemokine expression in response to cisplatin treatment. At 72 hours after cisplatin treatment, MHCII+F4/80hi and MHCIInegF4/80hi cells were sorted from 10-week-old C57BL/6J mice and subjected to mRNA-sequencing analysis. As control (Ctrl), MHCII+F4/80hi cells were sorted from sodium chloride–injected mice. (A) PCA of the top 5000 genes with highest variance across all samples. Each dot of the same color represents a biologic replicate. (B) Pairwise comparison of MHCII+F4/80hi and MHCIInegF4/80hi populations from cisplatin-treated mice. (C) Pairwise comparison of F4/80hi populations from control and cisplatin-treated mice independent of MHCII expression. Red circles indicate genes with a log2 fold change greater than one between samples and an adjusted P (padj) value of <0.05. (D) Heatmap of genes implicated in inducing (upper block) or repressing (lower block) MHCII expression.

Comment in

References

    1. Guilliams M, Ginhoux F, Jakubzick C, Naik SH, Onai N, Schraml BU, et al. .: Dendritic cells, monocytes and macrophages: A unified nomenclature based on ontogeny. Nat Rev Immunol 14: 571–578, 2014 - PMC - PubMed
    1. Merad M, Sathe P, Helft J, Miller J, Mortha A: The dendritic cell lineage: Ontogeny and function of dendritic cells and their subsets in the steady state and the inflamed setting. Annu Rev Immunol 31: 563–604, 2013 - PMC - PubMed
    1. Murphy TL, Grajales-Reyes GE, Wu X, Tussiwand R, Briseño CG, Iwata A, et al. .: Transcriptional control of dendritic cell development. Annu Rev Immunol 34: 93–119, 2016 - PMC - PubMed
    1. Mildner A, Yona S, Jung S: A close encounter of the third kind: Monocyte-derived cells. Adv Immunol 120: 69–103, 2013 - PubMed
    1. Ginhoux F, Jung S: Monocytes and macrophages: Developmental pathways and tissue homeostasis. Nat Rev Immunol 14: 392–404, 2014 - PubMed

Publication types

MeSH terms