. 2020 Jan 13;11(1):228.
doi: 10.1038/s41467-019-13995-5.

Antimicrobial resistant enteric bacteria are widely distributed amongst people, animals and the environment in Tanzania

Affiliations

Antimicrobial resistant enteric bacteria are widely distributed amongst people, animals and the environment in Tanzania

Murugan Subbiah et al. Nat Commun. .

Abstract

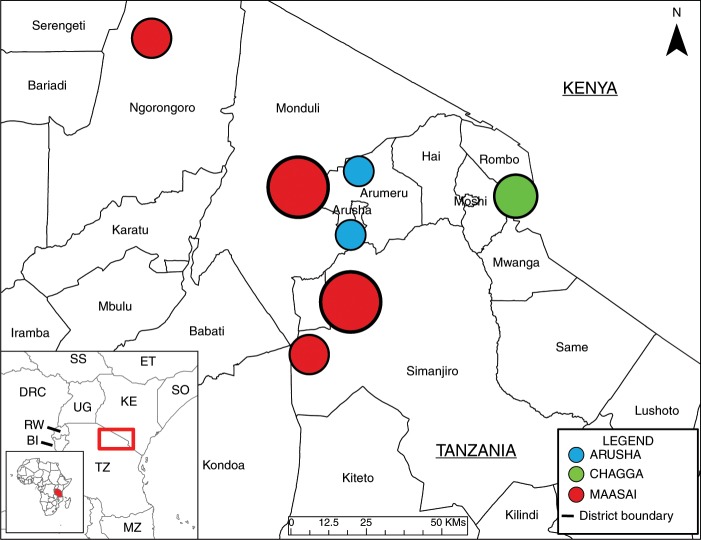
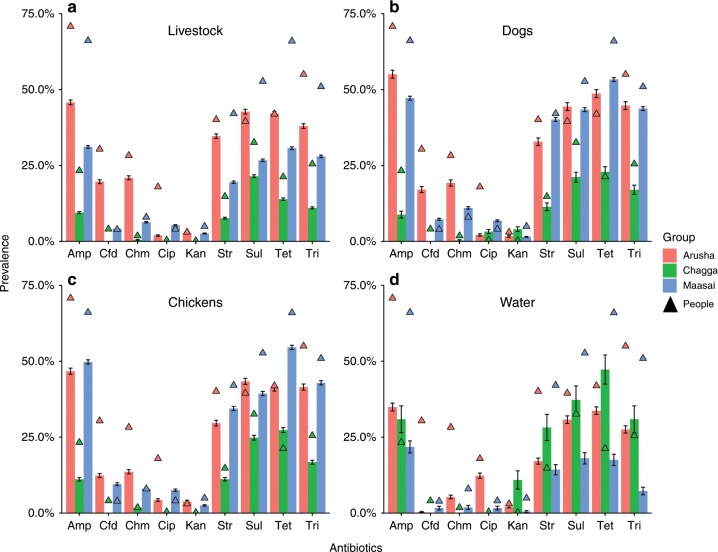
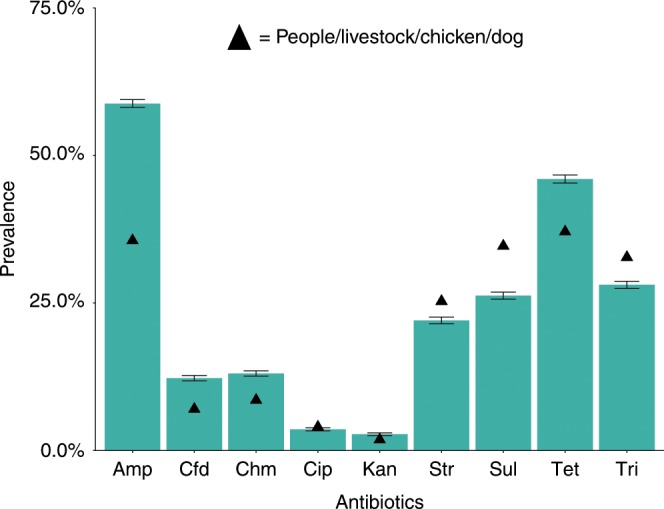
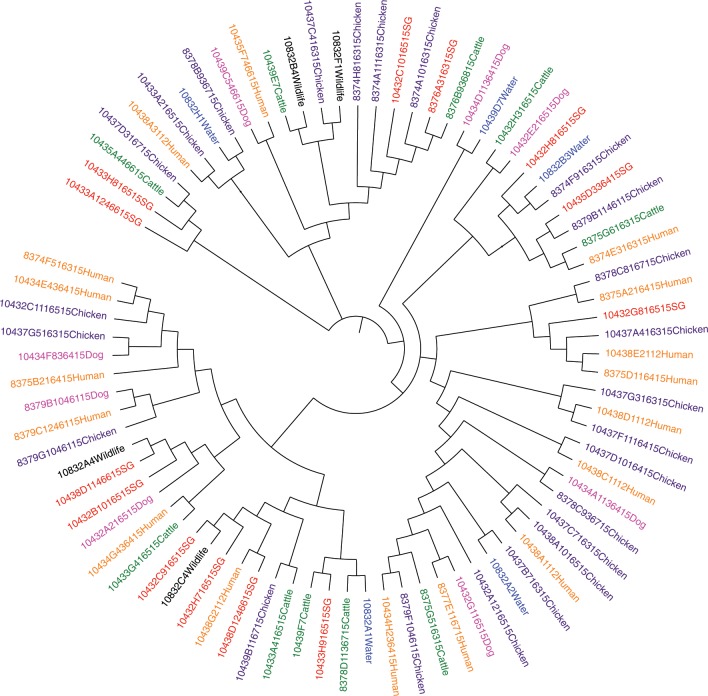
Antibiotic use and bacterial transmission are responsible for the emergence, spread and persistence of antimicrobial-resistant (AR) bacteria, but their relative contribution likely differs across varying socio-economic, cultural, and ecological contexts. To better understand this interaction in a multi-cultural and resource-limited context, we examine the distribution of antimicrobial-resistant enteric bacteria from three ethnic groups in Tanzania. Household-level data (n = 425) was collected and bacteria isolated from people, livestock, dogs, wildlife and water sources (n = 62,376 isolates). The relative prevalence of different resistance phenotypes is similar across all sources. Multi-locus tandem repeat analysis (n = 719) and whole-genome sequencing (n = 816) of Escherichia coli demonstrate no evidence for host-population subdivision. Multivariate models show no evidence that veterinary antibiotic use increased the odds of detecting AR bacteria, whereas there is a strong association with livelihood factors related to bacterial transmission, demonstrating that to be effective, interventions need to accommodate different cultural practices and resource limitations.


Conflict of interest statement

The authors declare no competing interests.

Figures

Fig. 1
Fig. 1. Map of study area and areas surveyed.
Arusha = 103 households, Chagga = 101 households, and Maasai = 201 households. Maps were created using ArcGIS software by Esri. The base map is sourced from Esri and modified in ArGIS Pro. “Light Gray Canvas” [basemap] https://www.arcgis.com/home/item.html?id=ee8678f599f64ec0a8ffbfd5c429c896. 30 October 2019.
Fig. 2
Fig. 2. Prevalence of antimicrobial resistant bacteria in people, animals, and water.
Bacteria isolated from fecal samples collected from Maasai, Arusha, and Chagga people (n = 11,287 isolates) and animals (n = 43,691 isolates) and water samples (n = 1934 isolates). Antibiotics included amp (a mpicillin), cfd (ceftazidime), chm (chloramphenicol), cip (ciprofloxacin), and kan (kanamycin), str (streptomycin), sul (sulfamethoxazole), tet (tetracycline), tri (trimethoprim). Error bars are 95% standard errors.
Fig. 3
Fig. 3. Prevalence of antimicrobial-resistant bacteria in wildlife.
Bacteria isolated from fecal samples collected from wildlife (n = 5464 isolates) compared to mean prevalence of resistance from people/livestock/chicken/dog combined (triangles; n = 54,978 isolates). Wildlife fecal samples were opportunistically collected from wildebeest (Connochaetes taurinus), zebra (Equus quagga), impala (Aepyceros melampus), giraffe (Giraffa camelopardalis), elephant (Loxodonta africana), gazelle (Eudorcas thomsonii), dik-dik (Madokua kirkii), and buffalo (Syncerus caffer). Antibiotics included amp (ampicillin), cfd (ceftazidime), chm (chloramphenicol), cip (ciprofloxacin), and kan (kanamycin), str (streptomycin), sul (sulfamethoxazole), tet (tetracycline), tri (trimethoprim). Error bars are 95% standard errors.
Fig. 4
Fig. 4. Minimum spanning tree for E. coli MLVA haplotypes.
Each circle or pie-slice represents a single E. coli isolate from people or animal. Most of the isolates differed by a single locus (solid lines) and no host-specific clustering was apparent. Sample sizes are people (n = 99), livestock (n = 68), dog (n = 94), chicken (n = 63), wildlife (n = 90), water (n = 136).
Fig. 5
Fig. 5. Phylogenetic tree derived from 81 E. coli isolates.
Isolates were collected from eight selected Maasai households and also include wildlife and waters isolates. No clustering of isolates was apparent based on host species or households. Labels show barcode id, house id, year of collection, and host name (e.g. 10435D5466Human; 10435D5—barcode id, 466—household id, and Human—host species).

References

    1. Van Boeckel TP, et al. Global trends in antimicrobial use in food animals. Proc. Natl Acad. Sci. 2015;112:5649. doi: 10.1073/pnas.1503141112. - DOI - PMC - PubMed
    1. World Health Organization. Global action plan on antimicrobial resistance. (2015). - PubMed
    1. Ventola CL. The antibiotic resistance crisis: part 1: causes and threats. Pharm. Ther. 2015;40:277. - PMC - PubMed
    1. Levy SB, Marshall B. Antibacterial resistance worldwide: causes, challenges and responses. Nat. Med. 2004;10:S122–S129. doi: 10.1038/nm1145. - DOI - PubMed
    1. Heuer H, Schmitt H, Smalla K. Antibiotic resistance gene spread due to manure application on agricultural fields. Curr. Opin. Microbiol. 2011;14:236–243. doi: 10.1016/j.mib.2011.04.009. - DOI - PubMed

Publication types

MeSH terms

Substances