. 2020 Jan 13;11(1):230.
doi: 10.1038/s41467-019-14045-w.

Annexin-V stabilizes membrane defects by inducing lipid phase transition

Affiliations

Annexin-V stabilizes membrane defects by inducing lipid phase transition

Yi-Chih Lin et al. Nat Commun. .

Abstract

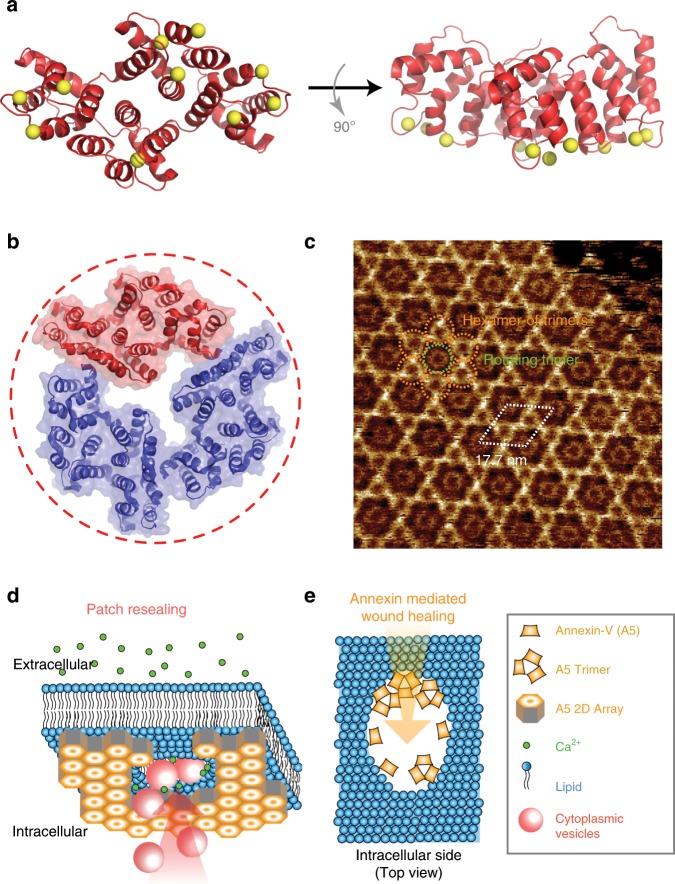
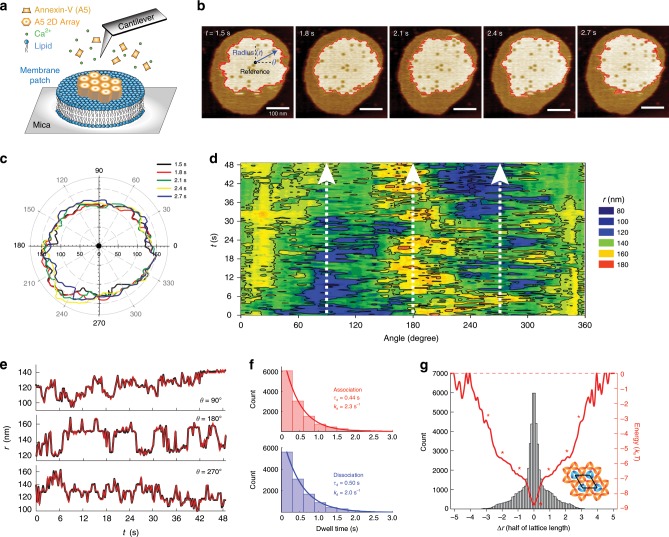
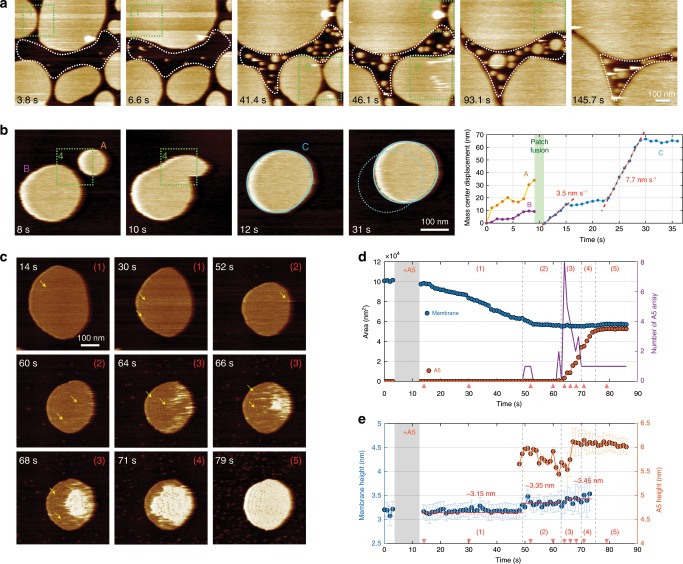
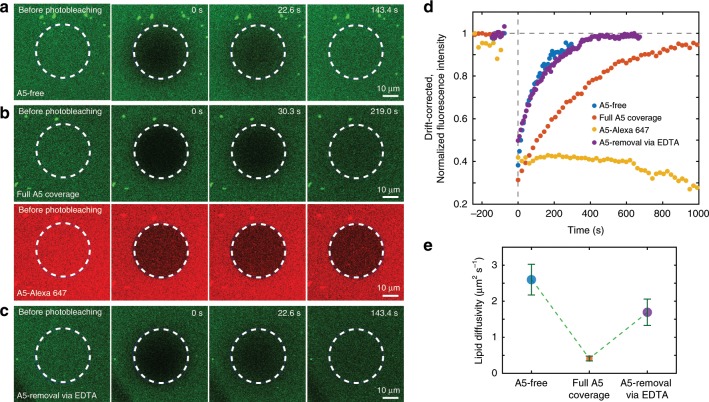
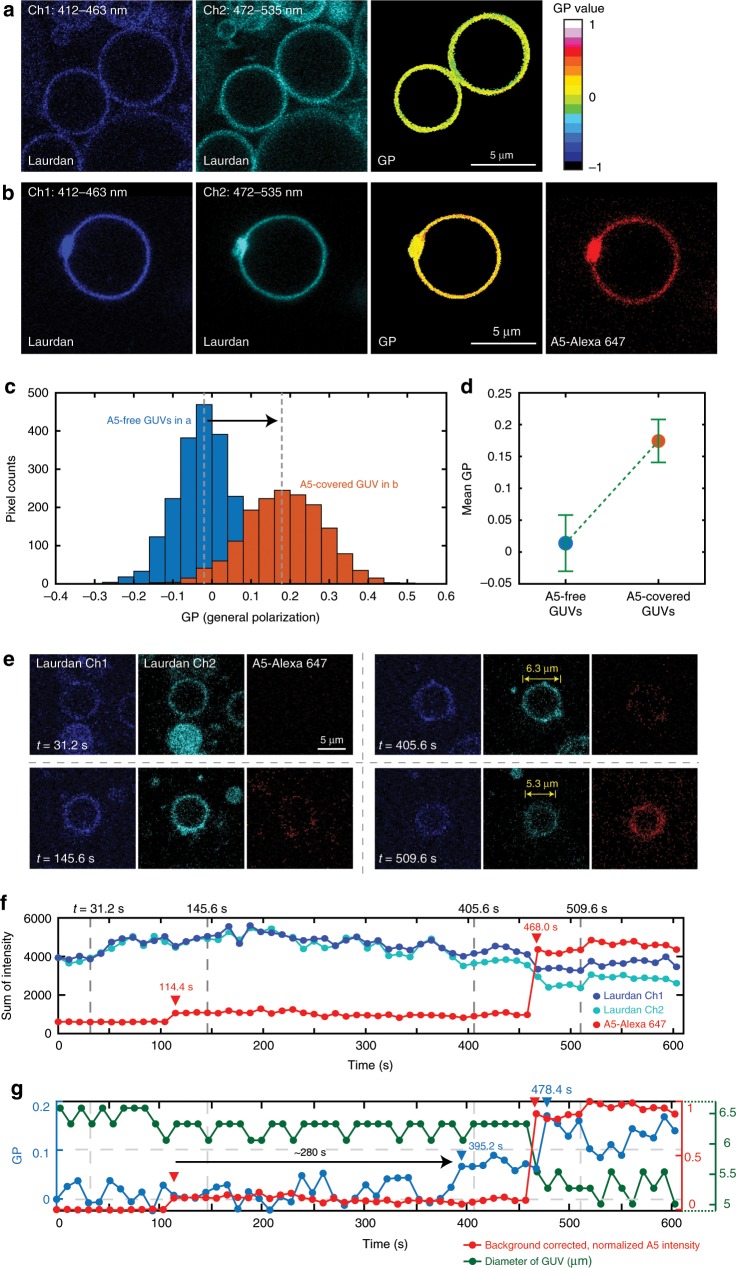
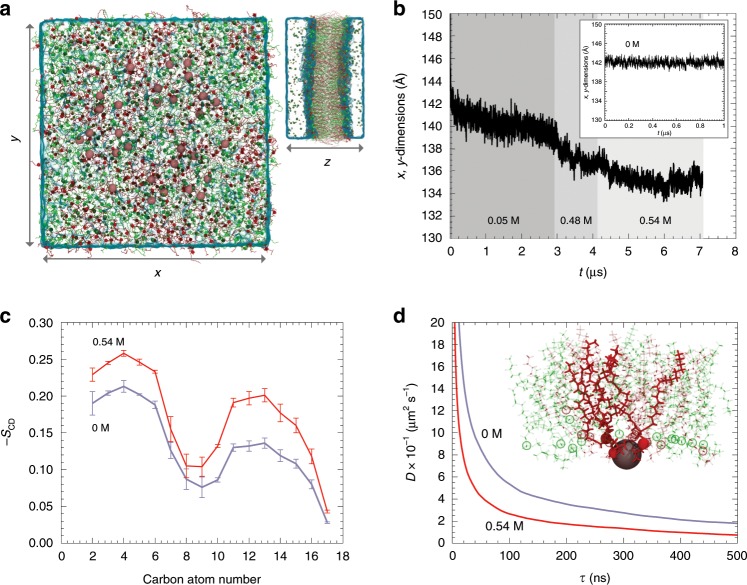
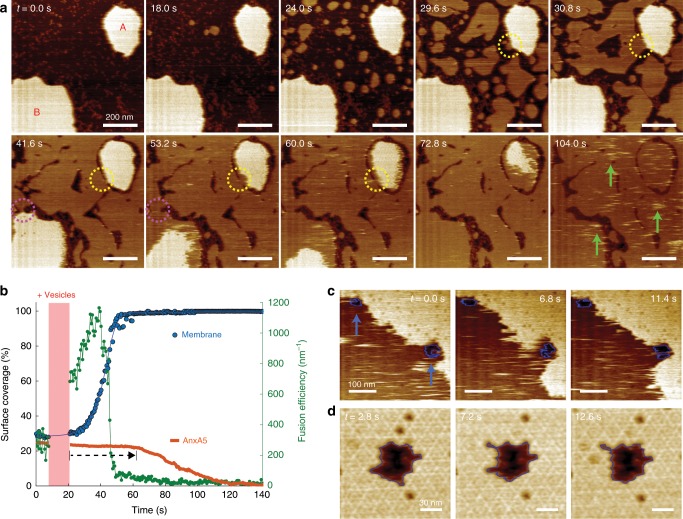
Annexins are abundant cytoplasmic proteins, which bind to membranes that expose negatively charged phospholipids in a Ca2+-dependent manner. During cell injuries, the entry of extracellular Ca2+ activates the annexin membrane-binding ability, subsequently initiating membrane repair processes. However, the mechanistic action of annexins in membrane repair remains largely unknown. Here, we use high-speed atomic force microscopy (HS-AFM), fluorescence recovery after photobleaching (FRAP), confocal laser scanning microscopy (CLSM) and molecular dynamics simulations (MDSs) to analyze how annexin-V (A5) binds to phosphatidylserine (PS)-rich membranes leading to high Ca2+-concentrations at membrane, and then to changes in the dynamics and organization of lipids, eventually to a membrane phase transition. A5 self-assembly into lattices further stabilizes and likely structures the membrane into a gel phase. Our findings are compatible with the patch resealing through vesicle fusion mechanism in membrane repair and indicate that A5 retains negatively charged lipids in the inner leaflet in an injured cell.


Conflict of interest statement

The authors declare no competing interests.

Figures

Fig. 1
Fig. 1. Structure, supramolecular assembly, and proposed membrane-repair mechanisms of A5.
a Bottom view (left) and side view (right) of A5 structure (PDB: 1A8A) with bound Ca2+ (yellow spheres). The membrane-facing side of the protein is slightly convex (right). b Top-view of A5 trimer, one monomer is colored as in a. c High-resolution HS-AFM image of A5 lattice on a PS-rich membrane. The lattice consists of hexamers-of-trimers (p6-trimers) forming a honeycomb pattern; in the center of each honeycomb resides an A5 trimer that displays rotational freedom (non-p6-trimer). The unit cell (a = b = 17.7 nm, γ = 60°; white dashed rhomboid) houses 2 p6-trimers and 1 non-p6-trimer. d, e Proposed membrane-repair mechanisms: patch resealing (d) suggests that the formation of A5 2D-lattices, triggered by the Ca2+ influx, stabilizes the membrane near lesions, followed by membrane resealing through fusion of intracellular vesicles. Annexin-mediated resealing (e) proposes that A5 assemblies along the edge of lesions provides local surface tension leading to membrane fusion.
Fig. 2
Fig. 2. A5 association and dissociation kinetics to and from a 2D-lattice.
a Schematic of the experimental setup. Membrane patches (DOPC/DOPS 50:50) are deposited on a mica sample support. The fluid cell contains HEPES buffer (pH 7.4) supplemented with 2 mM Ca2+. After addition of A5 to the fluid cell, HS-AFM observes the formation of A5 2D-lattices on membrane patches. b HS-AFM image frames (Supplementary Movie 1) showing that the borders of finite A5-lattices are dynamic. HS-AFM movie acquisition speed: 0.3 s per frame. c Time-lapse series (lines of different colors) of 2D-lattice boarder in polar coordinates. The reference point is the center of mass of the A5 lattice in the first panel of b. d Angle(θ)–time(t) map of A5 2D-lattice border radius (r). The false color scale represents varying radius from the lattice center to the edge. e Kymographs of A5 2D-lattice leading-edge radius at specific angle (white dashed lines in d). The red curves represent the idealized traces used for dwell-time analysis. f Dwell-time analysis of the association and dissociation kinetics at the leading edges of the A5 2D-lattice. g Histogram of the leading-edge radius change. The x-axis is scaled to half of the lattice unit cell length, 8.85 nm, corresponding to the lattice extension/decrease through association/dissociation of one A5 trimer. Each p6 unit cell contains two lattice A5 trimers. The relative energy diagram of A5 2D-lattice association and dissociation (red line) is estimated by N/N0 = exp(∆G/kBT), where N0 is the occurred events for ∆r = 0. The zero-energy level is defined at the positions without occurrence.
Fig. 3
Fig. 3. A5 2D-lattice growth alters the characteristics of the underlying lipid membrane.
a HS-AFM image frames (Supplementary Movie 2) showing the efficient formation of a supported lipid bilayer (SLB) membrane on mica through vesicle adsorption and spreading (white dashed outlined) and patch fusion (green dashed rectangles). b In the absence of additional vesicles deposited from buffer, the fusion of two small membrane patches can produce a new larger membrane patch that has freedom in surface diffusivity (Supplementary Movie 3). Right graph panel: movement estimated by mass center displacement through fusion process and surface diffusion. c HS-AFM image sequence from a longer HS-AFM movie (acquisition speed: 1 s per frame, Supplementary Movie 4) showing membrane-patch size decrease during A5 adsorption, self-assembly, and 2D-lattice growth. Yellow arrows indicate fast-diffusive, small A5 aggregates. d Time-lapse analysis of area and the number of A5 arrays (minimum size ≥ 200 nm2). Red arrows indicate the time of representative HS-AFM frames shown in c. Based on the changes in membrane area, A5 coverage, and A5-aggregate number, five distinct periods during the A5 self-assembly process are identified as following: (1) membrane shrinkage upon A5 addition, (2) A5 self-assembly into small A5 aggregates, (3) abundant A5 adsorption and coalescence of A5 aggregates in a large-scale 2D-lattice, (4) growth of a 2D-lattice until the membrane was fully covered, and (5) a solid A5-protective membrane. The assigned periods in d are labeled in the top-right corner of corresponding images in c. e Time-lapse analysis of mean height above the mica plane of the membrane patch and A5 aggregates. Each data point is the difference between centers Gaussian fits of the height distributions of the mica, the membrane, and the A5 with the error bar determined by the peak width of the Gaussian fit of the membrane/A5 height distribution (Supplementary Fig. 1). The thickness of bare membrane and A5-covered membrane are 3.15 ± 0.2 nm and 6.1 ± 0.2 nm, respectively. The A5 self-assembly process promotes an average membrane thickness increase to 3.35 ± 0.2 nm and 3.45 ± 0.3 nm during period (2) and (3), respectively. Detailed comparison among height histograms is provided in Supplementary Fig. 1.
Fig. 4
Fig. 4. A5 2D-lattice modulates the diffusivity of underlying lipids.
ac Consecutive fluorescence recovery after photobleaching (FRAP) experiments on SLB membrane (DOPC/DOPS/NBD-PC 19:20:1) on glass measured in the conditions of a A5-free (SLB only), b full A5 coverage, and c A5-removal upon EDTA-addition. Two separate spectral channels with different excitation lasers were used to monitor NBD-PC and A5-Alexa 647 (mixture of A5:A5-Alexa 647 at a ratio of 2:1), respectively. The white dashed circles indicate the photobleaching area. d Time-lapse analysis of FRAP experiments within the photobleaching areas shown in ac. The presence of the A5 2D-lattice slows down the fluorescence recovery of the underlying membrane (orange). The A5 2D-lattice is stable and shows no fluorescence recovery. e Calculated lipid diffusivity in the subsequent FRAP experiments. The formation of A5 2D-lattice decreases the mobility of underlying lipids, which was recovered by removing A5 molecules through EDTA-addition. Each data represent the mean ± s.d. (mean ± standard deviation) of n ≥ 10 FRAP areas.
Fig. 5
Fig. 5. A5 small aggregates and 2D-lattice can mediate the order of underlying membrane.
a, b CLSM fluorescence images of GUVs (DOPC/DOPS 50:50, focusing at the equatorial plane) staining with environment-sensitive dye, Laurdan, recorded in the conditions of a A5-free or b full A5 2D-lattice coverage, respectively. Three spectral channels were used to monitor the fluorescence of Laurdan (Ch1: 412–463 nm; Ch2: 472–535 nm) or A5-Alexa 647, respectively. Based on the Equation 1, the generalized polarization (GP) image of GUVs can be determined using the averaged fluorescence images of Ch1 and Ch2 (n = 20). c GP Histograms of two A5-free GUVs (blue) and a GUV fully covered by A5 (orange) as shown in a, b, respectively. The presence of A5 2D-lattice shifts the most probable peak in GP histogram toward to a higher value (black arrow), which specifies the membrane becomes more ordered. d The mean GP value of the A5-free GUVs (blue, 0.01 ± 0.04) or A5-covered GUVs (orange, 0.17 ± 0.03), respectively. Each data represent for mean ± s.d. among different GUVs with n ≥ 10. e, f Representative CLSM fluorescence image frames (e) and time-dependent fluorescence intensity traces (f) showing the impacts of A5 2D-lattice self-assembly on a GUV, following the subsequent additions of A5 at 114.4 s and 468.0 s, respectively (indicated by red triangles in f). g Time-lapse analysis of GP value (blue curve), background corrected, normalized A5 intensity (red curve), and diameter of the GUV (green curve). This GP value is calculated using the sum of fluorescence intensity in two spectral channels of Laurdan. Although the first A5 addition makes GUV partially covered by A5 with ~10% coverage, a small increasement in GP value can still be observed at ~395 s (blue triangle, GP = 0.07, ~280 s after A5 addition). The subsequent second A5 addition increases the GP value up to 0.169 at 592.8 s, which is highly compatible with the mean GP value observed for A5-covered GUVs in d. Upon two A5 additions, the diameter of the GUV decreases especially during the second A5 addition, along with simultaneous GP value increases. Statistical analysis on the shrinkage of GUVs diameter is provided in Supplementary Fig. 3.
Fig. 6
Fig. 6. Molecular dynamics simulation (MDS) of a DOPC/DOPS bilayer exposed to a Ca2+-lattice, extreme Ca2+-concentrations and in absence of Ca2+.
a Top and side views of the computational assay. DOPC and DOPS lipids are shown in green and red, respectively. Calcium, sodium, and chloride are shown as pink, yellow, and blue van der Waals spheres. b Time evolution of the x, y-dimensions of the simulation cell at increasing calcium concentration. Reference assay devoid of calcium (inset). c Order parameter of the DOPC lipids in the reference assay devoid of calcium (lavender) and at high calcium concentration (red), determined as averages over sn-1 and sn-2 chains, in a time frame of 1 µs. Each data represent for mean ± s.d. of the order parameter. d Diffusivity of DOPS lipids measured from their mean-squared displacement over a period of 1 µs. Typical configuration of a calcium ion chelated by DOPS (inset).
Fig. 7
Fig. 7. HS-AFM of A5-assisted membrane healing processes.
a HS-AFM image frames (Supplementary Movie 5) showing the formation of membrane, following the addition of small unilamellar vesicles into fluid cell, in the presence of preformed membrane patches covered with A5 2D-lattices. The colored circles indicate membrane fusion locations between A5-protected membranes and newly formed membranes. Green arrows in frame 104.0 s indicate topographical stripes resulting from highly mobile A5 after membrane fusion. b Graph of the time-lapse evolution of the integrity of A5 patches A and B, total membrane surface coverage, and membrane fusion efficiency, estimated by the ratio of circumference and membrane area on newly formed membrane. A5-protected membranes remain robust beyond the time of first successful fusion events. c A5 dynamics (blue arrows) (Supplementary Movie 6) and d A5 2D-lattice dynamics (blue lines) (Supplementary Movie 7) near membrane defects following the addition of supplemental A5 to the HS-AFM fluid cell.

References

    1. McNeil PL, Steinhardt RA. Plasma membrane disruption: repair, prevention, adaptation. Annu. Rev. Cell Dev. Biol. 2003;19:697–731. doi: 10.1146/annurev.cellbio.19.111301.140101. - DOI - PubMed
    1. Suzuki J, et al. Calcium-dependent phospholipid scramblase activity of TMEM16 protein family members. J. Biol. Chem. 2013;288:13305–13316. doi: 10.1074/jbc.M113.457937. - DOI - PMC - PubMed
    1. Boye TL, Nylandsted J. Annexins in plasma membrane repair. Biol. Chem. 2016;397:961–969. doi: 10.1515/hsz-2016-0171. - DOI - PubMed
    1. McNeil AK, Rescher U, Gerke V, McNeil PL. Requirement for annexin A1 in plasma membrane repair. J. Biol. Chem. 2006;281:35202–35207. doi: 10.1074/jbc.M606406200. - DOI - PubMed
    1. Carmeille R, et al. Annexin-A5 promotes membrane resealing in human trophoblasts. Biochim. Biophys. Acta. 2015;1853:2033–2044. doi: 10.1016/j.bbamcr.2014.12.038. - DOI - PubMed

Publication types