. 2020 Jan;6(1):34-45.
doi: 10.1038/s41477-019-0577-7. Epub 2020 Jan 13.

Eight high-quality genomes reveal pan-genome architecture and ecotype differentiation of Brassica napus

Affiliations

Eight high-quality genomes reveal pan-genome architecture and ecotype differentiation of Brassica napus

Jia-Ming Song et al. Nat Plants. 2020 Jan.

Abstract

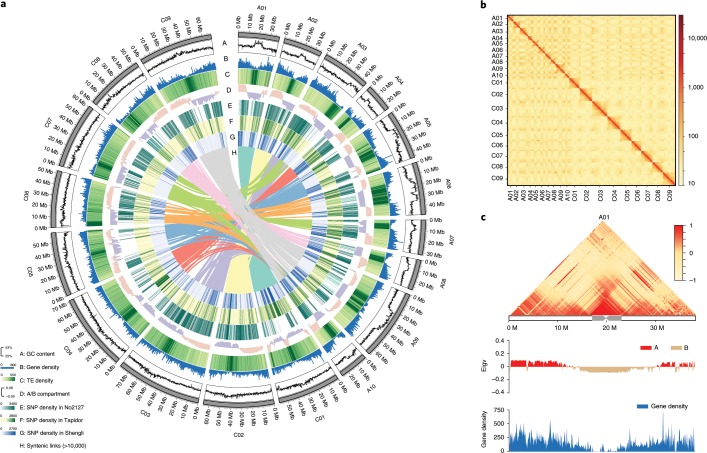
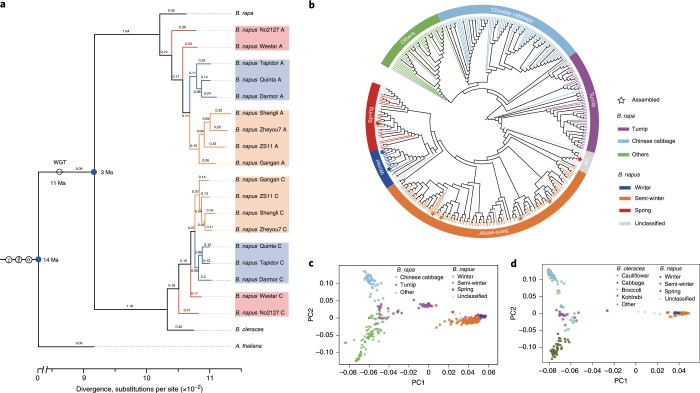
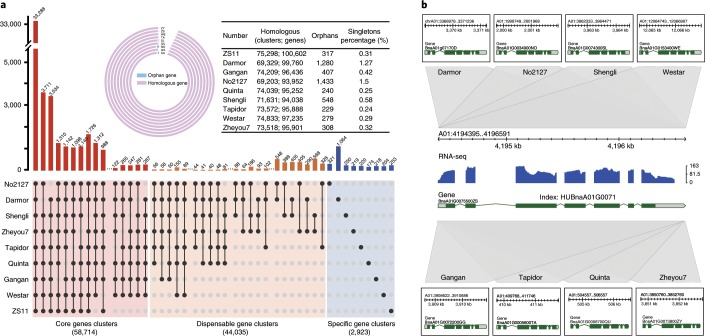
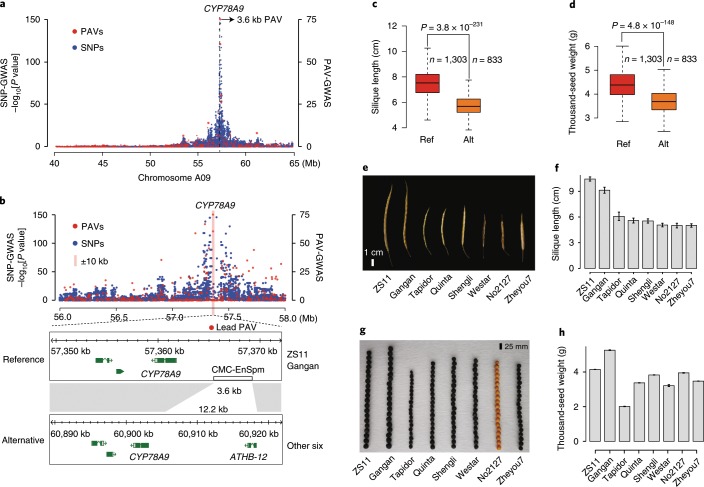
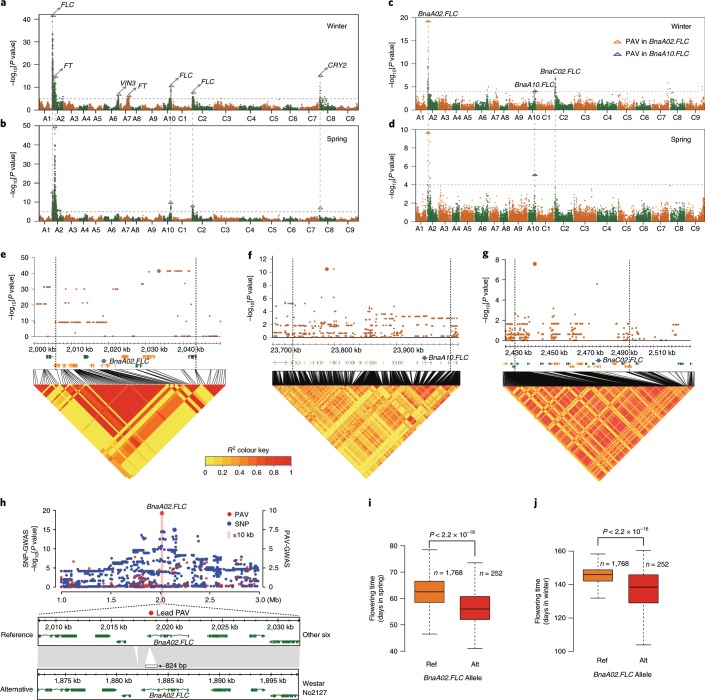
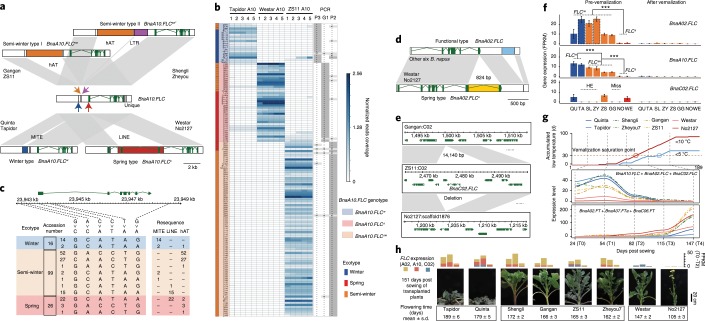
Rapeseed (Brassica napus) is the second most important oilseed crop in the world but the genetic diversity underlying its massive phenotypic variations remains largely unexplored. Here, we report the sequencing, de novo assembly and annotation of eight B. napus accessions. Using pan-genome comparative analysis, millions of small variations and 77.2-149.6 megabase presence and absence variations (PAVs) were identified. More than 9.4% of the genes contained large-effect mutations or structural variations. PAV-based genome-wide association study (PAV-GWAS) directly identified causal structural variations for silique length, seed weight and flowering time in a nested association mapping population with ZS11 (reference line) as the donor, which were not detected by single-nucleotide polymorphisms-based GWAS (SNP-GWAS), demonstrating that PAV-GWAS was complementary to SNP-GWAS in identifying associations to traits. Further analysis showed that PAVs in three FLOWERING LOCUS C genes were closely related to flowering time and ecotype differentiation. This study provides resources to support a better understanding of the genome architecture and acceleration of the genetic improvement of B. napus.


Conflict of interest statement

The authors declare no competing interests.

Figures

Fig. 1
Fig. 1. Features of the B. napus genome.
a, Circos plot of the multidimensional topography for B. napus ZS11 genome. A–H, Concentric circles from outermost to innermost, show GC content (A), gene density (B), TE density (C), A/B compartment (D), SNP density in No2127 (E), SNP density in Tapidor (F), SNP density in Shengli (G) and syntenic regions between the A and C subgenomes (H). b, Genome-wide contact matrix of ZS11 genome. The colour intensity represents the frequency of contact between two 500 kb loci. c, Interaction frequency, A/B compartment and gene density in ZS11 chromosome A01. The colour scale represents the Pearson’s correlation coefficient of normalized interaction matrix. Eigv, eigenvector value of correlation matrix.
Fig. 2
Fig. 2. Phylogenetic analysis of Brassicaceae.
a, Phylogenetic relationship of nine B. napus genomes and their diploid progenitors, B. rapa and B. oleracea. The phylogenetic tree is constructed on the basis of 1,235 conserved genes. The values on the branch are the substitutions between species and the nearest ancestor. WGT, whole genome triplication. b, A neighbour-joining tree of 210 B. napus accessions, eight assembled accessions and 199 B. rapa accessions. Each assembled accession was represented by a pentagram (left to right: Westar, Quinta, Tapidor, Shengli, Zheyou, Gangan, ZS11 and No2127). The layer rings indicate the group name of each clade. c, PCA plot of B. napus (n = 210) and B. rapa (n = 199) accessions. d, PCA plot of B. napus (n = 210) and B. oleracea (n = 119) accessions.
Fig. 3
Fig. 3. The pan-genome and gene index of nine B. napus accessions.
a, Core- and pan-genome of B. napus. The upper circle diagram shows the ratio of homologous genes to orphan genes and the table lists the detailed number. The histograms below show the core-gene clusters (present in seven or more genomes), dispensable gene clusters (present in two to six genomes) and specific gene clusters (present in one genome). b, An example of B. napus Gene Index. HUBnaA01G007100 is the unique gene ID of A01 MAPKK2 gene across nine B. napus genomes. The axis is the physical location of the gene in the ZS11 genome. The blue column is an accumulation of multi-tissue RNA-seq reads map. Grey blocks are collinearly aligned regions. Annotated gene structure in each genome is in the black box.
Fig. 4
Fig. 4. GWAS of silique length and seed weight in the NAM population.
a, Manhattan plots of SNP-GWAS and PAV-GWAS for silique length. b, A 3.6-kb CACTA-like insertion as lead PAV of BnaA09.CYP78A9 promoter region. c, The silique length in lines with different CYP78A9 alleles. For a and b, the GWAS (-lmmm 1: Wald test) was performed with 3,971,412 SNPs or 27,216 PAVs in the BN-NAM population containing 2,141 RILs. d, Thousand-seed weight in lines with different CYP78A9 alleles. For c and d, P values were determined using two-tailed Student’s t-tests. The middle bars represent the median while the bottom and top of each box represent the 25th and 75th percentiles, respectively. The whiskers extend to 1.5 times the interquartile range. Alt, alternative; Ref, reference. e,f, Phenotype data of silique length in eight B. napus accessions. g,h, Phenotype data of seed weight in eight assembled B. napus accessions. For e and g, experiments were repeated five times with similar results. For f and h, data are mean ± s.d. of eight and five biological replicates, respectively.
Fig. 5
Fig. 5. GWAS of flowering time in the NAM population.
a,b, Manhattan plots for flowering time analysed by SNP-GWAS in winter and spring environments, respectively. The gray dashed lines indicate the significance threshold. The BLUP values of the days from sowing to flowering (DTF) in the winter and spring environments were used to represent the flowering time for SNP-GWAS. The triangles and arrows denote the main candidate genes surrounding the strong peaks. c,d, Manhattan plots for flowering time analysed by PAV-GWAS in winter and spring environments, respectively. The BLUP values of DTFs in winter and spring environments were used to represent the flowering time for PAV-GWAS. The gray dashed lines indicate the significance threshold. eg, Local Manhattan plots, gene positions and LD heatmaps show the regions surrounding the strong peaks of the candidate genes (BnaA02.FLC, BnaA10.FLC and BnaC02.FLC) identified by SNP-GWAS. h, An 824-bp hAT insertion in the last exon of BnaA02.FLC was identified as the lead PAV by PAV-GWAS. For ah, the GWAS (-lmmm 1: Wald test) was performed with 3,971,412 SNPs or 27,216 PAVs in the BN-NAM population containing 2,141 RILs. i,j, Flowering time of lines with different BnaA02.FLC alleles in spring (i) and winter (j), respectively. P values were determined using two-tailed Student’s t-tests. The middle bars represent the median, while the bottom and top of each box represent the 25th and 75th percentiles, respectively. The whiskers extend to 1.5 times the interquartile range.
Fig. 6
Fig. 6. Structural variations detected in BnaA10.FLC, BnaA02.FLC and BnaC02.FLC.
a, Insertions of four transposable elements around BnaA10.FLC in different ecotypes. b, Genotyping BnaA10.FLC in 141 B. napus accessions. The left were ecotypes of B. napus accessions. The middle is the read coverage of resequencing data in 15 representative sites, with Tapidor A10: 22,661,433–22,661,437; Westar A10: 23,731,730–23,731,734 and ZS11 A10: 23,942,298–23,942,302. The right is the PCR results statistics of three insertions. c, The haplotypes of six SNPs and three TEs around BnaA10.FLC in 141 B. napus accessions. d,e, SVs in BnaA02.FLC (d) and BnaC02.FLC (e) in eight accessions. f, The expression levels of BnaA02.FLC, BnaA10.FLC and BnaC02.FLC in plants before and after vernalization (T0 and T4) based on the number of fragments per kilobase of the exon model per million mapped reads (FPKM). ***P < 0.001 (two-tailed Student’s t-test). Error bars indicate the mean ± s.d. (n = 2). ns, not spring; w, winter; s, spring; sw, semi-winter. g, The relationship between the accumulated days with low temperature, the cumulative expression levels of FLCs, FTs and flowering time in the 2018–2019 growing season in Wuhan. Three expressed FT genes were considered (average FPKM ≥ 1). Accumulated low-temperature curves indicated that the end of vernalization was in T2–T3 for SORs and T3–T4 for WORs. h, The cumulative expression levels of three FLC genes and the flowering time characterization of eight assembled B. napus accessions. Stacked histogram showed FLCs expression in T0–T3. These plants were transplanted from the field to the pot at 106 d after sowing. The standard deviation and average of flowering time were counted from 14–21 lines.

References

    1. Wang B, et al. Dissection of the genetic architecture of three seed-quality traits and consequences for breeding in Brassica napus. Plant Biotechnol. J. 2018;16:1336–1348. doi: 10.1111/pbi.12873. - DOI - PMC - PubMed
    1. Chalhoub B, et al. Early allopolyploid evolution in the post-Neolithic Brassica napus oilseed genome. Science. 2014;345:950–953. doi: 10.1126/science.1253435. - DOI - PubMed
    1. Lu K, et al. Whole-genome resequencing reveals Brassica napus origin and genetic loci involved in its improvement. Nat. Commun. 2019;10:1154. doi: 10.1038/s41467-019-09134-9. - DOI - PMC - PubMed
    1. Sun F, et al. The high-quality genome of Brassica napus cultivar ‘ZS11’ reveals the introgression history in semi-winter morphotype. Plant J. 2017;92:452–468. doi: 10.1111/tpj.13669. - DOI - PubMed
    1. Zou J, et al. Genome-wide selection footprints and deleterious variations in young Asian allotetraploid rapeseed. Plant Biotechnol. J. 2019;17:1998–2010. doi: 10.1111/pbi.13115. - DOI - PMC - PubMed

Publication types