. 2020 Jan 13;10(1):193.
doi: 10.1038/s41598-019-55850-z.

The interaction of Multiple Sclerosis risk loci with Epstein-Barr virus phenotypes implicates the virus in pathogenesis

Affiliations

The interaction of Multiple Sclerosis risk loci with Epstein-Barr virus phenotypes implicates the virus in pathogenesis

Ali Afrasiabi et al. Sci Rep. .

Abstract

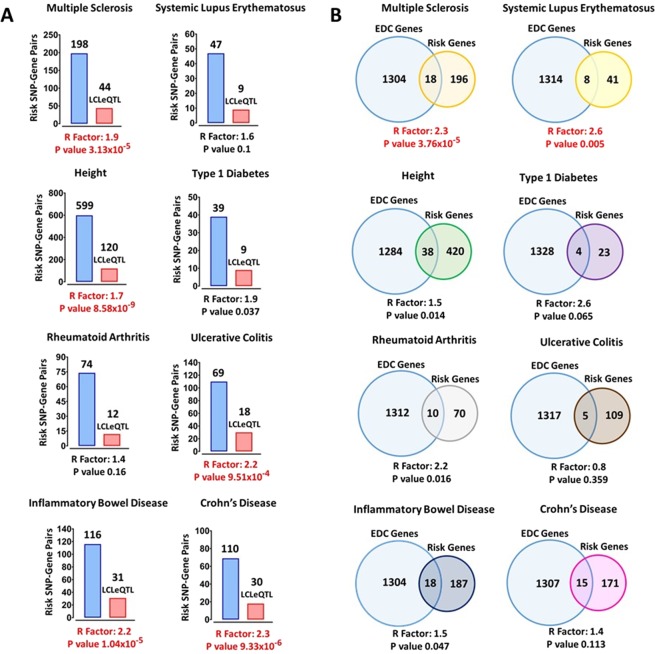
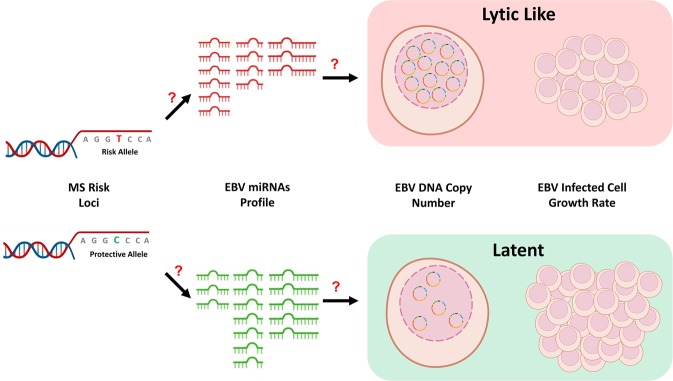
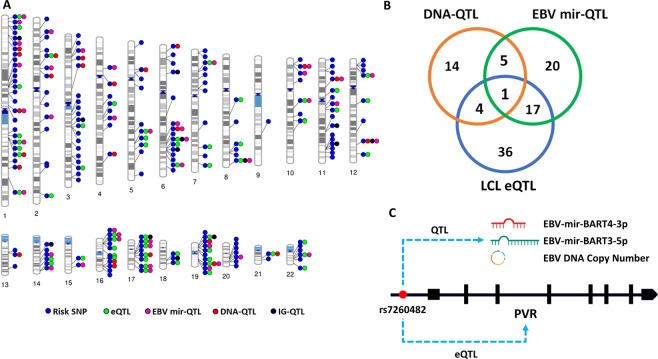
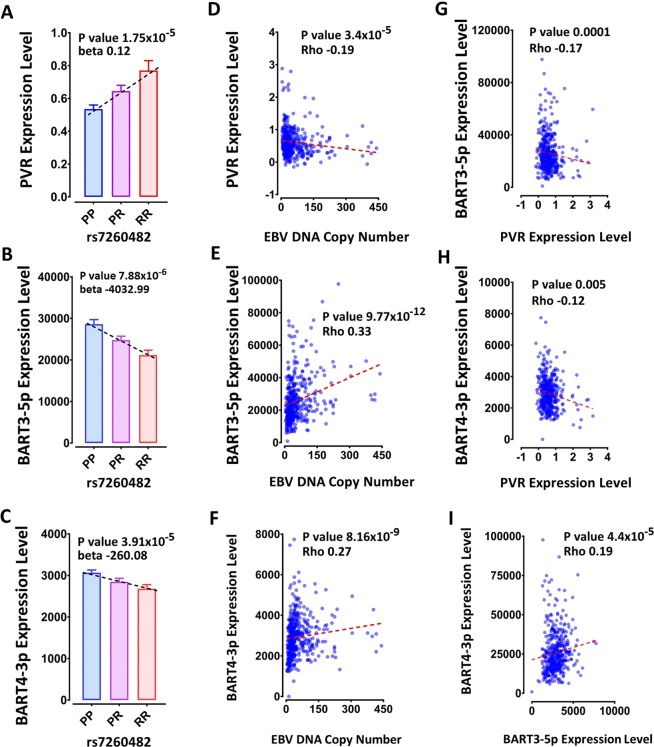
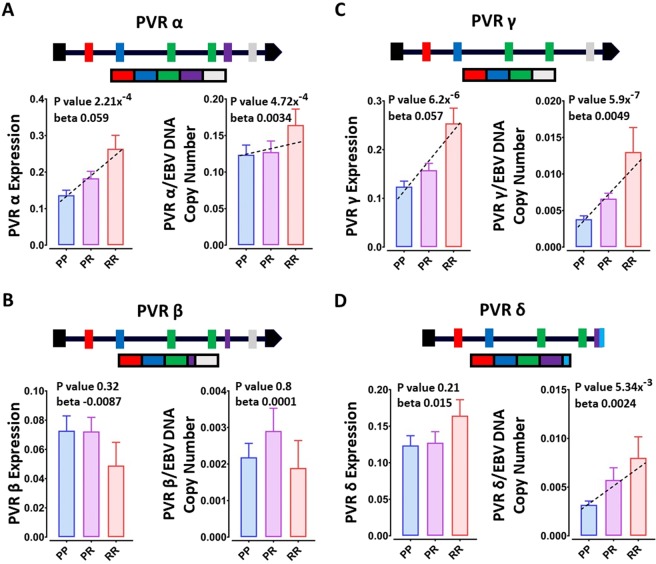
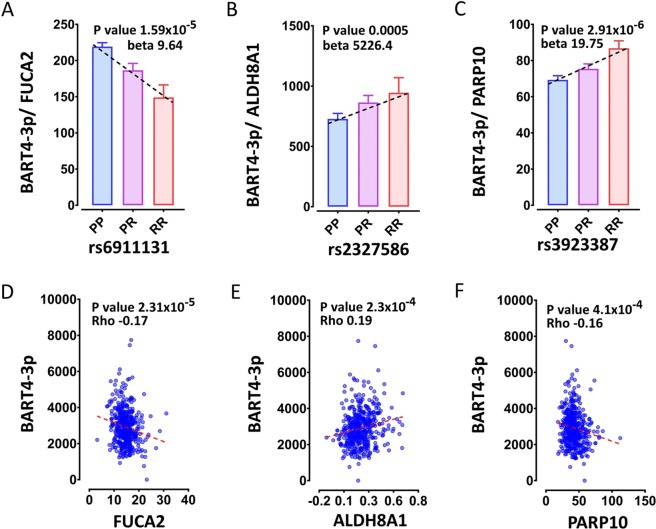
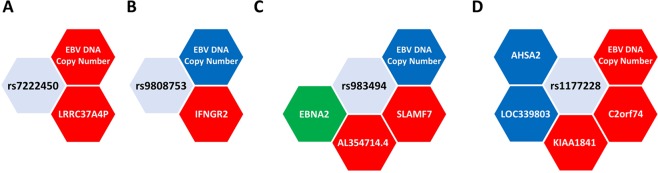
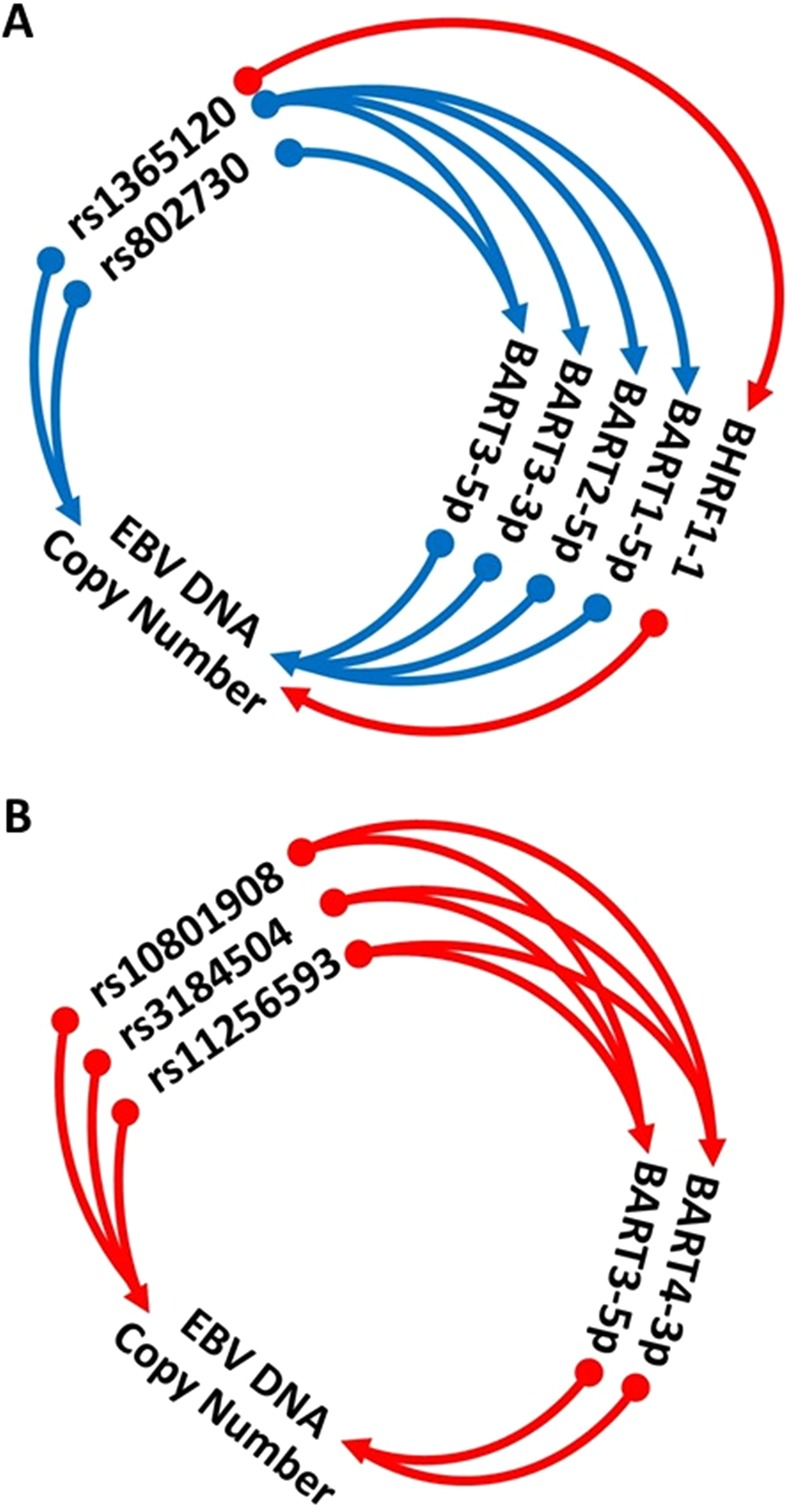
Translating the findings of genome wide association studies (GWAS) to new therapies requires identification of the relevant immunological contexts to interrogate for genetic effects. In one of the largest GWAS, more than 200 risk loci have been identified for Multiple Sclerosis (MS) susceptibility. Infection with Epstein-Barr virus (EBV) appears to be necessary for the development of Multiple Sclerosis (MS). Many MS risk loci are associated with altered gene expression in EBV infected B cells (LCLs). We have interrogated this immunological context to identify interaction between MS risk loci and EBV DNA copy number, intrinsic growth rate and EBV encoded miRNA expression. The EBV DNA copy number was associated with significantly more risk alleles for MS than for other diseases or traits. EBV miRNAs BART4-3p and BART3-5p were highly associated with EBV DNA copy number and MS risk loci. The poliovirus receptor (PVR) risk SNP was associated with EBV DNA copy number, PVR and miRNA expression. Targeting EBV miRNAs BART4-3p and BART3-5p, and the gene PVR, may provide therapeutic benefit in MS. This study also indicates how immunological context and risk loci interactions can be exploited to validate and develop novel therapeutic approaches.


Conflict of interest statement

The authors declare no competing interests.

Figures

Figure 1
Figure 1
(A) Over-representation of disease/trait risk SNP-gene pairs that in eQTL in LCL (LCLeQTL) among all significant LCLeQTLs (FDR < 5%). (B) Over-representation of disease/trait risk loci (genes) whose expression was correlated with EBV DNA copy number in LCLs (FDR 5%). The Representation (R) Factor indicates the ratio of overlapping genes relative to expected number of overlapping genes by chance: >1 means more than by chance, <than 1 means less than by chance. The p value is based on the exact hypergeometric probability test. LCLeQTL: The SNP-Gene pair which is in eQTL in LCLs. The red bar indicates the subset of all SNP-Gene pairs, blue bar, which are in eQTL in LCLs. The disease risk genes were identified in related GWAS (see supplementary Table 1 for references).
Figure 2
Figure 2
Schema of project to determine if MS risk genetic background alters EBV phenotypes (EBV miRNA expression, DNA copy number and intrinsic growth rate) in lymphocytic cell lines. Figure created using the BioRender tool.
Figure 3
Figure 3
(A) MS risk SNP genotype effects on each trait; DNA-QTL (genotype effect on EBV DNA copy number), EBV mir-QTL (genotype effect on EBV miRNA expression level), IG-QTL (genotype effect on LCL intrinsic growth rate) and LCLeQTL (genotype effect on host genes within a 1 mega base window from the SNP). (B) The overlap between the MS risk SNPs which are DNA-QTLs, EBV mir-QTLs and LCLeQTLs. (C) The rs7260482 SNP as is associated with EBV DNA copy number, EBV miRNA expression (BART4-3p and BART3-5p) and expression level of the proximal MS risk gene (PVR).
Figure 4
Figure 4
(A) Association of MS risk SNP rs7260482 genotype with expression of proximal gene PVR, and EBV miRNAs (B) BART3-5p and (C) BART4-3p. Correlation of EBV DNA copy number with (D) PVR, (E) BART3-5p and (F) BART4-3p expression levels. (G-I) Correlation between PVR, BART3-5p and BART4-3p expression levels. PP - protective homozygous, PR - heterozygote genotype, RR - risk homozygous SNP genotype. The genotype association with expression was calculated through testing the differences in the expression level in PP, PR and RR genotypes using the linear model test. Correlations were tested using Spearman’s Rank-Order correlation test.
Figure 5
Figure 5
The rs7260482 SNP genotype effect on PVR isoforms expression level; PVRα (A), PVRβ (B), PVRγ (C) and PVRδ (D).
Figure 6
Figure 6
The genotype effect of MS risk SNPs may be associated with increased or decreased ratio of BART4-3p/risk gene expression (A–C); and the proximal risk gene may be associated with increased or decreased BART4-3p expression (D–F).
Figure 7
Figure 7
Five MS risk SNPs (including rs7260482, Fig. 3, 4) were EBV DNA-QTLs and were LCLeQTLs. (A) The risk allele of rs7222450 is associated with increased expression of its proximal host gene LRRC37A4P and increased EBV DNA copy number; (B) the risk allele of rs9808753 is associated with lower EBV DNA copy number and higher expression of its proximal host gene IFNGR2; (C) the risk allele of rs983494 is associated with higher expression of proximal host genes SLAMF7 and AL354714.4, lower EBV DNA copy number and is colocated with an EBNA2 binding site (green); (D) the risk allele of rs1177228 is associated with lower expression of its proximal host genes AHSA2 and LOC339803, higher expression of its proximal genes KIAA1841 and C2ORF74, and higher EBV DNA copy number. Red and blue show positive and negative correlations, respectively.
Figure 8
Figure 8
Six risk SNPs (including rs7260482, Fig. 3, 4) were both EBV miRNA-QTLs and DNA-QTLs. (A) SNPs rs1365120 and rs802730 were not associated with expression of their proximal genes (ie not LCLeQTLs) but the risk allele was associated with reduced EBV DNA copy number, reduced expression of four EBV miRNAs, and increased expression of one miRNA and expression of these miRNAs were correlated with EBV DNA copy number. (B) The risk allele of SNPs rs10801908, rs3184504 and rs11256593 were associated with higher expression of two miRNAs and higher EBV DNA copy number. Red and blue arrows show positive and negative correlations, respectively.

Similar articles

Cited by

References

    1. IMSGC et al. Analysis of immune-related loci identifies 48 new susceptibility variants for multiple sclerosis. Nat Genet. 2013;45:1353–1360. doi: 10.1038/ng.2770. - DOI - PMC - PubMed
    1. Ryan Katie J., White Charles C., Patel Kruti, Xu Jishu, Olah Marta, Replogle Joseph M., Frangieh Michael, Cimpean Maria, Winn Phoebe, McHenry Allison, Kaskow Belinda J., Chan Gail, Cuerdon Nicole, Bennett David A., Boyd Justin D., Imitola Jaime, Elyaman Wassim, De Jager Philip L., Bradshaw Elizabeth M. A human microglia-like cellular model for assessing the effects of neurodegenerative disease gene variants. Science Translational Medicine. 2017;9(421):eaai7635. doi: 10.1126/scitranslmed.aai7635. - DOI - PMC - PubMed
    1. Fairfax BP, et al. Innate immune activity conditions the effect of regulatory variants upon monocyte gene expression. Science. 2014;343:1246949. doi: 10.1126/science.1246949. - DOI - PMC - PubMed
    1. Patsopoulos, N. et al. The Multiple Sclerosis Genomic Map: Role of peripheral immune cells and resident microglia in susceptibility. bioRxiv, 10.1101/143933 (2017).
    1. International Multiple Sclerosis Genetics, C. A systems biology approach uncovers cell-specific gene regulatory effects of genetic associations in multiple sclerosis. Nat Commun, 10, 2236, 10.1038/s41467-019-09773-y (2019). - PMC - PubMed

MeSH terms