. 2020 Feb;38(2):189-198.
doi: 10.1038/s41587-019-0374-x. Epub 2020 Jan 13.

An integrated perfusion machine preserves injured human livers for 1 week

Affiliations

An integrated perfusion machine preserves injured human livers for 1 week

Dilmurodjon Eshmuminov et al. Nat Biotechnol. 2020 Feb.

Abstract

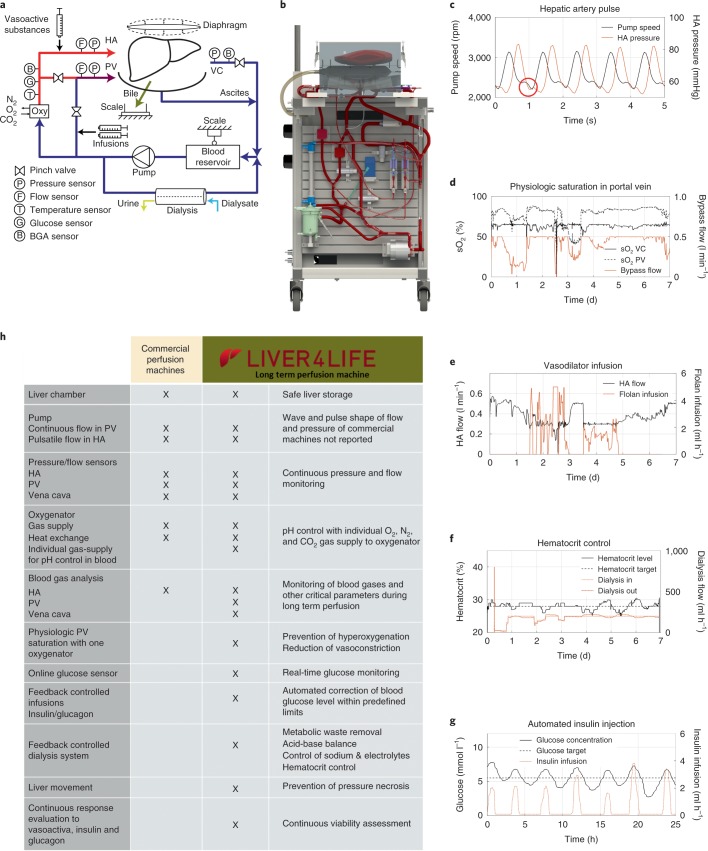
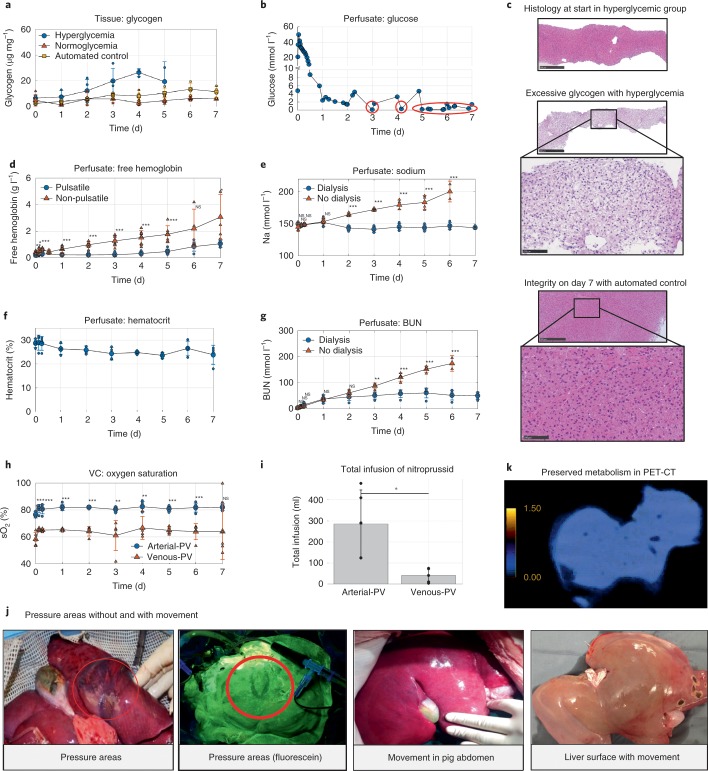
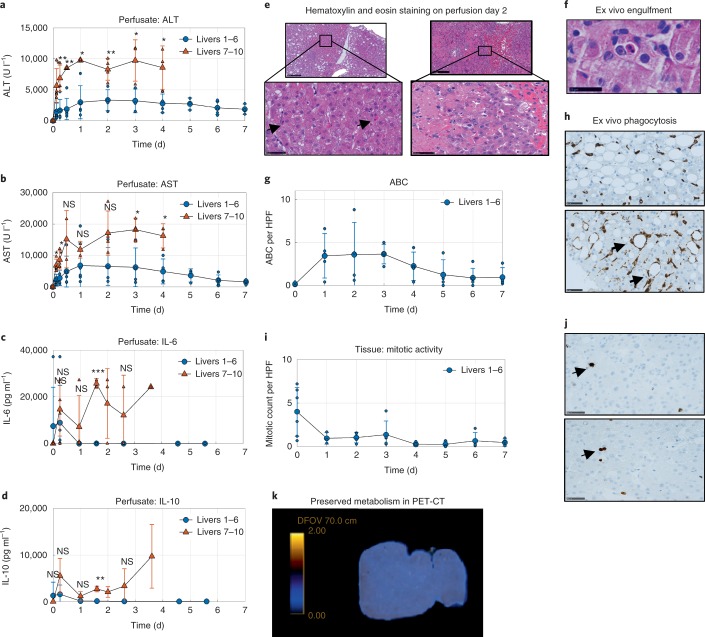
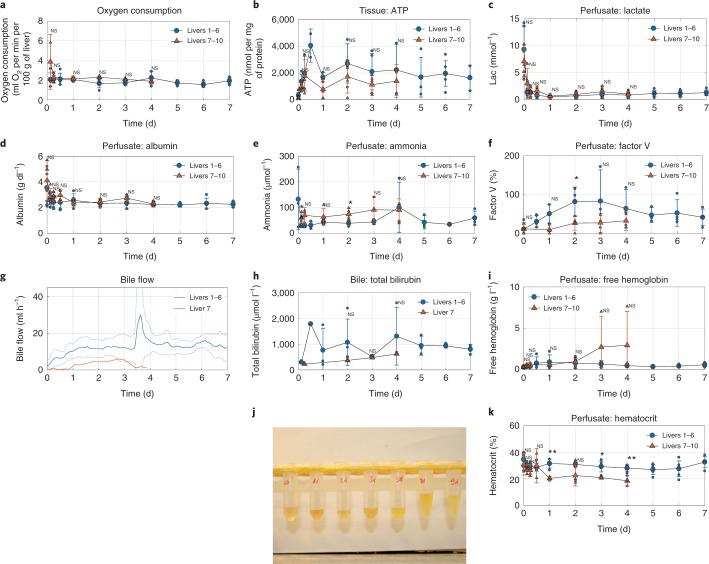
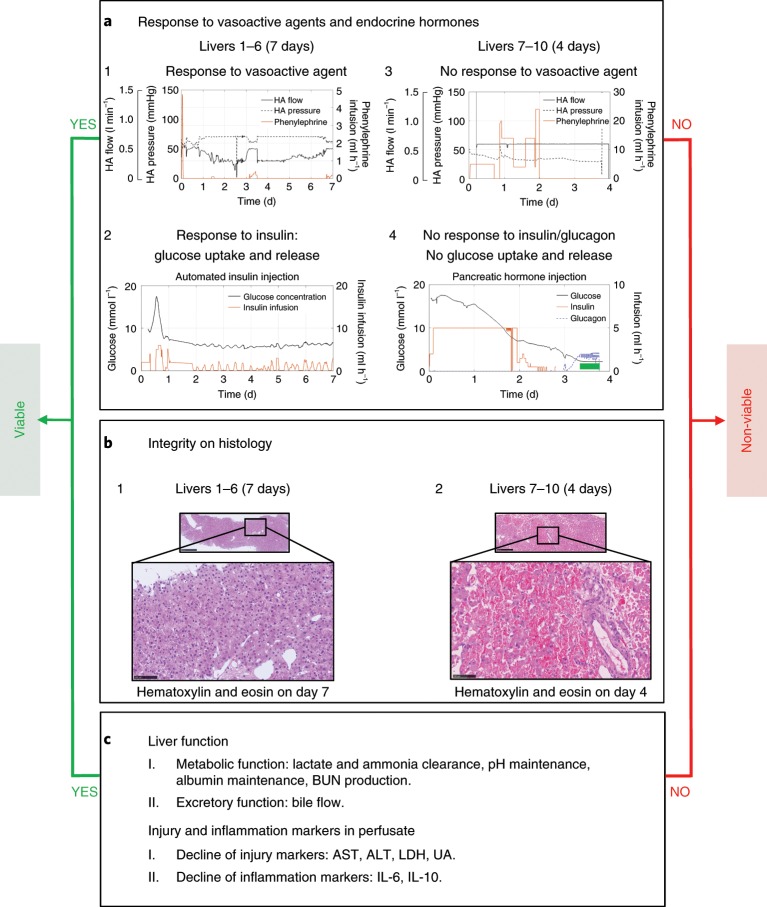
The ability to preserve metabolically active livers ex vivo for 1 week or more could allow repair of poor-quality livers that would otherwise be declined for transplantation. Current approaches for normothermic perfusion can preserve human livers for only 24 h. Here we report a liver perfusion machine that integrates multiple core physiological functions, including automated management of glucose levels and oxygenation, waste-product removal and hematocrit control. We developed the machine in a stepwise fashion using pig livers. Study of multiple ex vivo parameters and early phase reperfusion in vivo demonstrated the viability of pig livers perfused for 1 week without the need for additional blood products or perfusate exchange. We tested the approach on ten injured human livers that had been declined for transplantation by all European centers. After a 7-d perfusion, six of the human livers showed preserved function as indicated by bile production, synthesis of coagulation factors, maintained cellular energy (ATP) and intact liver structure.


Conflict of interest statement

ETH (Swiss Federal Institute of Technology in Zurich) and the University of Zurich (D.E., D.B., L.B.B., M.H., M.J.S., X.M., P.D., R. G., P.R.v.R. and P.-A.C.) have applied for a patent on this new perfusion technology (PCT/EP2019/051252).

Figures

Fig. 1
Fig. 1. Long-term liver perfusion machine specifications.
a, Simplified schematics of the perfusion machine with all main components included. b, Visual illustration of the perfusion loop. c, Representative illustration of hepatic-artery (HA) pressure pulse with the visible dicrotic notch (imitating in vivo aortic valve closure, red circle) created by variation of the rotation speed of the centrifugal pump. d, Representative bypass flow of fully oxygenated (arterial) perfusate to the portal vein (PV), automatically controlled according to the monitored oxygen saturation of the deoxygenized perfusate (vena cava (VC)) to generate a physiological portal vein oxygen saturation (bypass seen in a). e, Representative illustration of hepatic-artery flow variation in relation to the injection rate of vasodilator (Flolan (Epoprostenol)) when the limit of 0.25 l min−1 is undershot. f, Representative illustration of the hematocrit control by dialysis, where the system continuously measures the hematocrit level in the perfusate and determines the volume of dialysis fluid that is administered into, or removed from the perfusion loop through the dialysis filter. g, Representative illustration of the automated insulin injection shown for a 25 h section of perfusion where insulin is infused when the defined glucose target level is surpassed in the perfusate. h, Illustrative table showing features of the presented long-term perfusion machine as compared to the commercially available perfusion machines. ‘Liver4Life’ refers to the name of the research group.
Fig. 2
Fig. 2. Step-by-step integration of the components for long-term perfusion using pig livers.
a, Amount of glycogen per milligram of liver tissue according to the glucose-level control method. In the hyperglycemic group, hyperglycemia (>10 mmol l−1) in the perfusate was maintained by constant glucose infusion (n = 4 pig livers). In the normoglycemic group, a targeted glucose level of 4 mmol l−1 was maintained by manual adjustment of the glucose infusion (n = 4 pig livers). In the automated control group, glucose was never infused but was rather released from the liver by gluconeogenesis during a basal insulin injection. Glucagon was injected, if the desired glucose level was undershot after insulin injection and spontaneous glucose level recovery was not sufficient (n = 5 pig livers). b, Representative experiment from the normoglycemic group (n = 4 pig livers) demonstrating the complete glucose uptake (red circle) by hepatocytes under a high-dose (‘fed state’) insulin injection. c, Representative hematoxylin and eosin staining showing histological changes according to the glucose-level control method (top). Normal histology at perfusion start (middle). Enlarged, pale hepatocytes with excessive glycogen stores resembling glycogen-storage disease on day 3 with a ‘hyperglycemic protocol’ (n = 4 pig livers; bottom). Liver integrity on day 7 with the automated glucose metabolism control (n = 5 pig livers). Scale bars: overview, 500 µm; higher magnification, 100 µm d, Hemolysis rate with (n = 8 pig livers) and without (n = 8 pig livers) pulsatile flow in the hepatic artery. e, Perfusate sodium level with (n = 5 pig livers) and without (n = 4 pig livers) dialysis. f, Hematocrit level maintenance with dialysis for 7 d (n = 5 pig livers). g, BUN level course in perfusate with (n = 5) and without (n = 4) dialysis. h, Oxygen saturation in liver outflow (vena cava) according to perfusion with ‘arterial blood’ (n = 5 pig livers) and ‘venous blood’ (n = 5 pig livers) in the portal vein. i, The need for vasodilators during perfusion for 7 d with ‘arterial’ (n = 5 pig livers) and ‘venous’ blood (n = 5 pig livers) in portal vein. Increased use of vasodilators in the arterial portal vein implies increased resistance of the hepatic artery. j, Representative experiments illustrating pressure necrosis in static storage and its prevention with liver movement (left). Early perfusion experiments with macroscopic pressure necrosis (n = 2 pig livers; middle left). Impaired circulation in pressure areas demonstrated by fluorescein distribution (red circle) (n = 1 pig liver; middle right and right). In a later developmental phase, perfusion was performed in situ (n = 2 pig livers). In this experimental setting, diaphragm movement was mimicked during isolated in situ liver perfusion with a medical ventilator after the animals were euthanized, whereupon the livers showed no pressure areas. Dark areas in the image to the right correspond to biopsy spots. k, Representative image showing radioactive glucose uptake in PET-CT after 1 week of perfusion showing homogenous metabolism without necrosis in contact areas to silicon mat (n = 4 pig livers). Data are reported as mean ± s.d. For comparison of two groups a two-tailed Student’s t test was used. *P < 0.05, **P < 0.01, ***P < 0.001; exact P values are provided in Supplementary Table 3. NS, not significant.
Fig. 3
Fig. 3. Injury markers in perfusate and tissue during ex vivo human liver perfusion (n = 10 livers).
a,b, Release of injury markers into perfusate with ALT (a) and AST (b) levels. Human livers 1 to 6 (blue line, n = 6 livers) and human livers 7 to 10 (red line, n = 4 livers). c,d, Cytokine release shown for proinflammatory IL-6 (c; n = 9) and anti-inflammatory IL-10 (d; n = 9). Error bars for livers 1 to 6 are not plotted on the presented scale. e, Hematoxylin and eosin staining on day 2. Left, representative hematoxylin and eosin staining showing apoptotic bodies (black arrows) in livers 1 to 6. Right, representative hematoxylin and eosin staining showing massive cell death in livers 7 to 10; the higher magnification shows some hepatocytes that are still viable. Scale bars: slide overviews, 250 µm; higher magnifications, 50 µm. f, Representative image showing engulfment of an apoptotic body by hepatocytes (black arrow) in livers 1 to 6 (ref. ). Scale bar, 50 µm. g, Apoptotic body count (ABC) seen on hematoxylin and eosin staining (per HPF) in livers 1 to 6, h, Top, representative slides showing phagocytosis with CD68+ immunohistochemistry for liver macrophages (livers 4 and 5). Bottom, before reperfusion, fat vacuoles are not phagocytized. Phagocytosis of released fat vacuoles by macrophages (lipopeliosis) on day 4 in a steatotic liver (black arrows). Scale bar, 50 µm. i, Mitotic count (pH3+ hepatocytes) per HPF in livers 1 to 6. j, Representative slides from two grafts demonstrating nuclei of pH3+ hepatocytes (seen only during mitosis) on day 4 (black arrows) from livers 1 to 6. Scale bars, 50 µm. k, Representative image demonstrating radioactive glucose uptake in PET-CT as a sign of preserved metabolism after 1 week of perfusion in a human liver (standardized uptake value (SUV)max 1.15, SUVmean 0.64). Injected dose of 22 MBq of radioactive glucose and uptake time of 78 min. Notably, there was no sign of necrosis on areas of contact with the silicon mat in the PET-CT images (n = 1, liver 6). Data are reported as mean ± s.d. For comparison of two groups two-tailed Student’s t test was used. *P < 0.05, **P < 0.01, ***P < 0.001; exact P values are provided in Supplementary Table 3.
Fig. 4
Fig. 4. Liver function during human liver perfusion (n = 10 livers).
a,b, Oxygen consumption (a), and ATP levels (b). Human livers 1 to 6 (blue line, n = 6 livers), human livers 7 to 10 (red line, n = 4 livers). No significant difference in liver functions was observed between the groups. c, Human blood products have high lactate at delivery (0 time). Lactate was cleared shortly after perfusion start by all the livers. df, Livers maintained a physiologic albumin level (d), cleared ammonia (e) and produced coagulation factor V (f). g, Bile flow was present constantly in livers 1 to 6, while in livers 7 to 10 only one liver disclosed bile flow (data shown are mean (solid blue lines) with s.d. (dotted blue lines) for livers 1 to 6). h, Clearance of bilirubin into bile. i, Hemolysis rate. Free hemoglobin in livers 1 to 6 was maintained at a low level (n = 4 human livers) or was reduced during perfusion (n = 2 human livers). Livers 7 to 10 showed, although not significantly, increasing levels of free hemoglobin. Small error bars for livers 1 to 6 were not plotted on the presented scale after day 4. j, There was no macroscopic sign of hemolysis on a representative image of the daily centrifuged perfusate (plasma) from livers 1 to 6. k, Constant hematocrit level for 7 d without exchanging perfusate. Data are reported as mean ± s.d. For comparison of two groups two-tailed Student’s t test was used. *P < 0.05, **P < 0.01, ***P < 0.001; exact P values are provided in Supplementary Table 3.
Fig. 5
Fig. 5. Multistep approach for viability assessment of preinjured human livers during long-term perfusion.
a, Evaluation of liver response to vasoactive agents and pancreatic hormones. (1) Liver 1 to 6, hepatic-artery vasculature maintains targeted hepatic-artery flow and pressure with response to vasoconstrictor (phenylephrine). (2) Livers 1 to 6, decline of glucose level in perfusate as a response to insulin application and increase during minimal basal infusion. (3) Livers 7 to 10, vasoplegia with lack of hepatic-artery vasculature response to the vasoconstrictor. Despite injection of high doses of phenylephrine at the maximal continuous flow rate, the targeted hepatic-artery pressure cannot be maintained. (4) Livers 7 to 10, during perfusion, hyperglycemia changed to hypoglycemia, which was not responsive to glucagon injection. Glucose had to be substituted to maintain glucose levels in the perfusate within the normal range (green rectangle). b, Integrity in histology. (1) Livers 1–6 (n = 6 livers), representative hematoxylin and eosin staining demonstrating the preserved integrity without relevant cell death on day 7. (2) Livers 7–10 (n = 4 livers), representative hematoxylin and eosin staining with massive cell death on day 4 with loss of integrity. Scale bars: overview, 500 µm; higher magnification, 100 µm. c, Evaluation of liver function and injury markers: Livers with massive cell death might maintain some of the liver functions including, for example, lactate clearance. Therefore, we consider these listed liver functions only as viability markers in combination with adequate response to hormones and vasoactive substances, as well as histology. Additionally, it should be noted that the kinetics of cytokine and injury marker release are more decisive than peak values, as absolute levels are dependent on liver mass and perfusate volume.

Comment in

References

    1. Giwa S, et al. The promise of organ and tissue preservation to transform medicine. Nat. Biotechnol. 2017;35:530–542. doi: 10.1038/nbt.3889. - DOI - PMC - PubMed
    1. de Vries RJ, et al. Supercooling extends preservation time of human livers. Nat. Biotechnol. 2019;37:1131–1136. doi: 10.1038/s41587-019-0223-y. - DOI - PMC - PubMed
    1. Buying time for transplants. Nat. Biotechnol.35, 801 (2017). - PubMed
    1. Watson CJE, et al. Observations on the ex situ perfusion of livers for transplantation. Am. J. Transplant. 2018;18:2005–2020. doi: 10.1111/ajt.14687. - DOI - PMC - PubMed
    1. Nasralla D, et al. A randomized trial of normothermic preservation in liver transplantation. Nature. 2018;557:50–56. doi: 10.1038/s41586-018-0047-9. - DOI - PubMed

Publication types

LinkOut - more resources