. 2020 Feb;22(2):187-199.
doi: 10.1038/s41556-019-0450-y. Epub 2020 Jan 13.

The LC3-conjugation machinery specifies the loading of RNA-binding proteins into extracellular vesicles

Affiliations

The LC3-conjugation machinery specifies the loading of RNA-binding proteins into extracellular vesicles

Andrew M Leidal et al. Nat Cell Biol. 2020 Feb.

Abstract

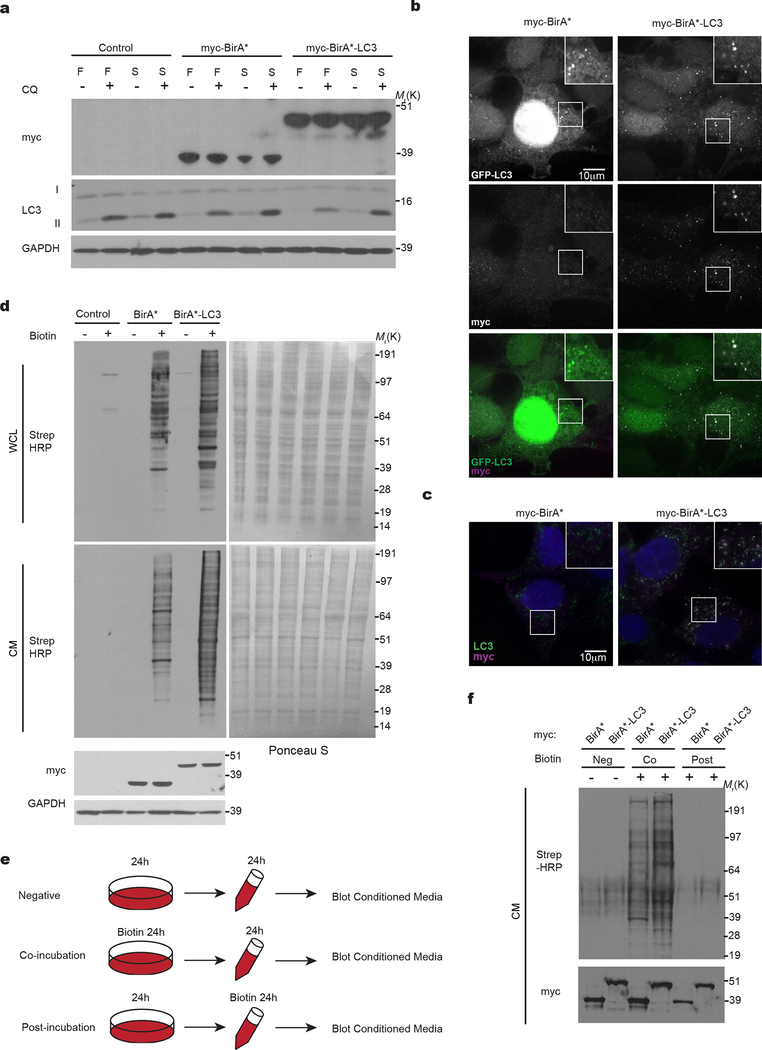
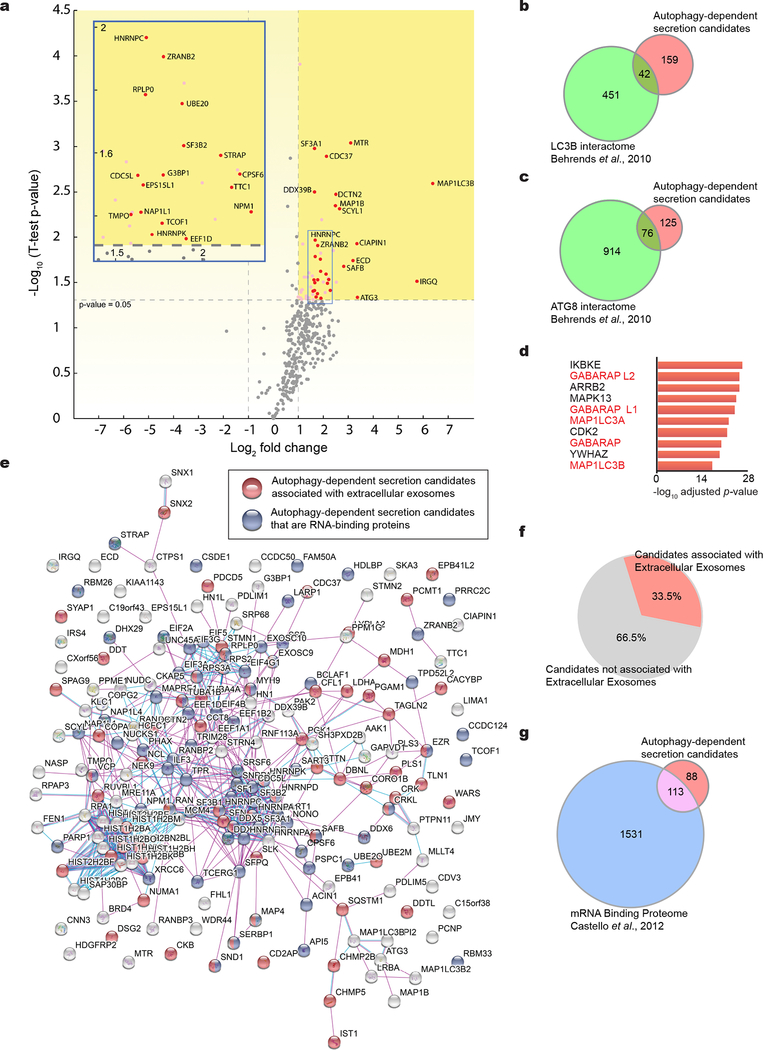
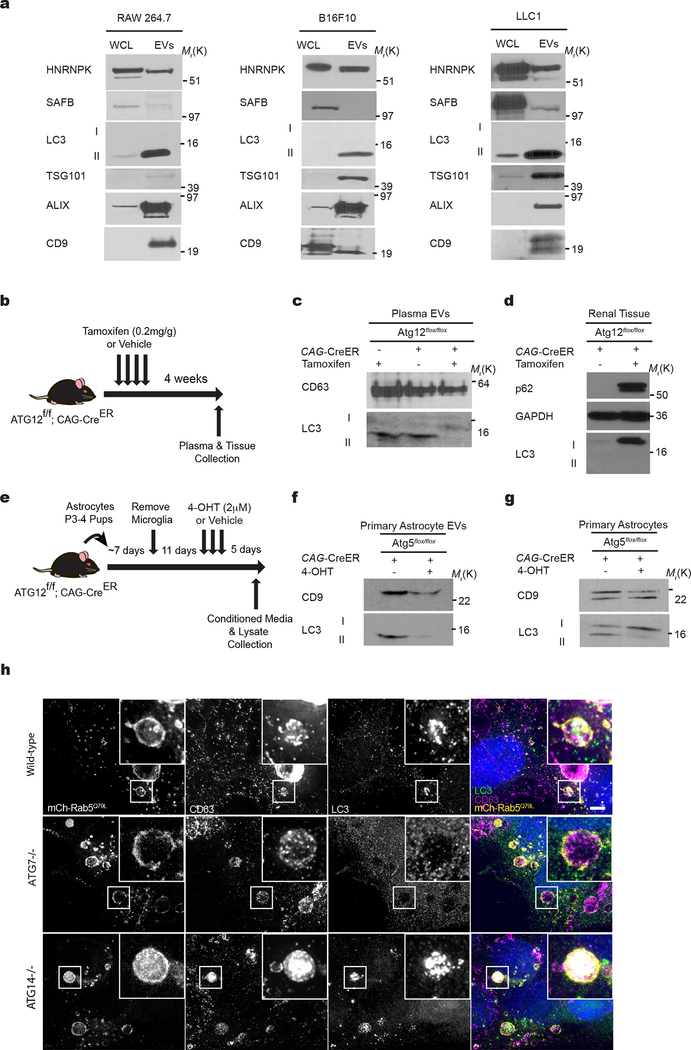
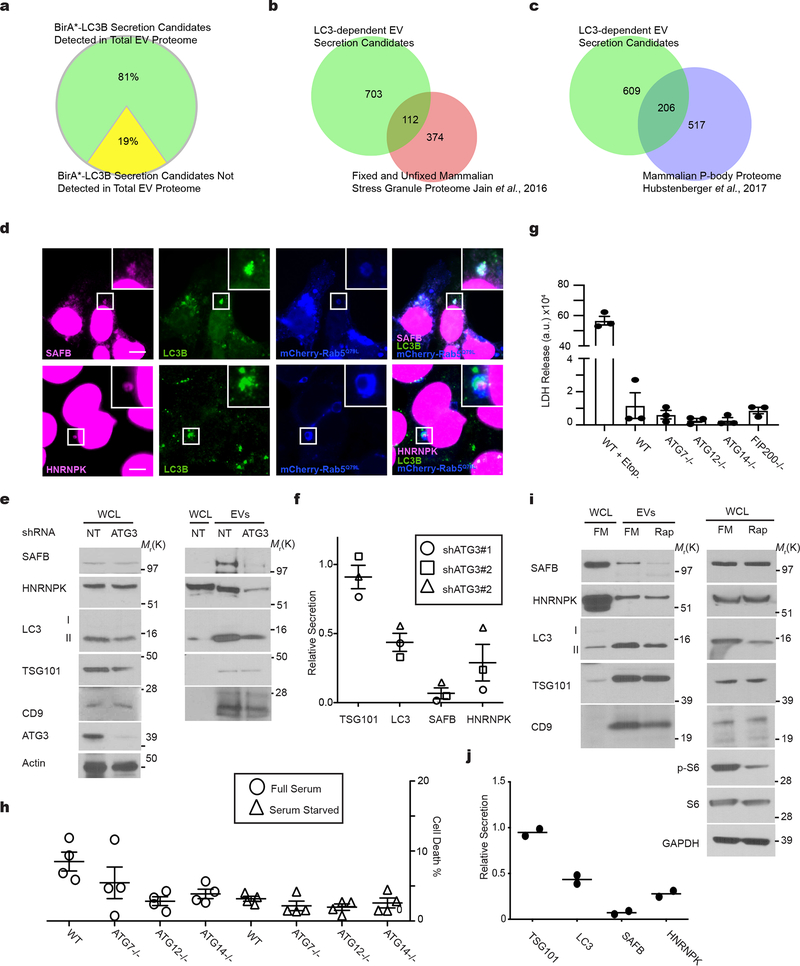
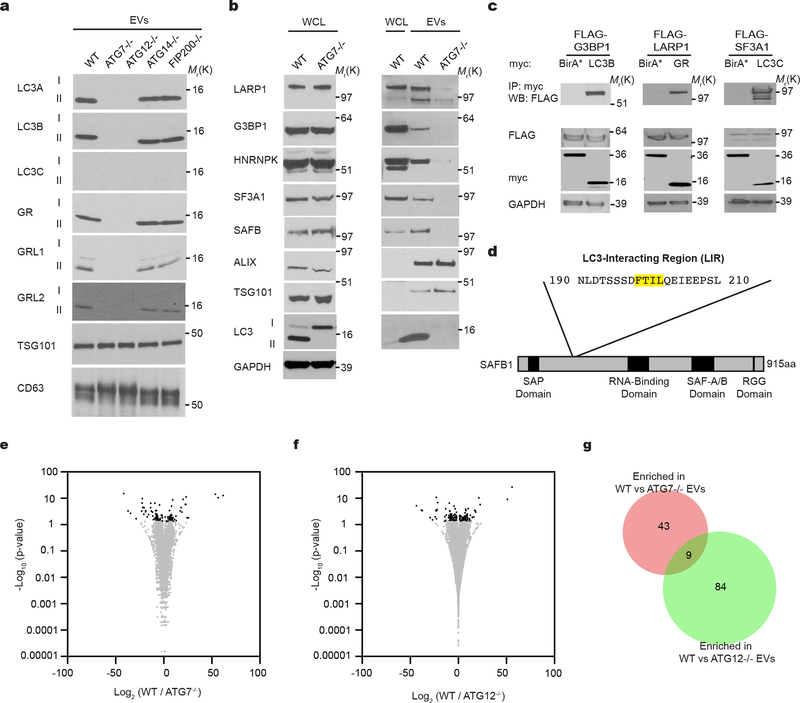
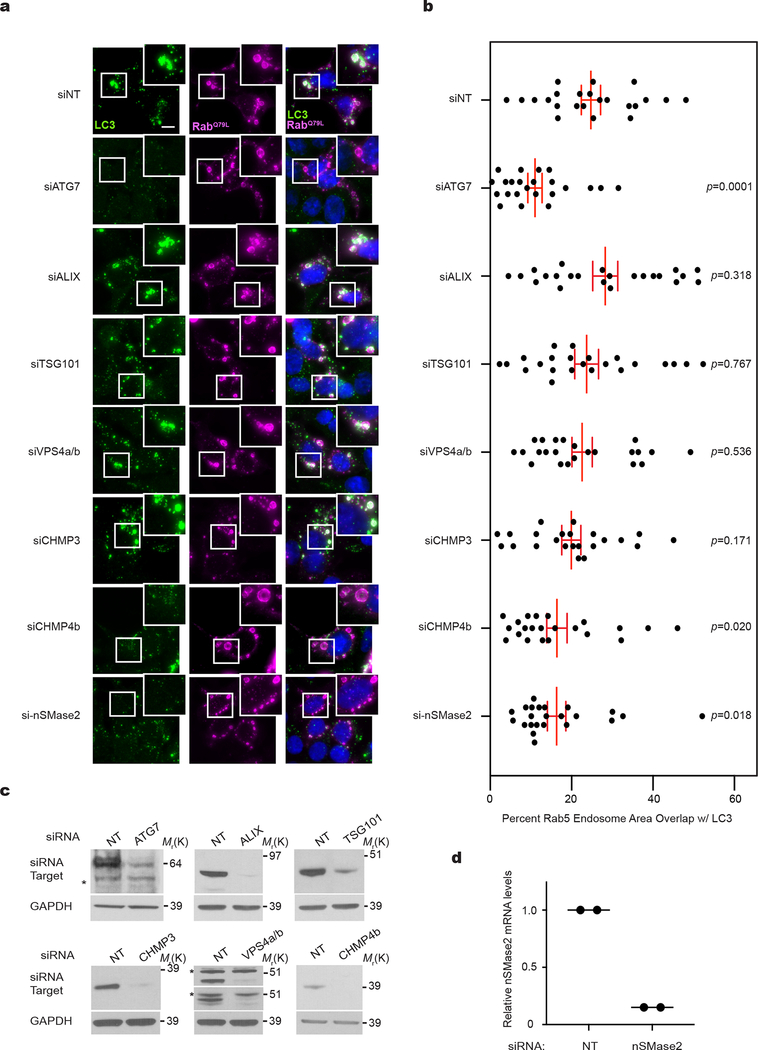
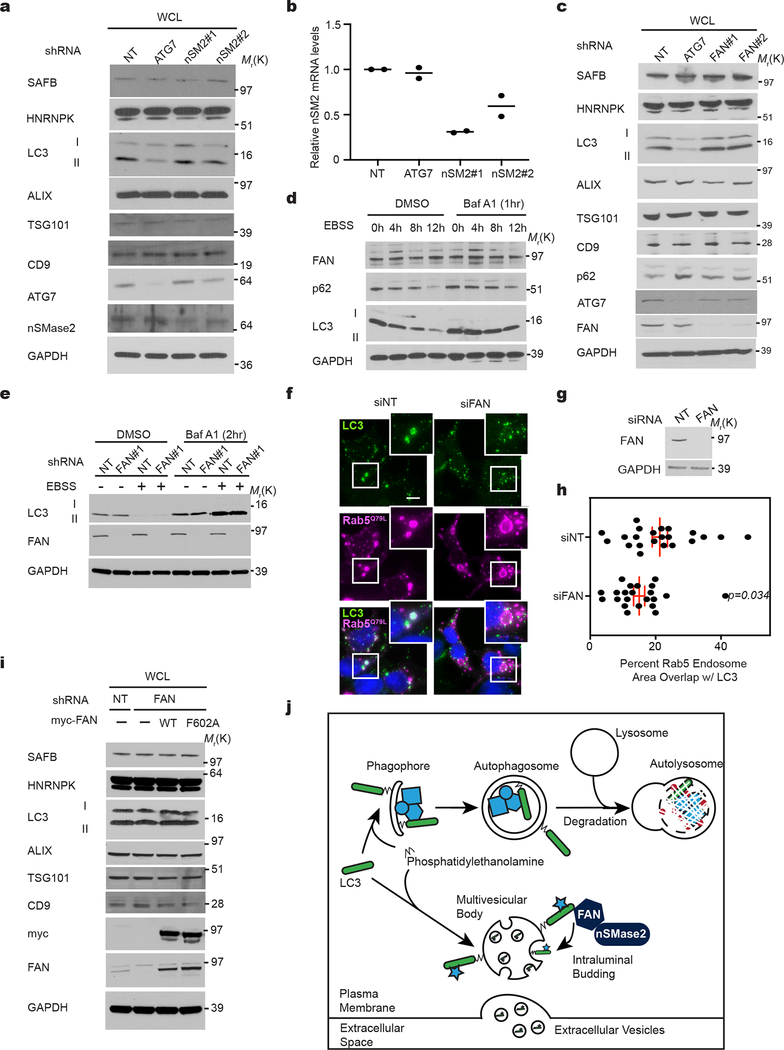
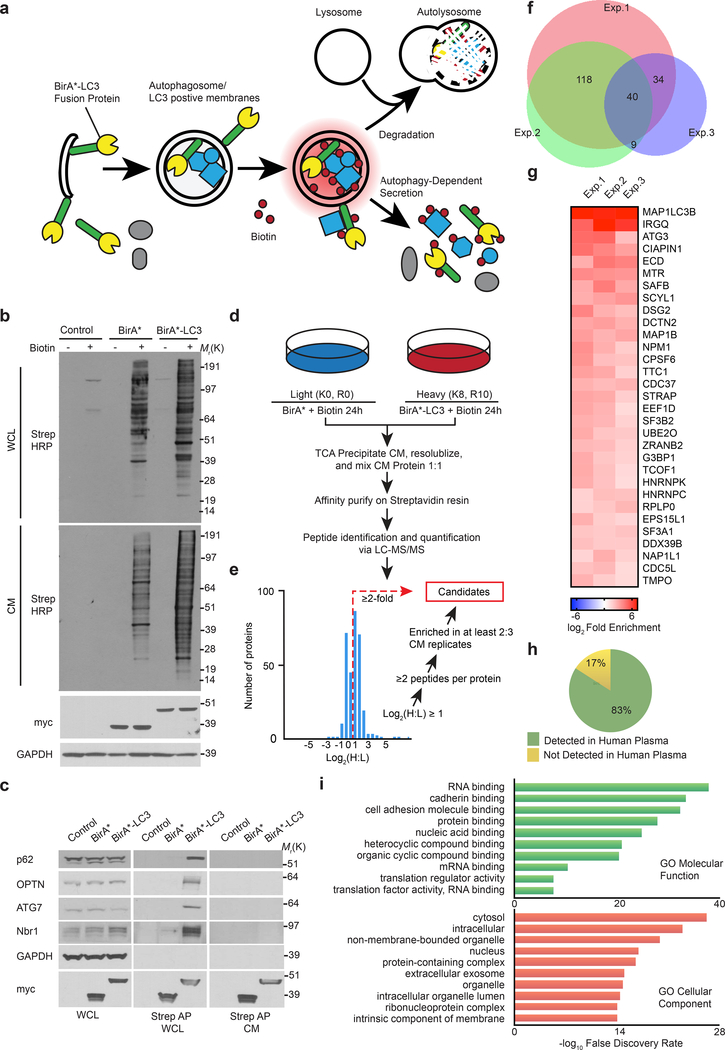
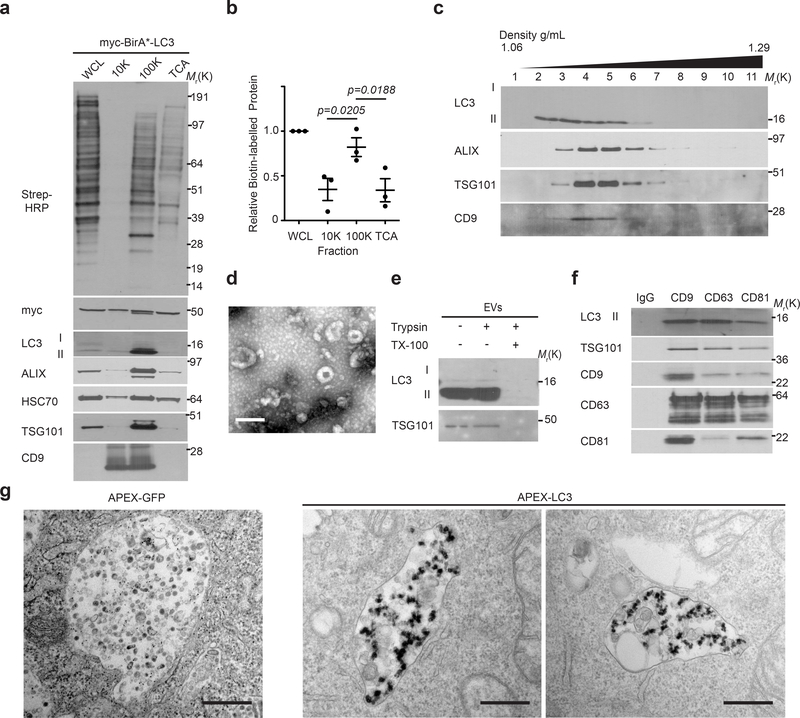
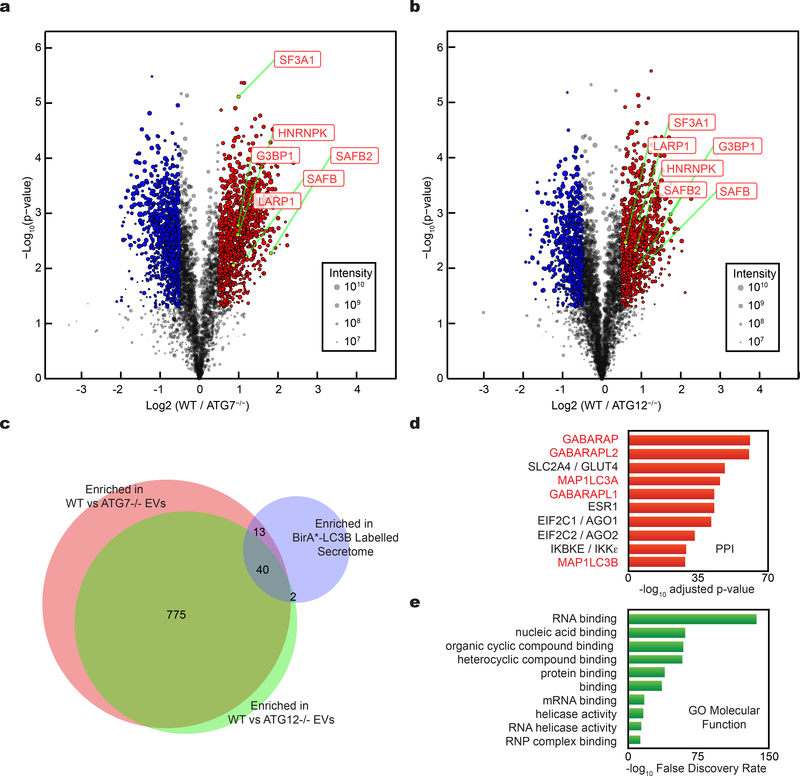
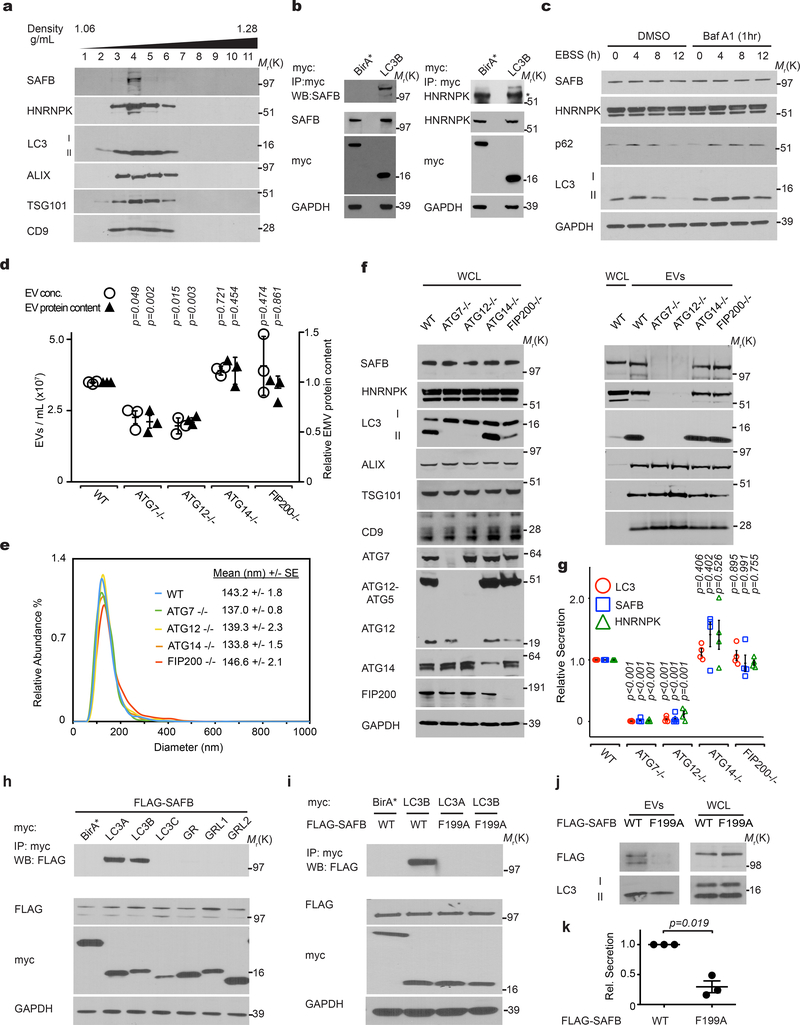
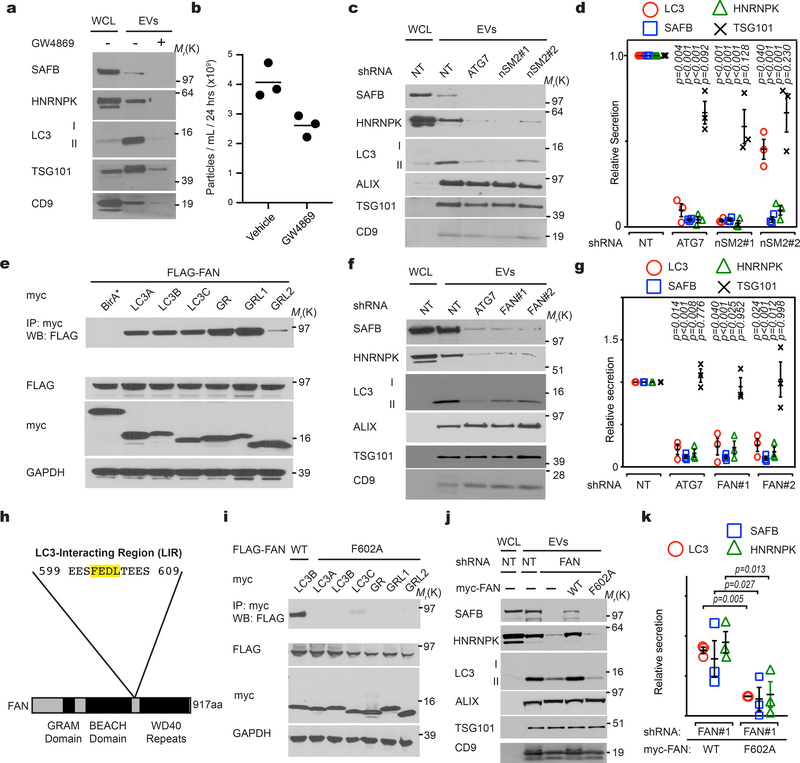
Traditionally viewed as an autodigestive pathway, autophagy also facilitates cellular secretion; however, the mechanisms underlying these processes remain unclear. Here, we demonstrate that components of the autophagy machinery specify secretion within extracellular vesicles (EVs). Using a proximity-dependent biotinylation proteomics strategy, we identify 200 putative targets of LC3-dependent secretion. This secretome consists of a highly interconnected network enriched in RNA-binding proteins (RBPs) and EV cargoes. Proteomic and RNA profiling of EVs identifies diverse RBPs and small non-coding RNAs requiring the LC3-conjugation machinery for packaging and secretion. Focusing on two RBPs, heterogeneous nuclear ribonucleoprotein K (HNRNPK) and scaffold-attachment factor B (SAFB), we demonstrate that these proteins interact with LC3 and are secreted within EVs enriched with lipidated LC3. Furthermore, their secretion requires the LC3-conjugation machinery, neutral sphingomyelinase 2 (nSMase2) and LC3-dependent recruitment of factor associated with nSMase2 activity (FAN). Hence, the LC3-conjugation pathway controls EV cargo loading and secretion.


Conflict of interest statement

Conflict of interest: JD is a Scientific Advisory Board Member for Vescor Therapeutics, LLC.

Figures

Extended Data Fig. 1:
Extended Data Fig. 1:. Functional validation of the BirA*-LC3 recombinant probe.
a, Cells stably expressing myc-BirA*-LC3, myc-BirA* or vector control were incubated in either full (F) or serum free media (S) for 4h in the absence or presence of 50 μM chloroquine (CQ) for the last 1h. Cells were lysed and subject to immunoblotting for indicated proteins (n=2 biologically independent experiments). b, Representative images of cells stably expressing GFP-LC3 and myc-BirA*-LC3 or myc-BirA* and immunostained with anti-myc antibody (n=3 biologically independent samples). c, Representative images of cells stably expressing myc-BirA*-LC3 or myc-BirA* and co-immunostained with anti-LC3 (green) and anti-myc (magenta) antibody (n=3 biologically independent samples). d, Biotinylation blots reproduced from Fig. 1b with accompanying Ponceau S stained membranes of whole cell lysate (WCL) and conditioned media (CM) (n=3 biologically independent experiments). e, Schematic of experiment to test for intracellular versus extracellular origin of BirA* and BirA*-LC3-mediated biotinylated targets isolated from CM. f, Representative Strep-HRP blot for biotinylated proteins in the precipitated CM from myc-BirA*-LC3 or myc-BirA* cells co-incubated (Co) or post-incubated (Post) with 50 μM biotin for 24h and negative control (Neg). CM was probed to validate expression and secretion of the myc-tagged recombinant proteins (n=2 biologically independent experiments). Unprocessed blots available in Source Data Extended Data Fig. 1.
Extended Data Fig. 2:
Extended Data Fig. 2:. BirA*-LC3B-labelled secretome is enriched in RBPs.
a, Volcano plot of BirA*-LC3-labeled secretome quantified by mass spectrometry. SILAC labelled biotin-tagged proteins plotted according to -log10 p-values as determined by two-tailed t-test and log2 fold enrichment (BirA*-LC3/BirA*) (n=3 biologically independent samples). Grey horizontal dotted line: significance cut-off with p-value of 0.05. Log2 fold change reflects LC3-BirA* to BirA* alone ratio. Grey vertical dotted line: 2-fold enriched and de-enriched cut-off. Pink: significantly enriched proteins relative to BirA* alone. Red: Class I enriched proteins represented in heat map in Figure 1. Inset: Expanded view of significantly enriched proteins. b, Venn diagram showing overlap of secretory autophagy candidates (Class I and II hits) with the LC3B intracellular interactome defined in Behrends et al. 2010. c, Venn diagram showing the overlap of secretory autophagy candidates (Class I and II hits) with the entire ATG8 intracellular interactome defined in Behrends et al. 2010. d, Ranked list of proteins with greatest connectivity to secretory autophagy candidates as determined by the Enrichr gene enrichment analysis tool (n=3 biologically independent samples; 200 enriched proteins in Class I + II datasets). Statistical significance calculated by one-way Fisher’s exact test and adjusted using the Benjamini–Hochberg method. LC3/ATG8 family members highlighted in red. e, Network map of autophagy-dependent secretion candidates. Class I and II secretory autophagy candidates mapped to zero-order protein interaction network using Search Tool for the Retrieval of Interacting Genes/Proteins (STRING) and proteins associated with extracellular exosomes or with RNA-binding functions coloured in red and blue, respectively. f, Pie chart plotting percentage of Class I and II secretory autophagy candidates assigned to Gene Ontology (GO) term extracellular exosome by PANTHER. g, Venn diagram showing overlap of class I and II secretory autophagy candidates with the mRNA binding proteins from Castello et al. 2012. Data available in Source Data Extended Data Fig. 2.
Extended Data Fig. 3:
Extended Data Fig. 3:. Endogenous LC3-II is secreted within EVs isolated from cultured cells and murine plasma.
a, Whole cell lysate (WCL) and extracellular vesicle lysates (EVs) from murine RAW264.7 macrophages treated with 100 ng/ml LPS for 24h and 20 μM nigericin for 1 h, murine B16F10 melanoma cells, and murine LLC1 cells were immunoblotted for LC3, SAFB, HNRNPK and extracellular vesicle marker proteins (n=2 biologically independent experiments). b, Workflow employed to obtain plasma and tissue from CAG-CreER;Atg12flox/flox mice in which Atg12 was systemically deleted via tamoxifen treatment. c, Extracellular vesicles (EVs) isolated from the plasma of naïve wild-type mice (CAG-CreER or Atg12flox/flox) and mice in which Atg12 was systemically deleted by 4-OHT treatment (CAG-CreER; Atg12flox/flox) were lysed and immunoblotted for LC3 and the indicated extracellular vesicle marker proteins (n=2 biologically independent experiments). d, Whole cell lysates (WCL) derived from the renal tissue of mice in Panel c were immunoblotted for LC3 and the indicated marker proteins (n=2 biologically independent experiments). e, Workflow employed to obtain CM from murine astrocytes (CAG-CreER;Atg5flox/flox) in which Atg12 was deleted ex vivo via 4-OHT treatment. f, Extracellular vesicles (EVs) isolated from the conditioned media of naive wild-type (Atg5flox/flox) primary astrocytes and astrocyte cultures in which Atg12 was deleted ex vivo (CAG-CreER; Atg5flox/flox) by 4-OHT treatment were lysed and immunoblotted for LC3 and CD9 (n=2 biologically independent experiments). g, Whole cell lysates (WCL) primary astrocyte cultures in Panel d were immunoblotted for LC3 and CD9 (n=2 biologically independent experiments). h, Representative fluorescence micrographs from wild-type, ATG7−/− and ATG14−/− HEK293T cells transfected with mCherry-Rab5Q79L (yellow). Cells were immunostained for endogenous LC3 (green) and CD63 (magenta) (n=3 biologically independent samples). Scale bar=10μm. Unprocessed blots available in Source Data Extended Data Fig. 3.
Extended Data Fig. 4:
Extended Data Fig. 4:. Components of stress granules and P-bodies secreted in EVs through mechanisms requiring the LC3-conjugation machinery.
a, Proportion of BirA*-LC3B- labelled secretome (Class I, II candidates) detected in the total extracellular vesicle (EV) proteome defined by TMT quantitative mass spectrometry. b, Venn diagram showing overlap of EV components requiring ATG7 and ATG12 for secretion with the fixed and unfixed stress granule proteome from Jain et al., 2016. c, Venn diagram showing the overlap of EV components requiring ATG7 and ATG12 for secretion with the P-body proteome from Hubstenberger et al., 2017. d, Representative fluorescence micrographs from wild-type HEK293T cells transfected with mCherry-Rab5Q79L (blue) and immunostained for endogenous LC3 (green) and SAFB or HNRNPK (magenta) (n=3 biologically independent samples). Scale bar=10μm. e, Whole cell (WCL) and EV lysates harvested from equal numbers of cells stably expressing non-targeting (NT) or ATG3 shRNA were immunoblotted for indicated proteins (n=3 biologically independent samples). f, Quantification of indicated protein levels in EVs from cells stably expressing shRNAs targeting ATG3 relative to non-targeting shRNA (mean ±s.e.m.; n=3 biologically independent samples). g, Quantification of Lactate Dehydrogenase (LDH) in EV-depleted conditioned media from wild-type (WT) HEK293T cells treated 100 μM Etoposide (Etop) for 24h or WT and ATG knockout cells serum starved for 24h (mean ±s.e.m.; n=3 biologically independent experiments). h, Cell death in wild-type (WT) and ATG knockout cells (KO) after 24h in full serum media (FM) or serum starved media (SS) quantified using Calcein-AM and ethidium bromide staining (mean ±s.e.m.; n=3 biologically independent experiments). i, Whole cell and EV lysates from wild-type cells grown in EV-depleted full serum media (FM) or EV-depleted FM with 100 nM Rapamycin (Rap) for 24h. Immunoblots probed against the indicated proteins (n=2 biologically independent experiments). j, Quantification of the relative levels of indicated proteins in EVs from Rap-treated cells in Panel d (line=mean; n=2 biologically independent experiments ). Data and unprocessed blots available in Source Data Extended Data Fig. 4.
Extended Data Fig. 5:
Extended Data Fig. 5:. LC3-conjugation machinery controls EV-mediated secretion of diverse RBPs.
a, EVs from WT and ATG deficient cells normalized for protein concentration and immunoblotted to detect endogenous LC3A, LC3B, LC3C, GABARAP (GR), GABARAPL1 (GRL1), GABARAPL2 (GRL2), and indicated marker proteins (n=2 biologically independent experiments). b, Whole cell (WCL) and EV lysates from WT and ATG7−/− cells were normalized for protein concentration and immunoblotted for indicated proteins (n=3 biologically independent experiments). c, HEK293T cells co-transfected with FLAG-tagged G3BP1, LARP1 or SF3A1, and myc-tagged LC3B, GABARAP (GR), LC3C respectively, or myc-BirA* were lysed, immunoprecipitated (IP) with anti-myc antibody and immunoblotted (WB) with indicated antibodies (n=3 biologically independent experiments). d, Diagram mapping the domains and primary LC3-interaction region (LIR) in SAFB. e, Volcano plot of mRNA and long non-coding RNA (large RNA) detected in EVs from WT and ATG7−/− cells. Results plotted according to -log10 p-values as determined by DESeq2 and log2 fold enrichment (n=3 biologically independent samples; WT/ATG7−/−). Grey dots: RNAs not enriched in EVs from WT or ATG7−/− cells identified with a p-value >0.05 and/or log2 fold change between −0.5 and 0.5 (−0.5<log2FC<0.5). Black dots: Large RNAs enriched in EVs from WT cells or ATG7−/− cells. f, Volcano plot of mRNA and long non-coding RNA (large RNA) detected in EVs from WT and ATG12−/− cells. Results plotted according to -log10 p-values as determined by DESeq2 and log2 fold enrichment (n=3 biologically independent samples; WT/ATG12−/−). Grey dots: RNAs not enriched in EVs from WT or ATG12−/− cells identified with a p-value >0.05 and/or log2 fold change between −0.5 and 0.5 (−0.5<log2FC<0.5). Black dots: Large RNAs enriched in EVs from WT or ATG12−/− cells. g, Venn diagram showing the overlap of mRNA and long non-coding RNAs (large RNAs) enriched in EVs from WT relative to ATG7−/− cells and EVs from WT relative to ATG12−/− cells. Data and unprocessed blots available in Source Data Extended Data Fig. 5.
Extended Data Fig. 6:
Extended Data Fig. 6:. LC3 delivery into ILVs of Rab5Q79L endosomes requires CHMP4b and nSMase2, but is independent of other ESCRT machinery components.
a, Representative fluorescence micrographs from wild-type HEK293T cells co-transfected with mCherry-Rab5Q79L (magenta) and non-targeting (NT) control siRNA or siRNAs targeting ATG7, ALIX, TSG101, VPS4a/b, CHMP3, CHMP4b and nSMase2. Cells were immunostained for endogenous LC3 (green) (n=2 biologically independent experiments). Scale bar=10μm. b, Scatter plot of the proportion of mCherry-Rab5Q79L endosomes that overlap with LC3 in immuno-stained cells in Panel a (mean ± s.e.m.; n=23 biologically independent samples). Statistical significance calculated by one-way ANOVA coupled with Fisher’s least significant difference test. c, Lysates from cells in Panel a were immunoblotted with antibodies the various siRNA targets and GAPDH as a loading control. Representative blots are shown (n=2 biologically independent experiments). Non-specific bands are indicated with an asterisk (*). d, Quantitative PCR (QPCR) measurement of nSMase2 mRNA in HEK293T cells transfected with siRNAs targeting nSMase2, nSMase2 (nSM2) relative to non-targeting siRNA (NT) control cells (line=mean; n=1, 2 technical replicates). Data and unprocessed blots available in Source Data Extended Data Fig. 6.
Extended Data Fig. 7:
Extended Data Fig. 7:. LC3-dependent EV loading and secretion (LDELS) requires FAN and nSMase2.
a, Whole cell lysate harvested from equal numbers of HEK293Ts stably expressing non-targeting (NT), ATG7 or nSMase2(nSM2) shRNAs immunoblotted for indicated proteins (n=2 biologically independent experiments). b, Quantitative PCR (QPCR) for nSMase2 mRNA in HEK293Ts stably expressing shRNAs targeting ATG7, nSMase2 (nSM2) relative to non-targeting shRNA (NT) control cells (line=mean; n=1, 2 technical replicates). c, Whole cell lysates from HEK293Ts stably expressing non-targeting shRNA (NT) or shRNAs targeting ATG7 or FAN were immunoblotted with antibodies for the indicated proteins (n=2 biologically independent experiments). d, HEK293Ts were EBSS starved for the indicated times, treated with DMSO or 50nM Bafilomycin A1 (Baf A1) for 1 h prior to lysis, lysed and immunoblotted for FAN and the indicated proteins (n=2 biologically independent experiments). e, HEK293Ts expressing non-targeting (NT) or FAN shRNA were starved in EBSS for 4h, treated with DMSO or 50nM Bafilomycin A1 (Baf A1) for 1h prior to lysis, lysed and immunoblotted for the indicated proteins (n=2 biologically independent experiments). f, Representative fluorescence micrographs from wild-type cells co-transfected with mCherry-Rab5Q79L (magenta) and non-targeting (NT) control siRNA or siRNAs targeting FAN. Cells were immunostained for endogenous LC3 (green)(n=2 biologically experiments). Scale bar=10μm. g, Lysates from cells in Panel f were immunoblotted with antibodies against FAN and GAPDH as a loading control (n=2 biologically independent experiments). h, Scatter plot of the proportion of mCherry-Rab5Q79L endosomes overlapping with LC3 in immuno-stained cells in Panel f (mean ±s.e.m.; n=22 biologically independent samples). Statistical significance calculated by unpaired two-tailed t-test. i, Whole cell lysate from HEK293Ts analysed in Fig. 7j that were co-expressing non-targeting (NT) or FAN shRNA along with FLAG-tagged wild-type FAN (WT) or mutant FAN (F199A) were immunoblotted for the indicated proteins (n=2 biologically independent experiments). j, Proposed model for LC3-dependent EV loading and secretion (LDELS) in comparison to classical autophagy. Data and unprocessed blots available in Source Data Extended Data Fig. 7.
Figure 1.
Figure 1.. Identification of proteins secreted via autophagy-dependent pathways using LC3 proximity-dependent biotinylation and quantitative secretomics.
a, Proximity-dependent biotinylation strategy to label secretory autophagy targets. b, Protein biotinylation in whole cell lysate (WCL, intracellular) and conditioned media (CM, secreted) harvested from HEK293T cells stably expressing myc-BirA*-LC3, myc-BirA* or empty vector (Control) following 24h incubation with (+) or without (−) 50 μM biotin. Equal amounts of protein from trichloroacetic acid precipitated CM or WCL were probed with Streptavidin-HRP (Strep-HRP) to detect biotinylated proteins, myc or GAPDH (n=3 biologically independent experiments). c, Streptavidin affinity purification (Strep AP) and immunoblotting to detect known LC3-interacting proteins within WCL and CM of cells expressing myc-BirA*-LC3 (n=2 biologically independent experiments). d, Autophagy-dependent secretion substrate enrichment and quantitative secretomics workflow. e, Log2(H:L) histogram for CM proteins identified in bioreplicate #2 and scheme for identification of autophagy-dependent secretion candidates. f, Putative secretory autophagy candidates identified in n=3 independent experiments (Exp.). Among the 40 hits enriched in all three experiments, 31 were statistically significant overall (see Extended Data Fig. 2) and classified as Class I candidates. The remaining proteins along with hits enriched in 2 out of n=3 experiments (170 proteins total) were designated Class II candidates. Full list of candidates provided in Supplementary Table 1. g, Log2(BirA*-LC3:BirA*) heat map of Class I candidates. h, Proportion of secreted candidates (Class I, II) detected in human plasma. i, Gene Ontology (GO) enrichment analysis of secreted candidates (Class I, II) with the top terms for molecular function and cellular component plotted according to -log10 False Discovery Rate. Statistical significance was calculated by one-way Fisher’s exact test. Sample size, n=3 independent biological replicates, yielding 200 enriched proteins in the Class I + Class II datasets. Data and unprocessed blots available in Source Data Fig. 1.
Figure 2.
Figure 2.. LC3-II and BirA*-LC3 biotinylated targets are secreted within EVs.
a, Protein biotinylation in whole cell lysates (WCL, intracellular) and fractionated conditioned media (CM) harvested from BirA*-LC3 HEK293T cells incubated with 50 μM biotin for 24h. CM subject to differential ultracentrifugation to recover large extracellular vesicles (10,000g; 10K), small extracellular vesicles (100,000g; 100K), and precipitated free soluble protein (TCA). Equal amounts of protein from WCL and fractionated CM probed with Streptavidin-HRP (Strep-HRP) or antibodies for the indicated extracellular vesicle marker proteins, LC3 and myc-tagged BirA*-LC3 (n=3 biologically independent replicates). b, Quantification of global protein biotinylation in the indicated fractions of CM relative to WCL (mean ± s.e.m.; n=3 biologically independent experiments). Statistical significance between CM fractions calculated by one-way analysis of variance (ANOVA) coupled with Tukey’s post hoc test. c, EVs from CM separated via linear sucrose density gradient ultracentrifugation, fractionated and immunoblotted to detect endogenous levels of the indicated markers and LC3 (n=3 biologically independent experiments). d, Representative transmission electron micrograph of EVs isolated via differential ultracentrifugation (n=3 biologically independent samples). Scale bar= 200nm. e, Representative immunoblots of indicated proteins from untreated EVs or EVs incubated with 100 μg/ml trypsin and/or 1% Triton X-100 (TX-100) for 30 min at 4°C (n=3 biologically independent experiments). f, Representative immunoblots of EVs immuno-purified from concentrated CM fractions using antibodies targeting the tetraspanins CD9, CD63, CD81 or a normal mouse IgG isotype control and immunoblotted to detect endogenous levels of the indicated markers and LC3 (n=3 biologically independent experiments). g, Representative transmission electron micrographs of normal rat kidney epithelial cells expressing an APEX2-LC3 recombinant fusion protein of APEX2-GFP control and stained with 3,3-diaminobenzidine (DAB) and hydrogen peroxide (H2O2) (n=3 biologically independent samples). Scale bar=500nm. Data and unprocessed blots available in Source Data Fig. 2.
Figure 3.
Figure 3.. Endogenous LC3 localizes with endosomes and EV-associated tetraspanins.
a, Representative fluorescence micrographs from WT, ATG7−/−, and ATG14−/− HEK293T cells transfected with mCherry-Rab5Q79L (magenta). Cells were immunostained for endogenous LC3 (green) (n=3 biologically independent experiments). Scale bar=10μm. b, Representative fluorescence micrographs from wild-type, ATG7−/− and ATG14−/− cells immunostained for endogenous LC3 (green) and CD63 (magenta) (n=3 biologically independent experiments). Scale bar=10μm. c, Scatter plot of p-values obtained from Costes significance tests to assess whether the overlap of LC3 and CD63 staining observed in Panel b exceeds thresholds of random co-occurrence. Statistical significance calculated by one-way ANOVA coupled with Tukey’s post hoc (mean ± s.e.m.; WT, n=28; ATG7−/−, n=33; ATG14−/−, n=27 biologically independent samples). d, Scatter plot of Mander’s coefficients for co-occurrence of LC3 with CD63 in immuno-stained cells in Panel b. Statistical significance calculated by unpaired two-tailed t-test (mean ± s.e.m.; WT, n=27; ATG14−/−, n=27 biologically independent samples). Numerical data available in Source Data Fig. 3.
Figure 4.
Figure 4.. Tandem mass tag (TMT) quantitative secretomics identifies EV proteins secreted via the LC3-conjugation machinery.
a, Volcano plot of proteins identified within EVs from wild-type (WT) and ATG7−/− HEK293T cells quantified by TMT mass spectrometry. TMT labelled proteins plotted according to their -log10 p-values as determined by two-tailed t-test and log2 fold enrichment (WT/ATG7−/−; n=4 biologically independent samples). Grey dots: Proteins not relatively enriched in EVs from WT or ATG7−/− cells identified with p-value >0.05 and/or log2 fold change between −0.5 and 0.5 (−0.5<log2FC<0.5). Red dots: Proteins significantly enriched in EVs from WT cells relative to ATG7−/− cells. Blue dots: Proteins significantly enriched in EVs from ATG7−/− cells relative to WT cells. Dot size proportional to sum of the signal intensity for identified proteins. b, Volcano plot of proteins identified within EVs from WT and ATG12−/− cells. TMT labelled proteins according to their -log10 p-values as determined by two-tailed t-test and log2 fold enrichment (WT/ATG12−/−; n=4 biologically independent samples). Grey dots: Proteins not relatively enriched in EVs from WT or ATG7−/− cells identified with p-value >0.05 and/or log2 fold change between −0.5 and 0.5 (−0.5<log2FC<0.5). Red dots: Proteins significantly enriched in EVs from WT cells relative to ATG12−/− cells. Blue dots: Proteins significantly enriched in EVs from ATG12−/− cells relative to WT cells. Dot size proportional to sum of the signal intensity for identified proteins. c, Venn diagram showing overlap of proteins enriched in EVs from WT cells relative to ATG7−/− cells, EVs from WT cells relative to ATG12−/− cells, and proteins enriched within the BirA*-LC3B labelled secretome. d, Ranked list of proteins with greatest connectivity to the 815 proteins enriched in EVs from WT cells relative to ATG7−/− and ATG12−/− cells. Statistical significance calculated in Enrichr by one-way Fisher’s exact test and adjusted using the Benjamini–Hochberg method. LC3/ATG8 family members highlighted in red. e, Gene Ontology (GO) enrichment analysis of 815 proteins enriched in EVs from WT cells relative to ATG7−/− and ATG12−/− cells with the top terms for molecular function plotted according to -log10 False Discovery Rate. Statistical significance calculated by one-way Fisher’s exact test. Data available in Source Data Fig. 4.
Figure 5.
Figure 5.. LC3-conjugation machinery is required for EV loading and secretion of SAFB and HNRNPK.
a, EVs from HEK293T CM separated via linear sucrose density gradient fractionation were immunoblotted to detect endogenous levels of indicated markers (n=2 biologically independent experiments). b, HEK293T cells transfected with myc-tagged LC3B or myc-BirA* were lysed, immunoprecipitated (IP) with anti-myc antibody, and immunoblotted with indicated antibodies (n=3 biologically independent experiments). c, Cells were EBSS starved for the indicated times, lysed and immunoblotted for the indicated proteins. Baf A1=50nM Bafilomycin A1 for 1h prior to lysis (n=2 biologically independent experiments). d, CM from equal numbers of indicated cell types subject to nanoparticle tracking analysis (open circles, left axis) to determine EV number or relative protein content measured using BCA from 100,000g EV fractions (black triangles, right axis). (mean ± s.e.m.; n=3 biologically independent experiments). Statistical significance calculated by one-way ANOVA coupled with Dunnett’s test. e, EV size distribution from a representative experiment for the indicated cell types in Panel d (SE=standard error; n=3 biologically independent experiments). f, WCL and 100,000g EV fractions harvested from indicated cell types were collected, normalized for protein concentration, and immunoblotted to detect indicated proteins at endogenous levels (n=4 biologically independent experiments). g, Quantification of LC3 (red circles), SAFB (blue squares), and HNRNPK (green triangles) levels in EVs from the indicated ATG−/− cell lines relative to WT (mean ± s.e.m.; n=4 biologically independent experiments). Statistical significance calculated by one-way ANOVA coupled with Tukey’s post hoc test. h, HEK293T cells co-transfected with FLAG-tagged SAFB and myc-tagged LC3A, LC3B, LC3C, GABARAP (GR), GABARAPL1 (GRL1), GABARAPL2 (GRL2) or myc-BirA* were lysed, immunoprecipitated (IP) with anti-myc antibody and immunoblotted with indicated antibodies (n=2 biologically independent experiments). i, Cells co-transfected with FLAG-tagged wild-type SAFB (WT) or mutant SAFB (F199A) and myc-tagged LC3A, LC3B or myc-BirA* were lysed, immunoprecipitated (IP) with anti-myc antibody and immunoblotted with indicated antibodies (n=2 biologically independent experiments). j, Whole cell lysate (WCL) and EVs harvested from cells expressing WT or LIR mutant SAFB (F199A) were collected and immunoblotted for FLAG-SAFB and LC3 (n=3 biologically independent experiments). k, Quantification WT and LIR mutant SAFB (F199A) secretion in EVs from cells (mean ± s.e.m.; n=3 biologically independent experiments). Statistical significance calculated by paired two-tailed t-test. Data and unprocessed blots available in Source Data Fig. 5.
Figure 6.
Figure 6.. LC3-dependent EV loading and secretion (LDELS) regulates the small non-coding RNA composition of EVs.
a, Proportion of RNA sequencing (RNA-seq) reads in total cellular RNA from WT, ATG7−/− and ATG12−/− HEK293T cells from the different classes of small non-coding RNA (n=3 biologically independent samples). b, Proportion of RNA-seq reads in total EV RNA from WT, ATG7−/− and ATG12−/− HEK293T cells from the different classes of small non-coding RNA (n=3 biologically independent samples). c, Volcano plot of small non-coding RNAs detected in EVs from WT and ATG7−/− cells quantified by RNA-seq. Results plotted according to -log10 p-values as determined by DESeq2 and log2 fold enrichment (n=3 biologically independent samples; WT/ATG7−/−). Grey dots: RNAs identified with p-value >0.05 and/or log2 fold change between −0.5 and 0.5 (−0.5<log2FC<0.5), and thus, not relatively enriched in EVs from WT or ATG7−/− cells. Log2 fold change reflects WT EV RNA/WT Cell RNA to ATG7−/− EV RNA/ATG7−/− Cell RNA ratio. Black dots: Small non-coding RNAs significantly enriched in EVs from WT or ATG7−/− cells. Red dots: snoRNAs significantly enriched in EVs from WT or ATG7−/− cells. d, Volcano plot of small non-coding RNAs detected in EVs from WT and ATG12−/− cells quantified by RNA-seq. Results were plotted according to -log10 p-values as determined by DESeq2 and log2 fold enrichment (n=3 biologically independent samples; WT/ATG12−/−). Grey dots: RNAs with a p-value >0.05 and/or log2 fold change between −0.5 and 0.5 (−0.5<log2FC<0.5), and thus, not relatively enriched in EVs from WT or ATG12−/− cells. Log2 fold change reflects WT EV RNA/WT Cell RNA to ATG12−/− EV RNA/ATG12−/− Cell RNA ratio. Black dots: Small non-coding RNAs significantly enriched in EVs from WT or ATG12−/− cells. Red dots: snoRNAs significantly enriched in EVs from WT or ATG12−/− cells. e, Venn diagram showing overlap of small non-coding RNAs enriched in EVs from WT cells relative to ATG7−/− or ATG12−/− cells. f, Proportion of different classes of small RNAs enriched in EVs from WT vs. ATG-deficient cells. g, Heatmap of the 67 snoRNAs enriched in EVs from WT cells across all genetic conditions and sample types. Scale indicates intensity, defined as Δ(read counts -mean read count)/SD. Data available in Source Data Fig. 6.
Figure 7.
Figure 7.. LC3-dependent EV loading and secretion (LDELS) requires neutral sphingomyelinase 2 (nSMase2) and FAN.
a, Whole cell (WCL) and EV lysates from cells treated in the absence or presence of 5μM GW4869 for 24h and immunoblotted for the indicated marker proteins (n=2 biologically independent experiments). b, Nanoparticle counting for a representative experiment in Panel a (line=mean; n=1, 3 technical replicates). c, Whole cell (WCL) and EV lysates harvested from equal numbers of HEK293T cells stably expressing non-targeting (NT), ATG7 or nSMase2 (nSM2) shRNAs were immunoblotted for indicated proteins (n=3 biologically independent experiments). d, Quantification of indicated protein levels in EVs from equal numbers of stable knockdown cells in Panel c relative to non-targeting (NT) shRNA (mean ±s.e.m.; n=3 biologically independent experiments). Statistical significance calculated by one-way analysis of variance (ANOVA) coupled with Tukey’s post hoc. e, HEK293T cells co-transfected with FLAG-tagged FAN and myc-tagged LC3A, LC3B, LC3C, GABARAP (GR), GABARAPL1 (GRL1), GABARAPL2 (GRL2) or myc-BirA* were lysed, immunoprecipitated (IP) with anti-myc antibody, and immunoblotted (WB) with indicated antibodies (n=2 biologically independent experiments). f, Whole cell (WCL) and extracellular vesicle (EV) lysates harvested from equal numbers of HEK293T cells stably expressing non-targeting (NT), ATG7 or FAN shRNAs were immunoblotted for indicated proteins (n=3 biologically independent experiments). g, Quantification of indicated protein levels in EVs from equal numbers of stable knockdown cells in Panel c relative to non-targeting (NT) shRNA (mean ± s.e.m.; n=3 biologically independent experiments). Statistical significance calculated by one-way ANOVA coupled with Tukey’s post hoc test. h, Domain map and primary LC3-interaction region (LIR) in FAN. i,, Cells co-transfected with FLAG-tagged FAN and myc-tagged LC3A, LC3B, LC3C, GABARAP (GR), GABARAPL1 (GRL1), GABARAPL2 (GRL2) or myc-BirA* were lysed, immunoprecipitated (IP) with anti-myc antibody, and immunoblotted (WB) with indicated antibodies (n=2 biologically independent experiments). j, Whole cell lysate (WCL) and EV fractions from cells stably co-expressing non-targeting (NT) or FAN shRNA along with FLAG-tagged wild-type FAN (WT) or mutant FAN (F602A) were immunoblotted for indicated markers (n=2 biologically independent experiments). k, Quantification of indicated proteins in EVs from equal numbers of FAN knockdown HEK293T cells expressing FLAG-tagged wild-type FAN (WT) versus mutant FAN (F602A) (mean ± s.e.m.; n=3 biologically independent experiments). Statistical significance calculated by paired two-tailed t-test. Data and unprocessed blots available in Source Data Fig. 7.

Comment in

References

    1. Kaur J & Debnath J Autophagy at the crossroads of catabolism and anabolism. Nat Rev Mol Cell Biol 16, 461–472 (2015). - PubMed
    1. Lock R, Kenific CM, Leidal AM, Salas E & Debnath J Autophagy-dependent production of secreted factors facilitates oncogenic RAS-driven invasion. Cancer Discov 4, 466–479 (2014). - PMC - PubMed
    1. Bel S et al. Paneth cells secrete lysozyme via secretory autophagy during bacterial infection of the intestine. Science 357, 1047–1052 (2017). - PMC - PubMed
    1. DeSelm CJ et al. Autophagy proteins regulate the secretory component of osteoclastic bone resorption. Dev Cell 21, 966–974 (2011). - PMC - PubMed
    1. Guo H et al. Atg5 Disassociates the V1V0-ATPase to Promote Exosome Production and Tumor Metastasis Independent of Canonical Macroautophagy. Dev Cell 43, 716–730 e717 (2017). - PubMed

Materials and Methods References

    1. Pear WS, Scott ML & Nolan GP Generation of high-titer, helper-free retroviruses by transient transfection. Methods Mol Med 7, 41–57 (1997). - PubMed
    1. Roux KJ, Kim DI, Raida M & Burke B A promiscuous biotin ligase fusion protein identifies proximal and interacting proteins in mammalian cells. J Cell Biol 196, 801–810 (2012). - PMC - PubMed
    1. Cox J & Mann M MaxQuant enables high peptide identification rates, individualized p.p.b.-range mass accuracies and proteome-wide protein quantification. Nat Biotechnol 26, 1367–1372 (2008). - PubMed
    1. Tyanova S et al. The Perseus computational platform for comprehensive analysis of (prote)omics data. Nat Methods 13, 731–740 (2016). - PubMed
    1. Thery C, Amigorena S, Raposo G & Clayton A Isolation and characterization of exosomes from cell culture supernatants and biological fluids. Curr Protoc Cell Biol Chapter 3, Unit 3 22 (2006). - PubMed

Publication types

MeSH terms

Substances