. 2020 Feb;23(2):185-193.
doi: 10.1038/s41593-019-0564-3. Epub 2020 Jan 13.

Exome sequencing in schizophrenia-affected parent-offspring trios reveals risk conferred by protein-coding de novo mutations

Affiliations

Exome sequencing in schizophrenia-affected parent-offspring trios reveals risk conferred by protein-coding de novo mutations

Daniel P Howrigan et al. Nat Neurosci. 2020 Feb.

Abstract

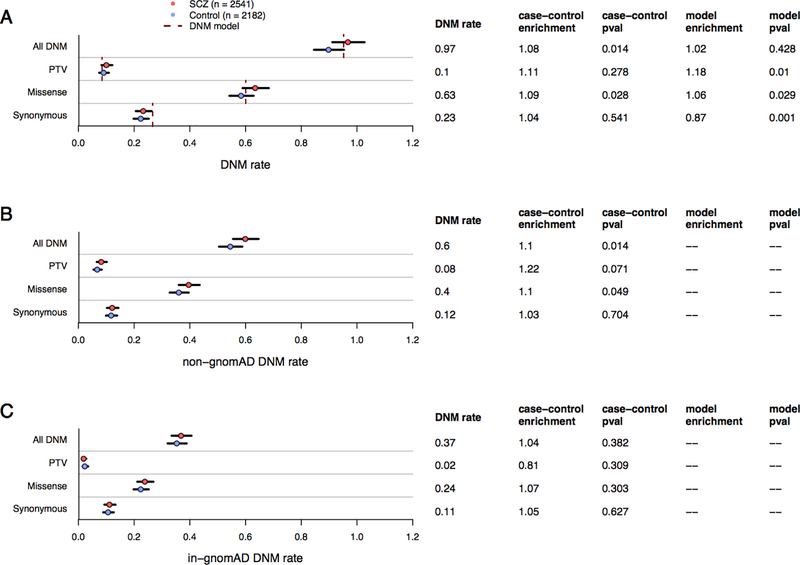
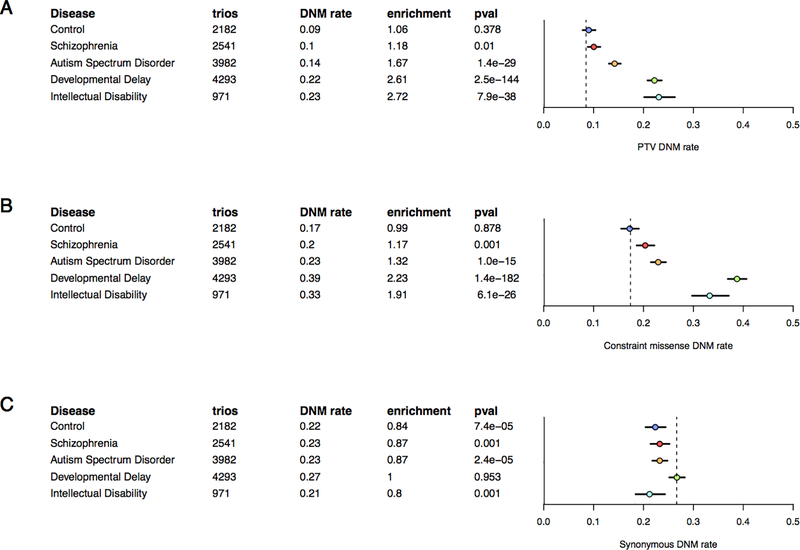
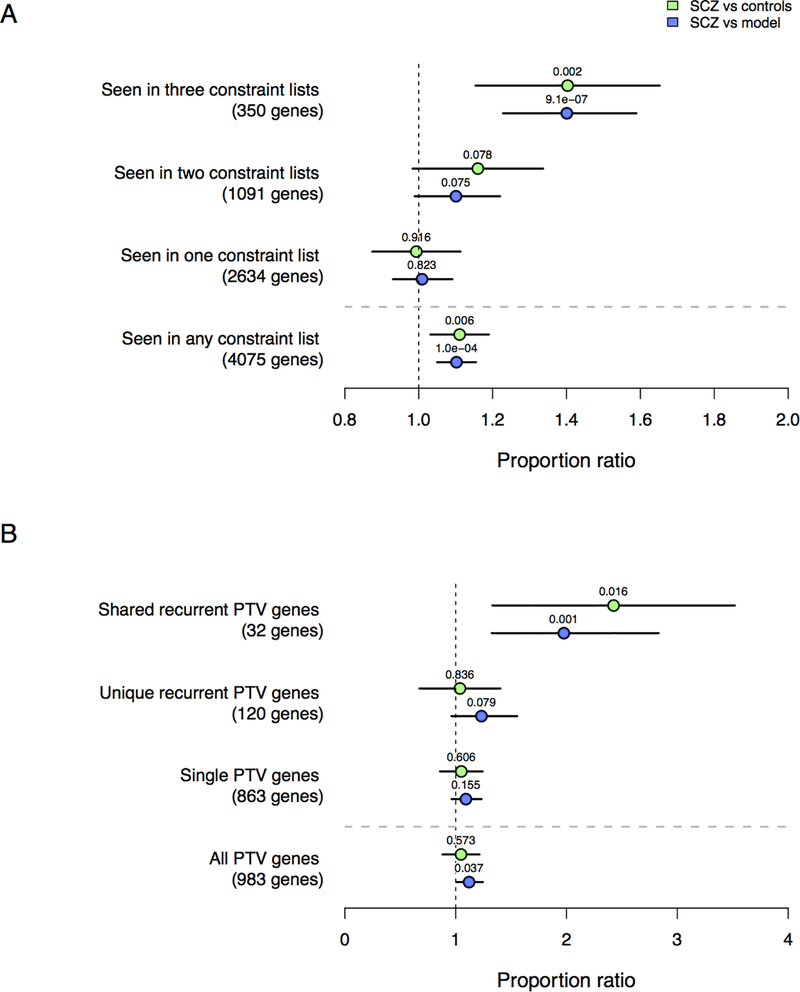
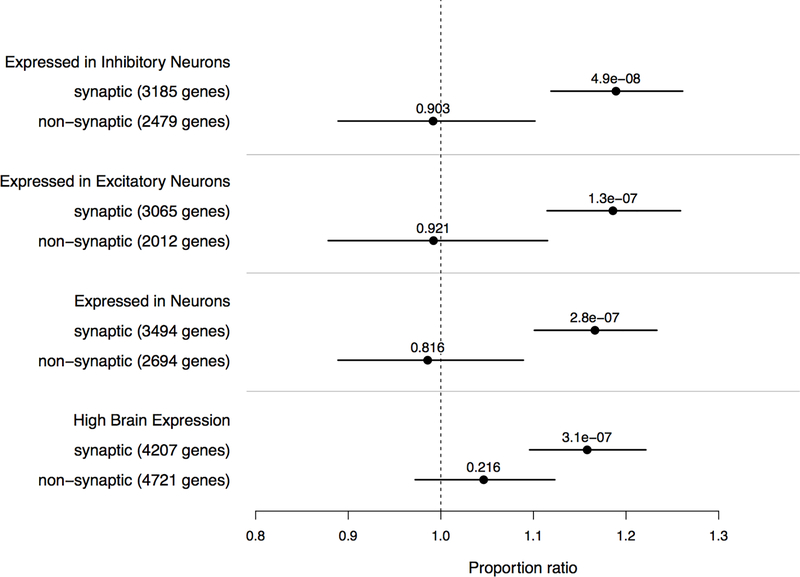
Protein-coding de novo mutations (DNMs) are significant risk factors in many neurodevelopmental disorders, whereas schizophrenia (SCZ) risk associated with DNMs has thus far been shown to be modest. We analyzed DNMs from 1,695 SCZ-affected trios and 1,077 published SCZ-affected trios to better understand the contribution to SCZ risk. Among 2,772 SCZ probands, exome-wide DNM burden remained modest. Gene set analyses revealed that SCZ DNMs were significantly concentrated in genes that were highly expressed in the brain, that were under strong evolutionary constraint and/or overlapped with genes identified in other neurodevelopmental disorders. No single gene surpassed exome-wide significance; however, 16 genes were recurrently hit by protein-truncating DNMs, corresponding to a 3.15-fold higher rate than the mutation model expectation (permuted 95% confidence interval: 1-10 genes; permuted P = 3 × 10⁻⁵). Overall, DNMs explain a small fraction of SCZ risk, and larger samples are needed to identify individual risk genes, as coding variation across many genes confers risk for SCZ in the population.


Conflict of interest statement

Competing Interests

B.M.N. is on the Scientific Advisory Board at Deep Genomics and Camp4 Therapeutics Corporation, and on the Biogen Genomics Advisory Panel. M.F. is an employee of Verily Life Sciences.

Figures

Figure 1:
Figure 1:
DNM rates (dots), 95% CI (error bars), and DNM model expectations (dotted lines) among SCZ and control probands. Figure 1A: Exome-wide DNM rates split by primary annotation, where “All DNM” encompasses protein-truncating variants (PTV), missense, and synonymous DNMs. Poisson rate p-values (all two-sided and unadjusted) and rate enrichment compared to controls are listed to the right of the DNM rate. DNM rates split by the absence (Figure 1B) or presence (Figure 1C) of an extant allele at the same position in the 104k non-psychiatric gnomAD cohort.
Figure 2:
Figure 2:
DNM rates (dots) and 95% CI (error bars) compared to DNM model expectations (dotted line) for exome-sequenced trios with various mental disorders. Figure 2A: Exome-wide PTV rate and enrichment relative to DNM model expectations. Figure 2B: Missense rate among evolutionarily constrained genes (defined here as the union of high pLI, missense constraint, and RVIS intolerant gene sets) and enrichment relative to DNM model expectations. Figure 2C: Exome-wide synonymous rate and enrichment relative to DNM model expectations. All tests are Poisson rate tests and information regarding the published studies analyzed is available in Online Methods.
Figure 3:
Figure 3:
Partitioning gene set enrichment among evolutionarily constrained and neurodevelopmental disorder gene sets. Proportion enrichment using a binomial test is evaluated among all DNMs in SCZ probands (n=2772) relative to controls (n=2216; green) and the DNM model (blue), with proportion enrichment (dots), 95% CI (error bars), and unadjusted two-sided p-values (above dots) displayed. Figure 3A: Gene set enrichment in three evolutionary constraint metrics (missense constraint, pLI, and RVIS), with partitioning among how often genes are present in each set. Figure 3B: Gene set enrichment for genes with observed DNM PTVs in intellectual disability, developmental delay, and ASD probands. Shared recurrent PTV genes have identified two or more PTVs in more than one disorder. Unique recurrent PTV genes have identified two or more PTVs in only one disorder. Single PTV genes are not recurrent within any disorder, although may be shared across disorders.
Figure 4:
Figure 4:
Partitioning of the genes expressed in neuronal cell types by their interaction with mRNAs highly active in the synapse (e.g. FMRP, RBFOX, CELF4), with interacting genes listed as “potentially synaptic”. Also included are the results from BrainSpan highly expressed genes (bottom comparison). Proportion enrichment (dots) of each gene set is tested in SCZ probands (n=2772) against the mutation model using a one-sample binomial test, with p-values (all two-sided and unadjusted) listed above each dot along with the 95% CI (error bars).

References

    1. Schizophrenia Working Group of the Psychiatric Genomics, C., Biological insights from 108 schizophrenia-associated genetic loci. Nature, 2014. 511(7510): p. 421–7. - PMC - PubMed
    1. Sekar A, et al. , Schizophrenia risk from complex variation of complement component 4. Nature, 2016. 530(7589): p. 177–83. - PMC - PubMed
    1. Lee SH, et al. , Estimating the proportion of variation in susceptibility to schizophrenia captured by common SNPs. Nat Genet, 2012. 44(3): p. 247–50. - PMC - PubMed
    1. Power RA, et al. , Fecundity of patients with schizophrenia, autism, bipolar disorder, depression, anorexia nervosa, or substance abuse vs their unaffected siblings. JAMA Psychiatry, 2013. 70(1): p. 22–30. - PubMed
    1. Marshall CR, et al. , Contribution of copy number variants to schizophrenia from a genome-wide study of 41,321 subjects. Nat Genet, 2017. 49(1): p. 27–35. - PMC - PubMed

Methods-only references

    1. Li H and Durbin R, Fast and accurate short read alignment with Burrows-Wheeler transform. Bioinformatics, 2009. 25(14): p. 1754–60. - PMC - PubMed
    1. McKenna A, et al. , The Genome Analysis Toolkit: a MapReduce framework for analyzing next-generation DNA sequencing data. Genome Res, 2010. 20(9): p. 1297–303. - PMC - PubMed
    1. Untergasser A, et al. , Primer3--new capabilities and interfaces. Nucleic Acids Res, 2012. 40(15): p. e115. - PMC - PubMed
    1. Robinson JT, et al. , Integrative genomics viewer. Nat Biotechnol, 2011. 29(1): p. 24–6. - PMC - PubMed
    1. Liu X, Jian X, and Boerwinkle E, dbNSFP: a lightweight database of human nonsynonymous SNPs and their functional predictions. Hum Mutat, 2011. 32(8): p. 894–9. - PMC - PubMed

Publication types