

Anomalously warm temperatures are associated with increased injury deaths
- PMID: 31932800
- PMCID: PMC6957467
- DOI: 10.1038/s41591-019-0721-y
Anomalously warm temperatures are associated with increased injury deaths
Abstract
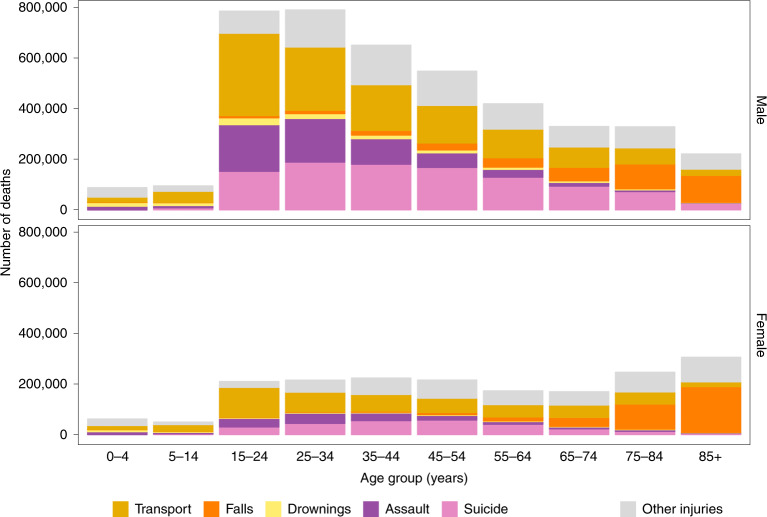
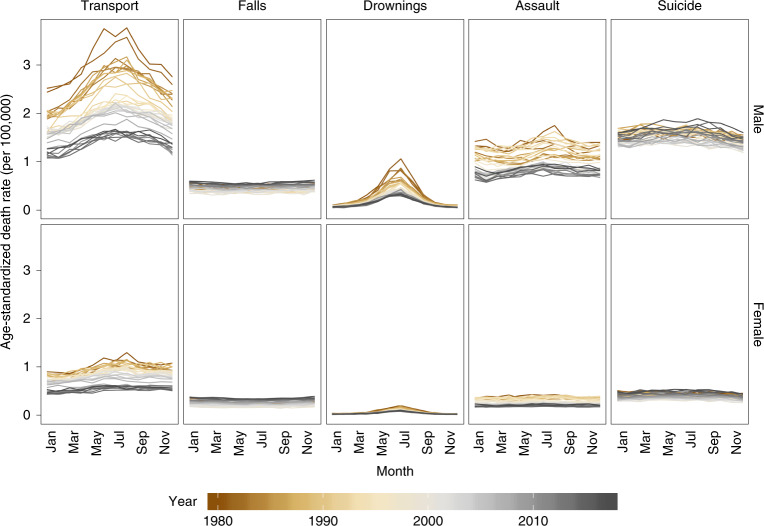
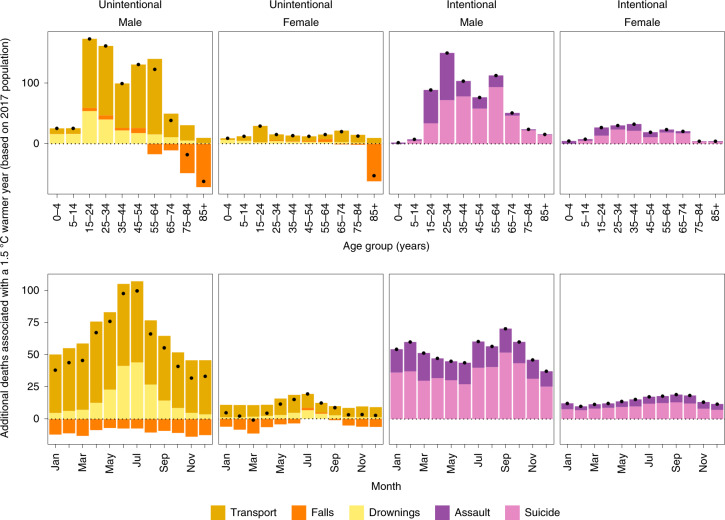
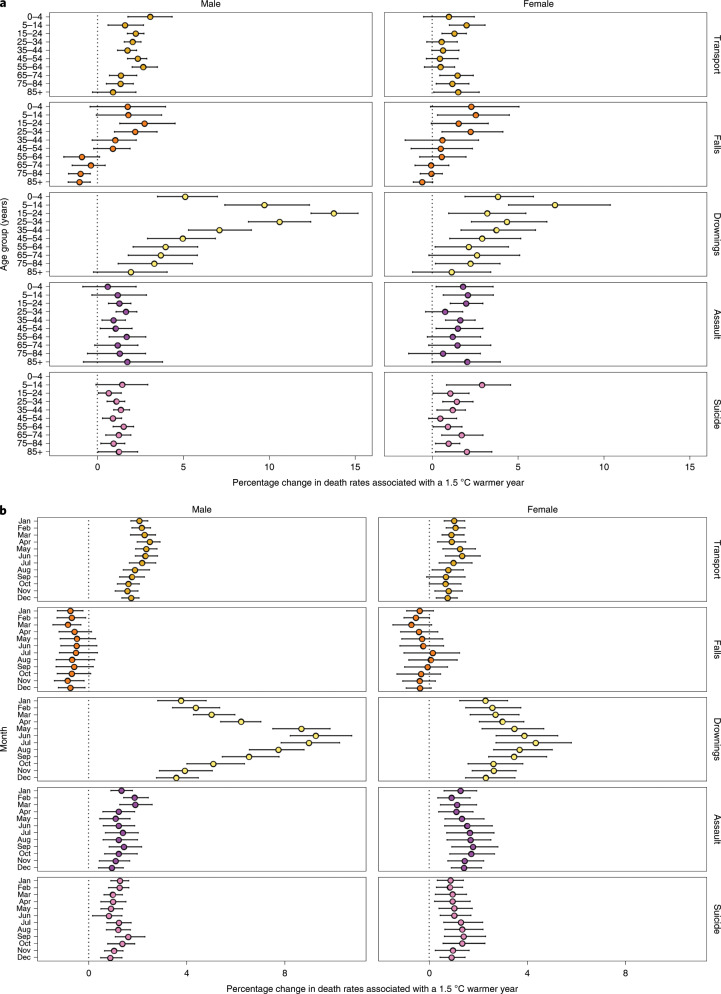
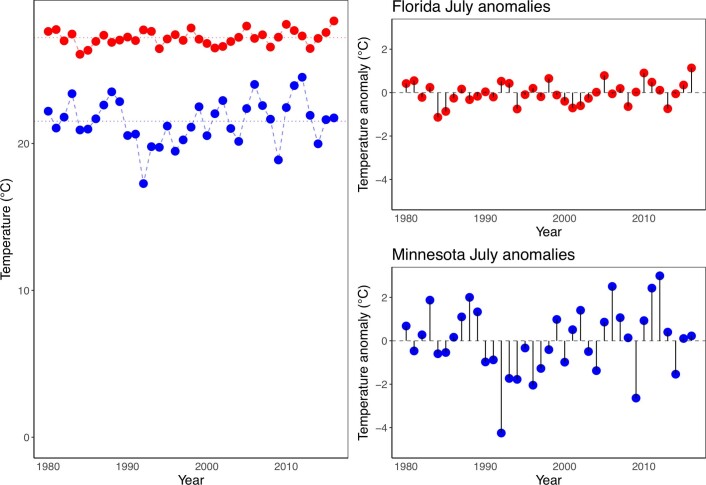
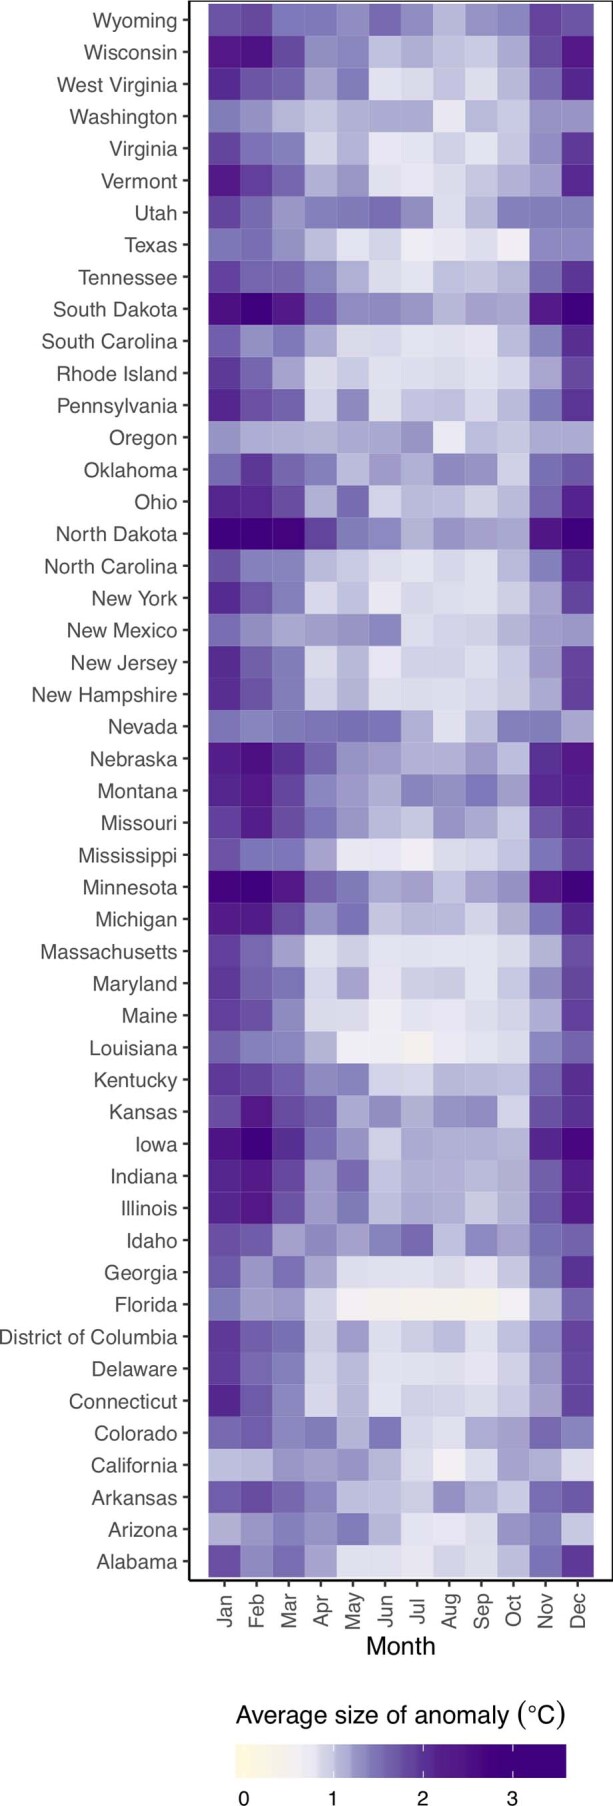
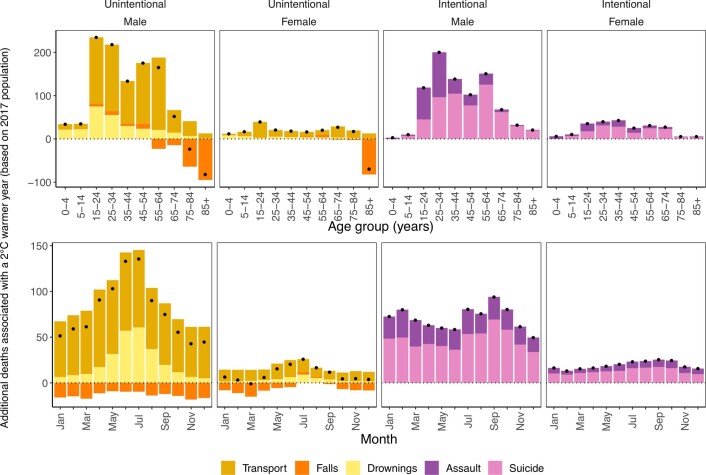
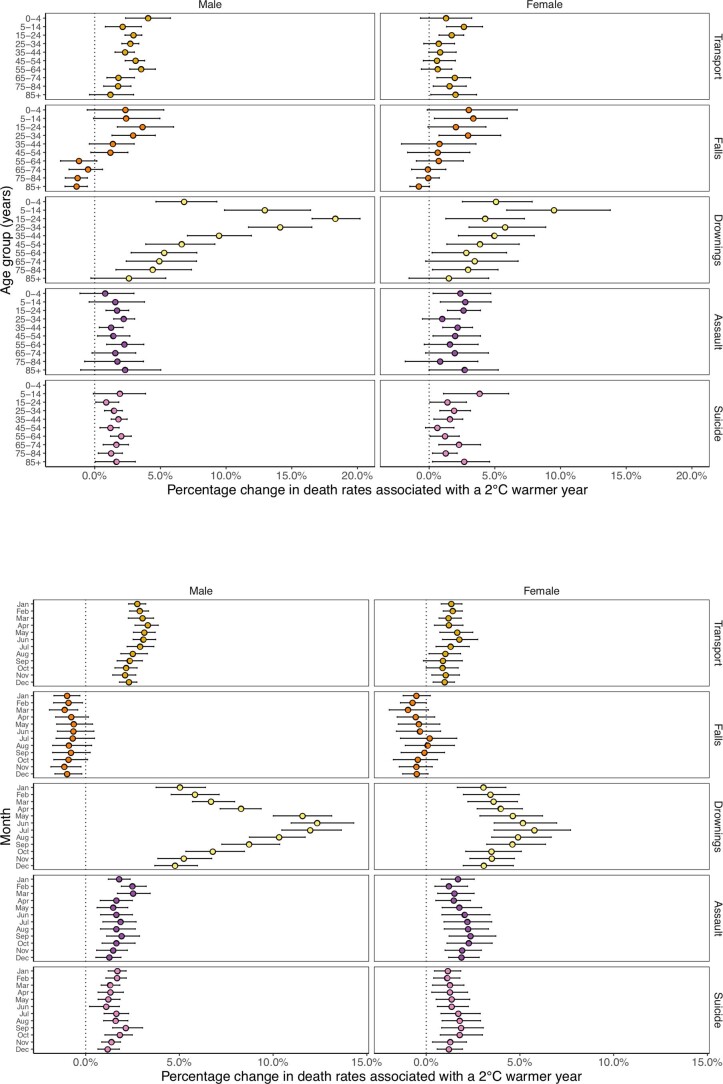
Temperatures that deviate from the long-term local norm affect human health, and are projected to become more frequent as the global climate changes1. There are limited data on how such anomalies affect deaths from injuries. In the present study, we used data on mortality and temperature over 38 years (1980-2017) in the contiguous USA and formulated a Bayesian spatio-temporal model to quantify how anomalous temperatures, defined as deviations of monthly temperature from the local average monthly temperature over the entire analysis period, affect deaths from unintentional (transport, falls and drownings) and intentional (assault and suicide) injuries, by age group and sex. We found that a 1.5 °C anomalously warm year, as envisioned under the Paris Climate Agreement2, would be associated with an estimated 1,601 (95% credible interval 1,430-1,776) additional injury deaths. Of these additional deaths, 84% would occur in males, mostly in adolescence to middle age. These would comprise increases in deaths from drownings, transport, assault and suicide, offset partly by a decline in deaths from falls in older ages. The findings demonstrate the need for targeted interventions against injuries during periods of anomalously warm temperatures, especially as these episodes are likely to increase with global climate change.
Conflict of interest statement
M.E. reports a charitable grant from AstraZeneca Young Health Programme, and personal fees from Prudential, Scor and Third Bridge, all outside the submitted work; all other authors declare no competing interests.
Figures

Comment in
-
Rising injuries in a hotter climate.Nat Med. 2020 Jan;26(1):22-23. doi: 10.1038/s41591-019-0728-4. Nat Med. 2020. PMID: 31932799 No abstract available.
-
Concerns over calculating injury-related deaths associated with temperature.Nat Med. 2020 Dec;26(12):1825-1826. doi: 10.1038/s41591-020-1113-z. Epub 2020 Nov 16. Nat Med. 2020. PMID: 33199841 No abstract available.
-
Reply to: Concerns over calculating injury-related deaths associated with temperature.Nat Med. 2020 Dec;26(12):1827-1828. doi: 10.1038/s41591-020-1114-y. Epub 2020 Nov 16. Nat Med. 2020. PMID: 33199842 No abstract available.
References
-
- IPCC Climate Change 2013: The Physical Science Basis (eds Stocker, T. F. et al.) (Cambridge Univ. Press, 2013).
-
- United Nations. Paris Agreementhttps://unfccc.int/process-and-meetings/the-paris-agreement/the-paris-ag... (2015).
-
- Smith, K. R et al. in Climate Change 2014: Impacts, Adaptation, and Vulnerability (eds Field, C. B. et al.) Ch 11 (IPCC, Cambridge Univ. Press, 2014).
-
- Haines, A. & Ebi, K. The imperative for climate action to protect health. N. Engl. J. Med. 380, 263–273 (2019). - PubMed
Publication types
MeSH terms
Grants and funding
LinkOut - more resources
Full Text Sources
Medical
