. 2020 Jan;26(1):83-90.
doi: 10.1038/s41591-019-0719-5. Epub 2020 Jan 13.

Personal aging markers and ageotypes revealed by deep longitudinal profiling

Affiliations

Personal aging markers and ageotypes revealed by deep longitudinal profiling

Sara Ahadi et al. Nat Med. 2020 Jan.

Abstract

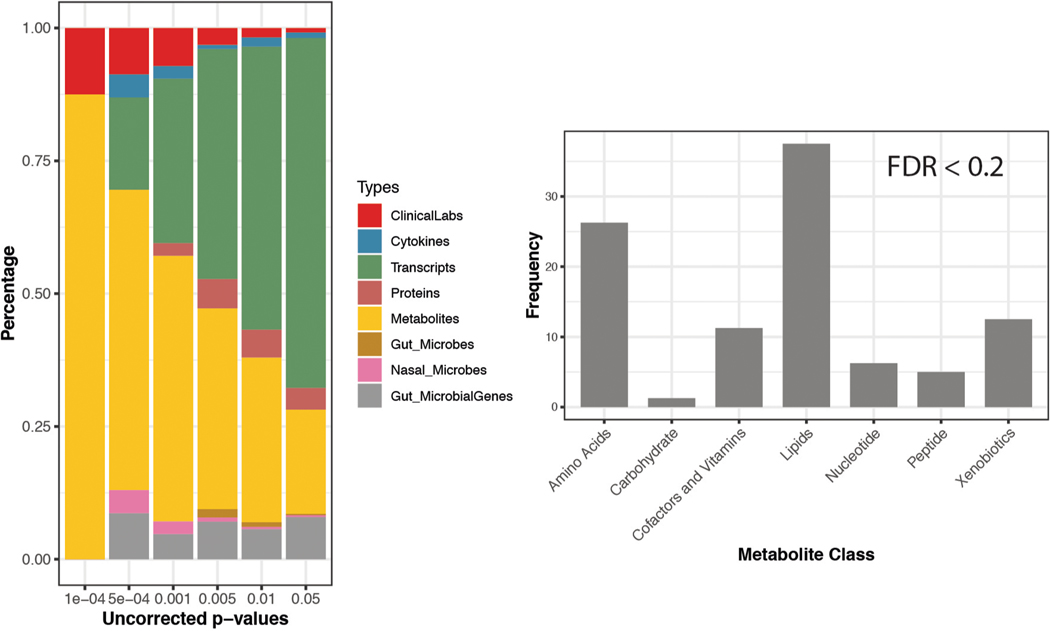
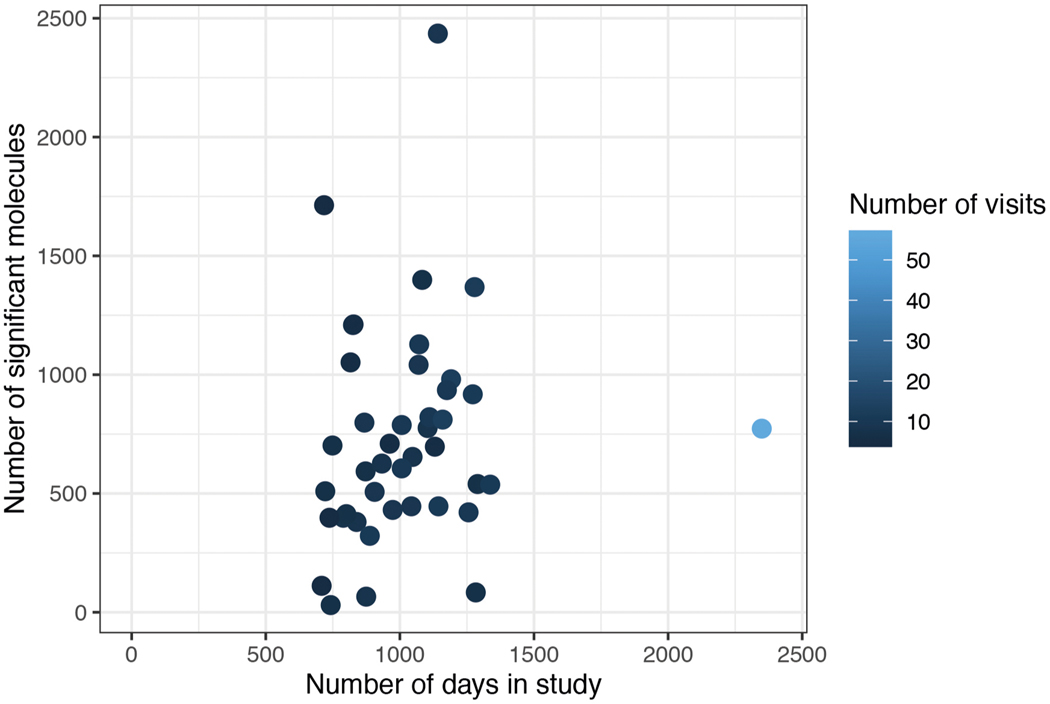
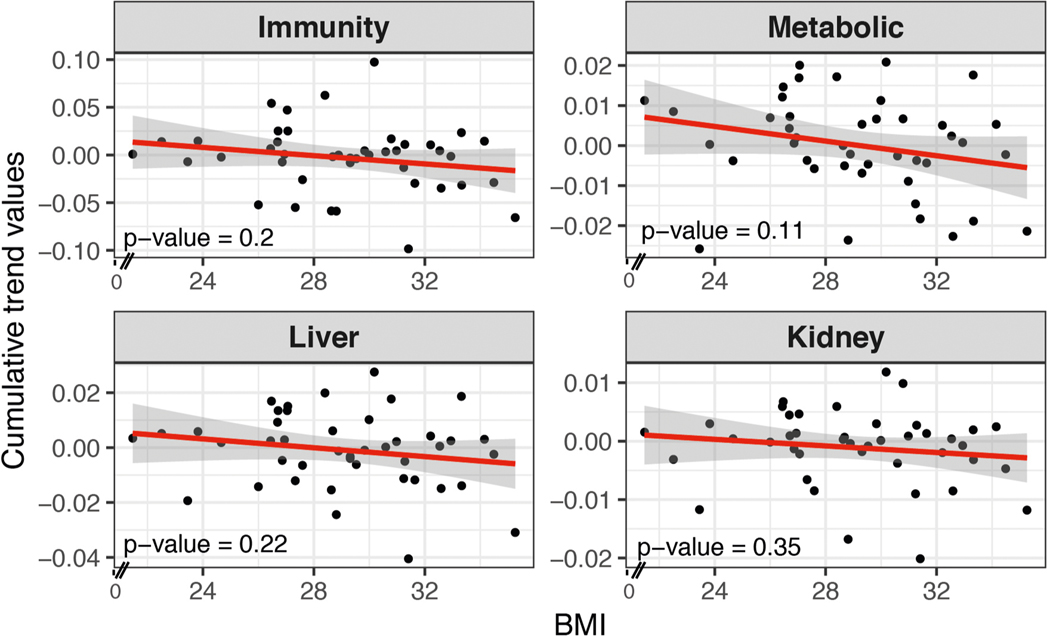
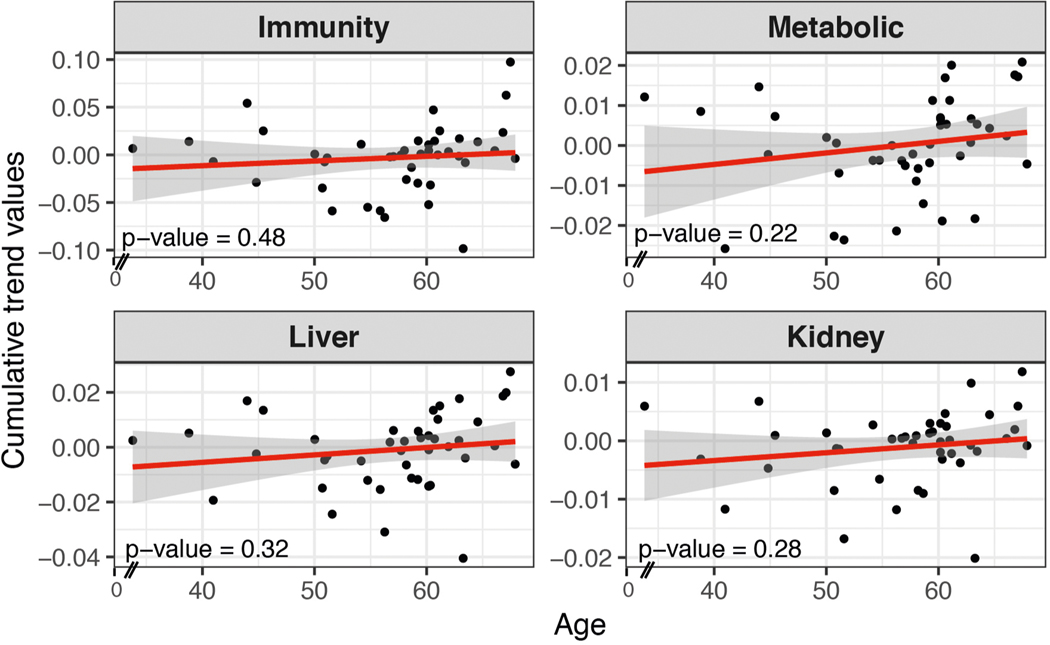
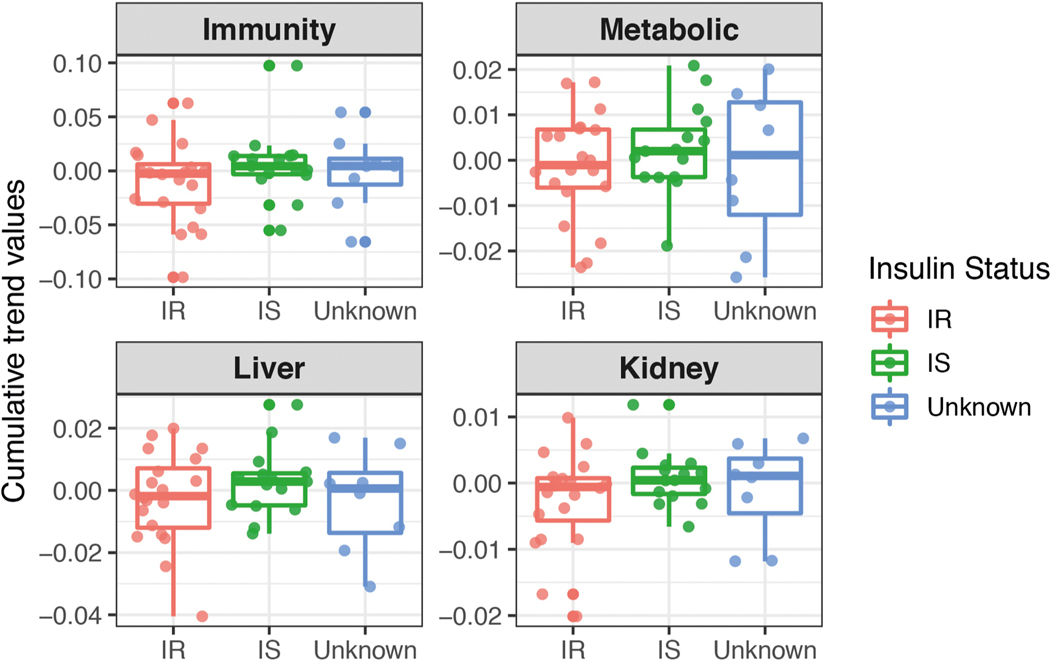
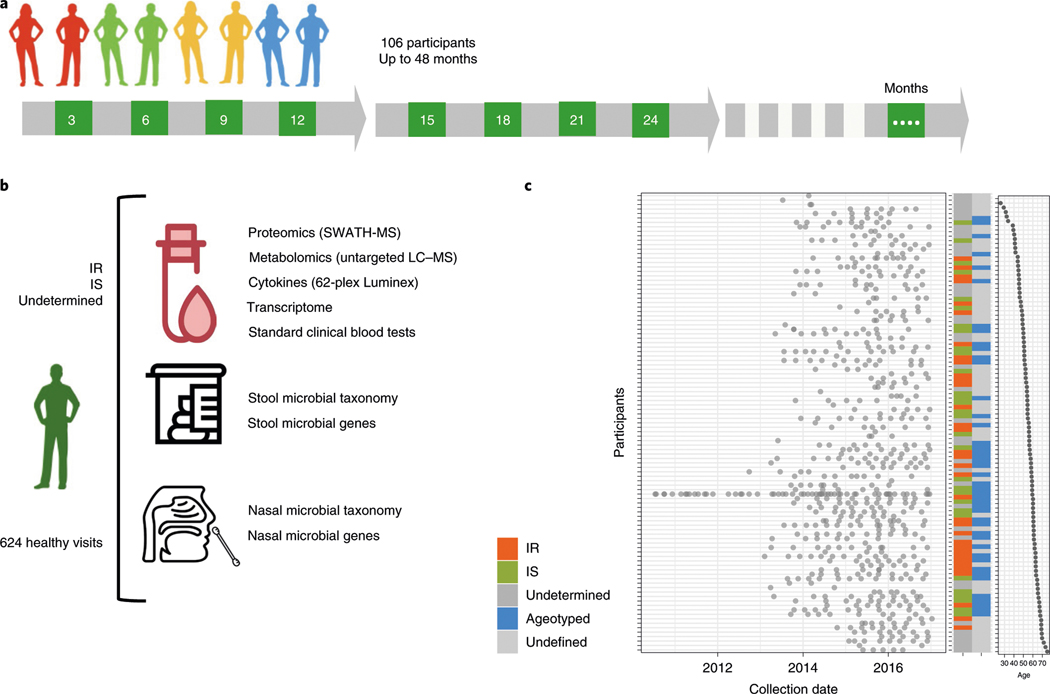
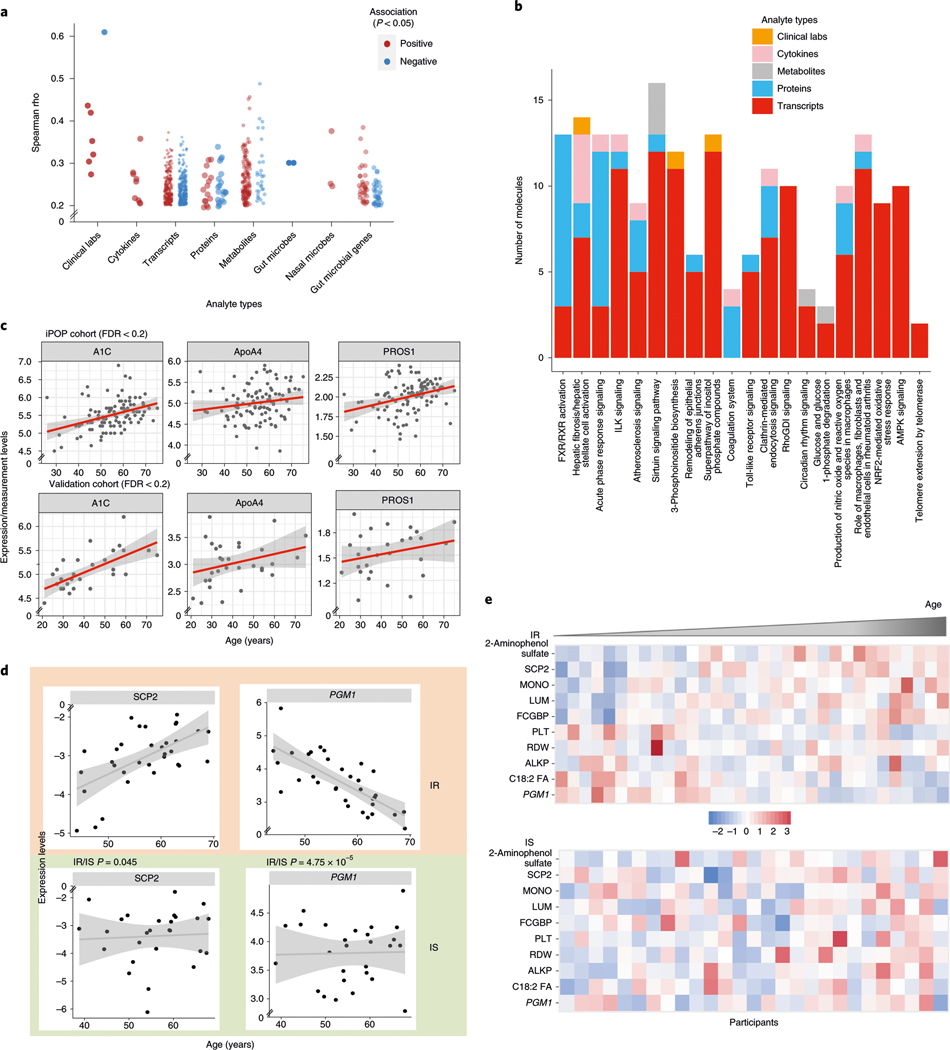
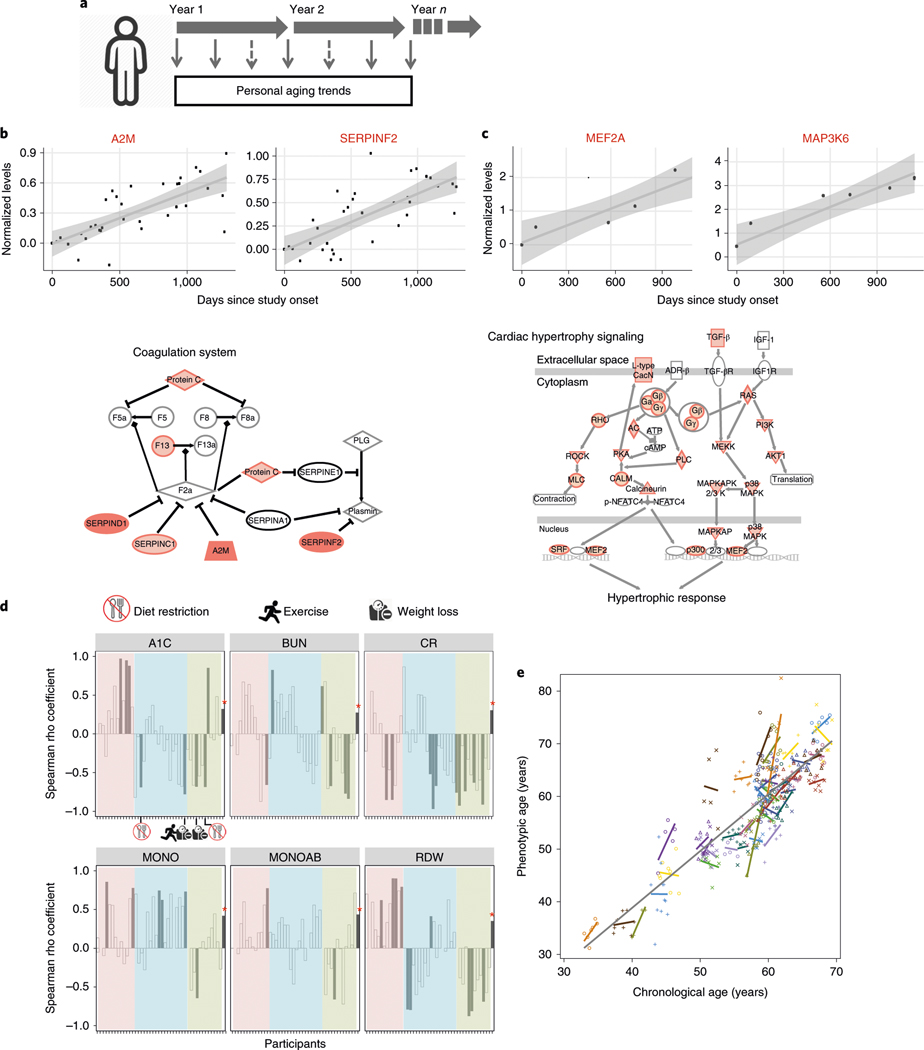
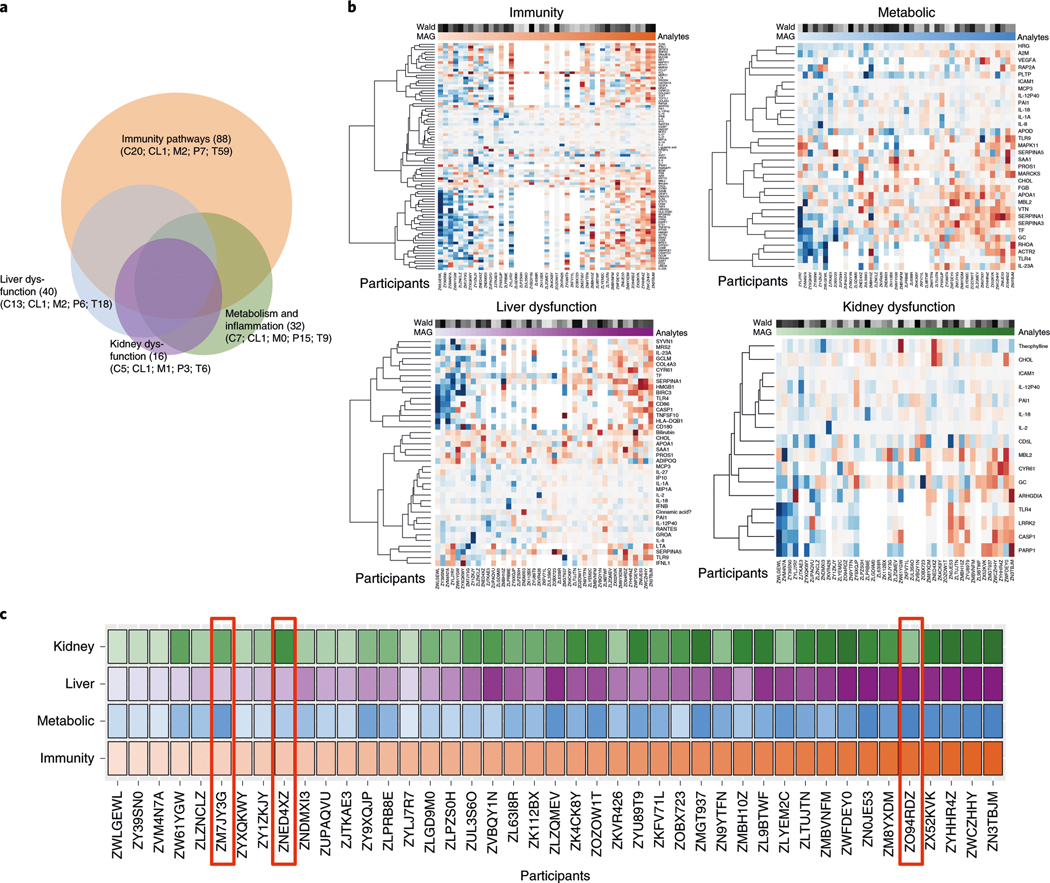
The molecular changes that occur with aging are not well understood1-4. Here, we performed longitudinal and deep multiomics profiling of 106 healthy individuals from 29 to 75 years of age and examined how different types of 'omic' measurements, including transcripts, proteins, metabolites, cytokines, microbes and clinical laboratory values, correlate with age. We identified both known and new markers that associated with age, as well as distinct molecular patterns of aging in insulin-resistant as compared to insulin-sensitive individuals. In a longitudinal setting, we identified personal aging markers whose levels changed over a short time frame of 2-3 years. Further, we defined different types of aging patterns in different individuals, termed 'ageotypes', on the basis of the types of molecular pathways that changed over time in a given individual. Ageotypes may provide a molecular assessment of personal aging, reflective of personal lifestyle and medical history, that may ultimately be useful in monitoring and intervening in the aging process.


Figures

Extended Data Fig. 1 |
Extended Data Fig. 1 |. Significant analytes associated with aging in the cross-section cohort (n = 106).
Left: number of significant multi-omics molecules correlating with age based on p-value threshold (before multiple hypothesis correction). right: The categories and their corresponding percentage (frequency) of metabolites significantly associated with the age. Significance is based on the Spearman rank tests.
Extended Data Fig. 2 |
Extended Data Fig. 2 |. Scatter plot of number of significant molecules with the age in longitudinal data of 43 individuals.
(Intentionally blank).
Extended Data Fig. 3 |
Extended Data Fig. 3 |. Scatter plot showing associations of the magnitude (cumulative trend values of contributing molecules) of each ageotpes with BMi based on 43 individuals.
Associations are not significant. Significance is calculated in the linear regression model.
Extended Data Fig. 4 |
Extended Data Fig. 4 |. Scatter plot showing associations of the magnitude (cumulative trend values of contributing molecules) of each ageotpes with Age based on 43 individuals.
Associations are not significant. Significance is calculated in the linear regression model.
Extended Data Fig. 5 |
Extended Data Fig. 5 |. Scatter plot showing associations of the magnitude (cumulative trend values of contributing molecules) of each ageotpes with insulin-resistant/sensitive status based on 43 individuals.
Associations are not significant. Significance is calculated in the linear regression model.
Fig. 1 |
Fig. 1 |. integrative Personal Omics Profiling (iPOP) cohort sampling and data collection for aging analyses.
a, Study design. A total of 106 participants were profiled by multiomic assays at their quarterly healthy visits over the course of up to 48 months. The numbers in green boxes indicate the number of months since enrollment for the quarterly visits. b, Graphical illustration of sample collection, multiomic assays and data generation for participants, including 35 participants who were Ir, 31 participants who were IS and 40 participants with an unclassified insulin status. Data from a total of 624 healthy visits were analyzed. Omic assays included proteomics using sequential window acquisition of all theoretical fragment ion spectra mass spectrometry (SWATH-MS), metabolomics using untargeted liquid chromatography mass spectrometry (LC–MS) and transcriptomics and microbial profiling using next-generation sequencing. c, Plot of the collection dates for all participants (left), participant characteristics (middle) and participant age (right). red, Ir; green, IS; dark gray, unknown insulin status; blue, the participant was included in the longitudinal study and was analyzed for personal aging trends (ageotyped); light gray, the participant was not included in the longitudinal cohort owing to insufficient sampling for ageotyping analysis.
Fig. 2 |
Fig. 2 |. Aging molecules and pathways revealed from cross-sectional analyses.
a, Spearman rho coefficients significantly associated with age for the indicated categories of data. red indicates positive associations and blue indicates negative associations. b, The number of molecules from each of the indicated categories of data (measurement types) belonging to the indicated pathways is shown. The top pathways are shown that were significantly enriched in molecules associated with age. ILK, integrin-linked kinase; rhoGDI, rho GDP-dissociation inhibitor; nrF2, nF-E2 p45-related factor 2; AMPK, AMP-activated protein kinase. c, Scatter-plots showing the correlation trend of molecules (expression level as y axis) with age (x axis) in two independent cohorts (iPOP, n = 106; validation, n = 31). Individuals from each cohort are shown as dots and the linear regression coefficient is noted as the red trend line with a gray confidence interval. d, Examples of associations that are different between participants who were Ir (n = 35) and IS (n = 31). The x axis shows the age of participants and the y axis shows the normalized values of the measurements (median normalization). Individuals are shown as dots and the linear regression coefficient is noted as the trend line with a gray confidence interval. P values indicate a significant difference between the trends associated with age for the Ir and IS groups. e, Heat maps of measurements in participants who were Ir (top) and IS (bottom). Only measurements that were significantly associated with age in the Ir group are presented. In each group, participants are ordered by their age, from left to right. red indicates increased expression and blue indicates decreased expression. MOnO, monocyte count; PLT, platelet count; ALKP, alkaline phosphatase.
Fig. 3 |
Fig. 3 |. Personal aging markers show personalized aging patterns that are distinct from those of cross-sectional aging markers.
a, Graphical illustration of the personal aging trend analysis based on longitudinal measurements of analytes in the same individual. b,c, Longitudinal analysis of aging in participants ZOZOW1T (b) and Zn3TBJM (c). Top, representative scatter plots showing longitudinal levels of analytes significantly associated with days elapsed since study onset. Longitudinal measurements of an analyte in one individual are shown as dots and the rank-based linear regression coefficient is noted as the trend line with a gray confidence interval. A2M, α−2-macroglobulin; SErPInF2, serpin family F member 2; MEF2A, myocyte enhancer factor 2A; MAP3K6, mitogen-activated protein kinase 6 (all measurements from transcriptomic rnA-seq). Bottom, examples of enriched pathways identified from aging-associated analytes. Darker shades represent increased levels over the course of the study. d, Spearman rho coefficients comparing personal associations and cross-sectional associations (n = 106) for six clinical laboratory analytes. Participants analyzed for their personal aging trends are displayed along the x axis in the same order for each panel. For each clinical analyte, the Spearman rho coefficient obtained from cross-sectional association is marked with an asterisk. Color coding (pink, blue and green) for groups was based on clustering analysis using coefficients of the six clinical laboratory values. Individuals with changes in diet, exercise and weight management are indicated graphically in the A1C panel. Cr, creatinine; MOnOAB, absolute count of monocytes. e, Phenotypic age regression on the chronological age of individuals (n = 43). The gray trend line is the overall regression line for the cohort. The colored lines are the fitted regression lines for each individual.
Fig. 4 |
Fig. 4 |. Personal ageotypes defined from four major groups of pathways.
a, Venn diagram showing the number of analytes (C, cytokines; CL, clinical laboratory values; M, metabolites; P, proteins; T, transcripts) in each of the four ageotypes and the overlaps among them. b, Heat maps showing the levels of aging markers in the four major ageotypes for each individual: red, immunity ageotype; blue, metabolic ageotype; purple, liver dysfunction ageotype; green, kidney dysfunction ageotype. The darkness of shading reflects the magnitude of the aging trend, with red denoting a positive correlation and blue denoting a negative correlation. The magnitude (MAG) of the aging association and the Wald score are indicated above the heatmaps (see Methods for details). c, Overall patterns of the four ageotypes for 43 participants in the cohort, ordered by the magnitude of their immunity ageotype. The color-coding scheme is the same as described for b.

Comment in

References

    1. Lopez-Otin C, Blasco MA, Partridge L, Serrano M & Kroemer G The hallmarks of aging. Cell 153, 1194–1217 (2013). - PMC - PubMed
    1. Aunan JR, Cho WC & Soreide K The biology of aging and cancer: a brief overview of shared and divergent molecular hallmarks. Aging Dis. 8, 628–642 (2017). - PMC - PubMed
    1. Hung CW, Chen YC, Hsieh WL, Chiou SH & Kao CL Ageing and neurodegenerative diseases. Ageing Res. Rev. 9(Suppl. 1), S36–S46 (2010). - PubMed
    1. Kalyani RR & Egan JM Diabetes and altered glucose metabolism with aging. Endocrinol. Metab. Clin. North Am. 42, 333–347 (2013). - PMC - PubMed
    1. Steenman M & Lande G Cardiac aging and heart disease in humans. Biophys. Rev. 9, 131–137 (2017). - PMC - PubMed

Publication types