. 2020 Feb;21(2):135-144.
doi: 10.1038/s41590-019-0571-2. Epub 2020 Jan 13.

Programmed 'disarming' of the neutrophil proteome reduces the magnitude of inflammation

Affiliations

Programmed 'disarming' of the neutrophil proteome reduces the magnitude of inflammation

Jose M Adrover et al. Nat Immunol. 2020 Feb.

Abstract

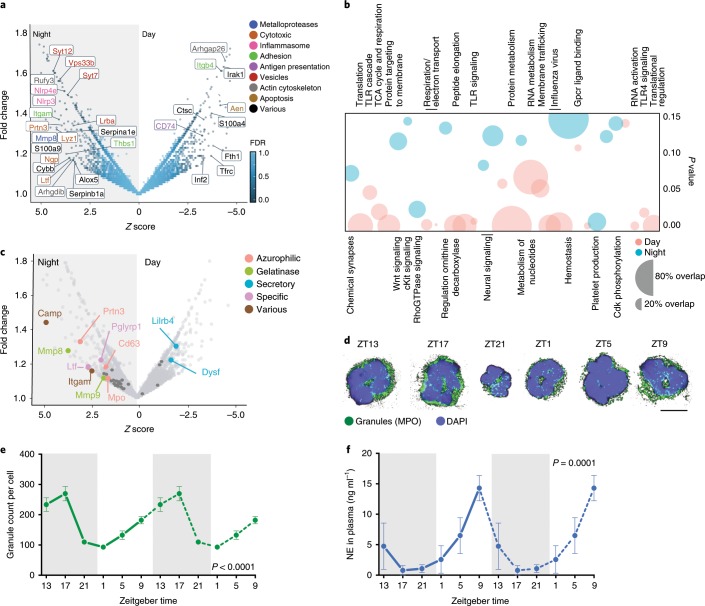
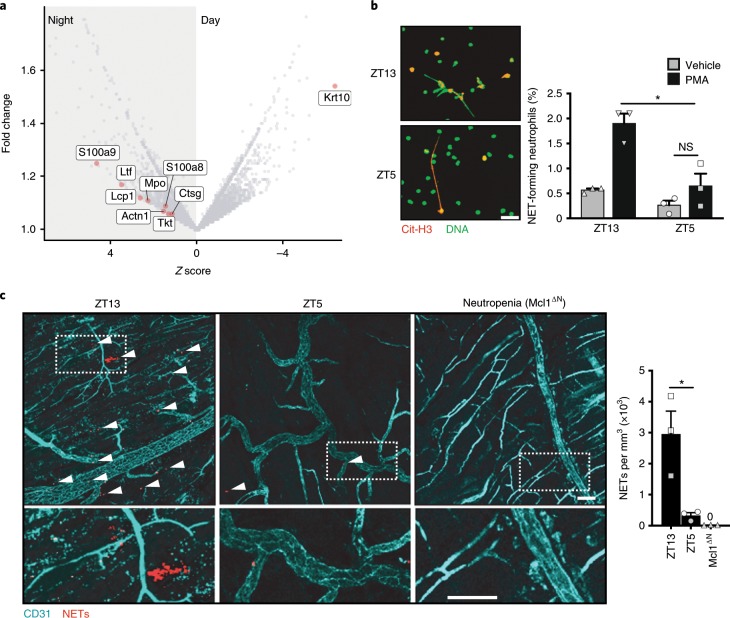
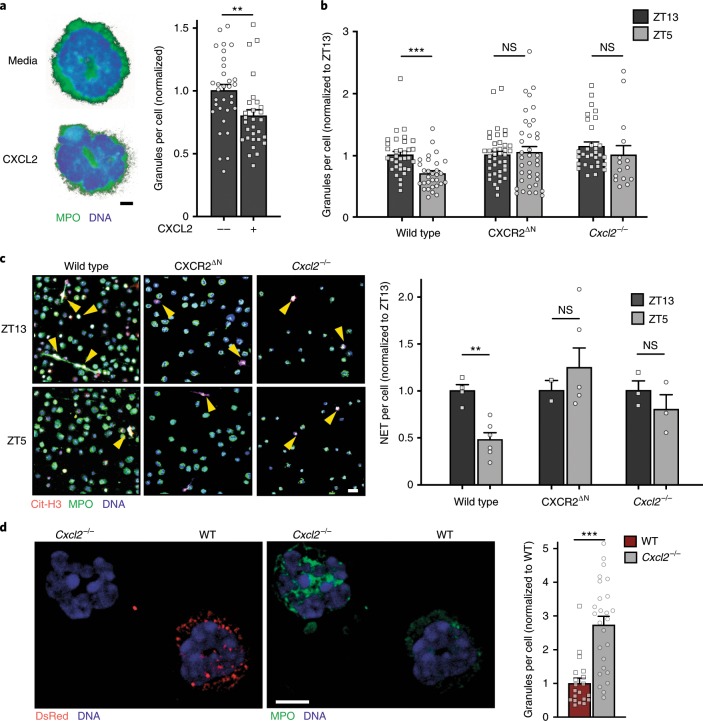
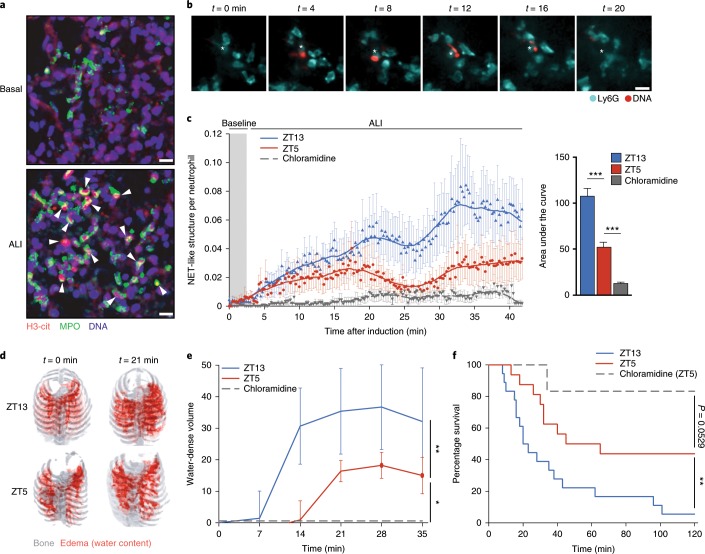
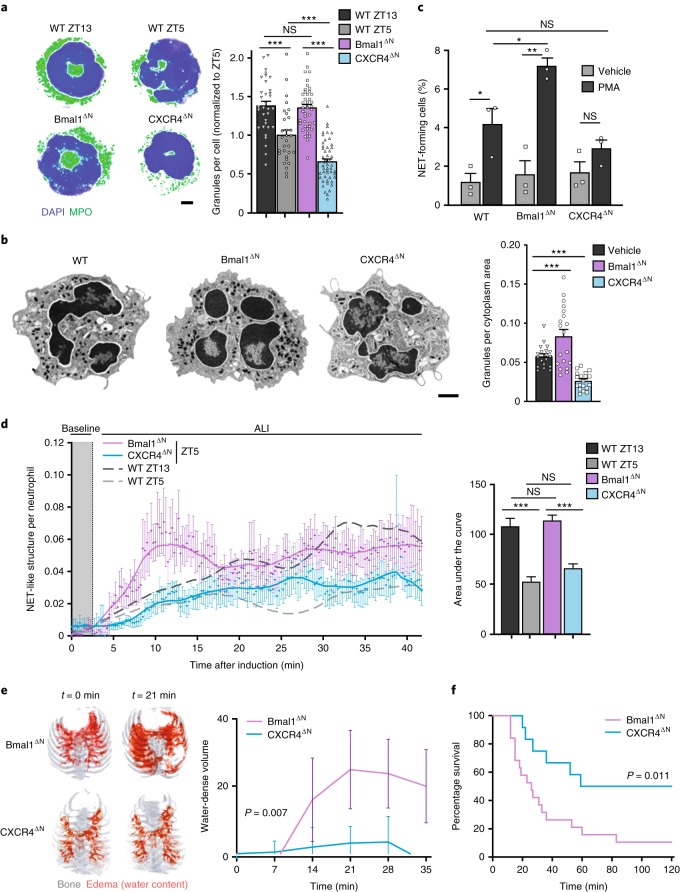
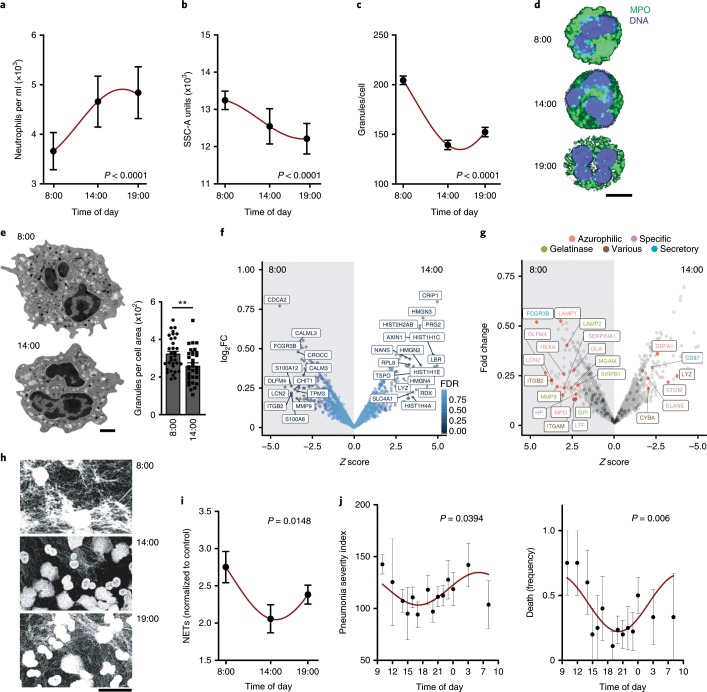
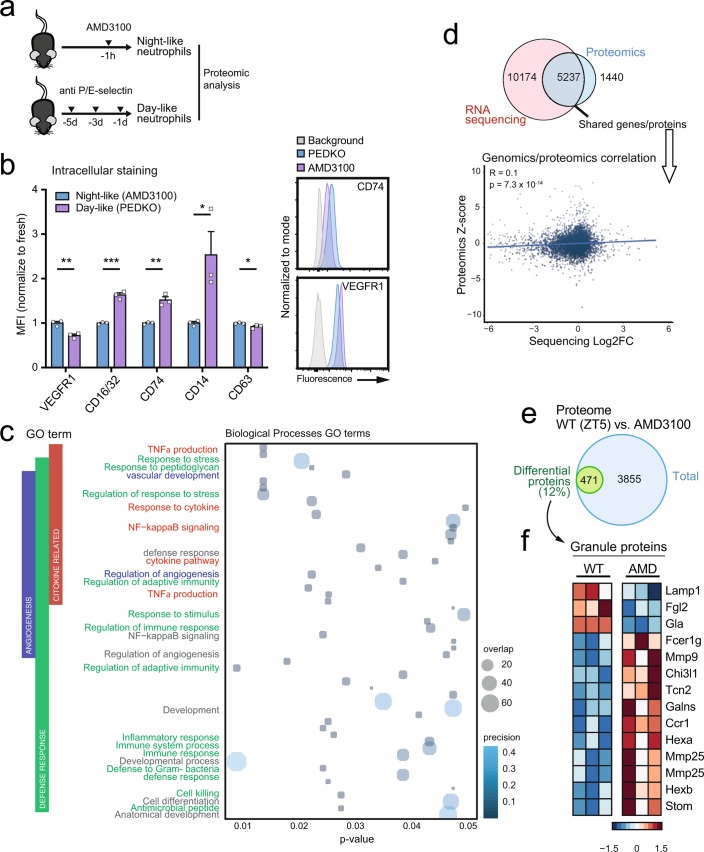
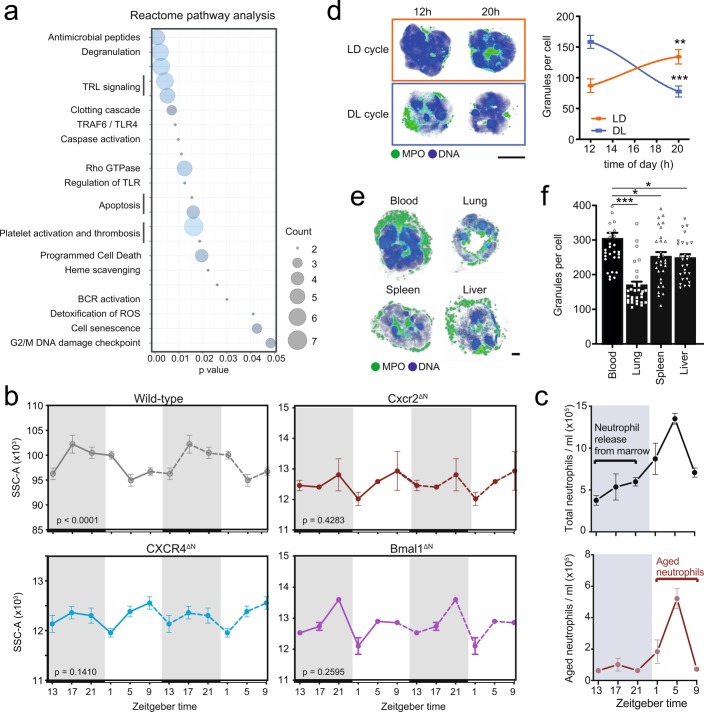
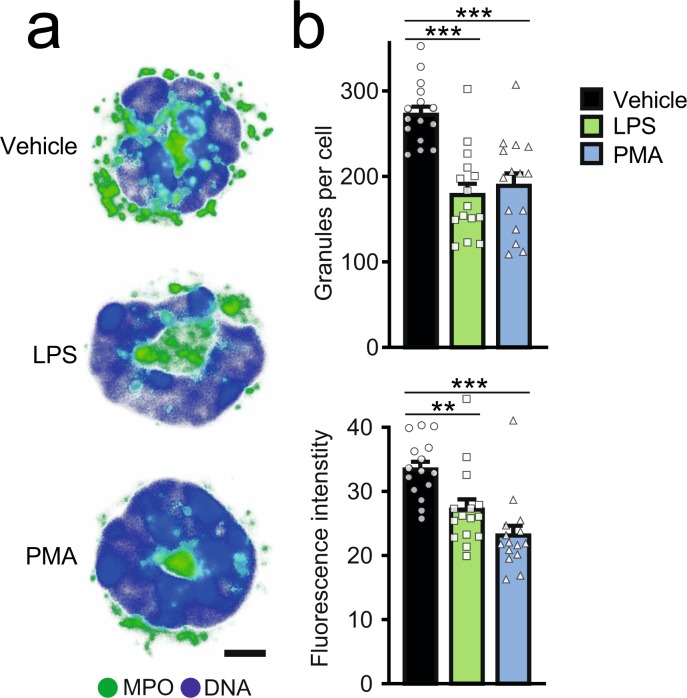
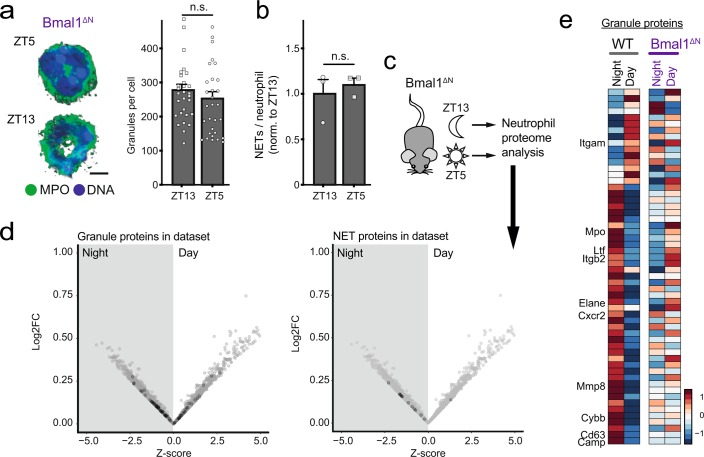
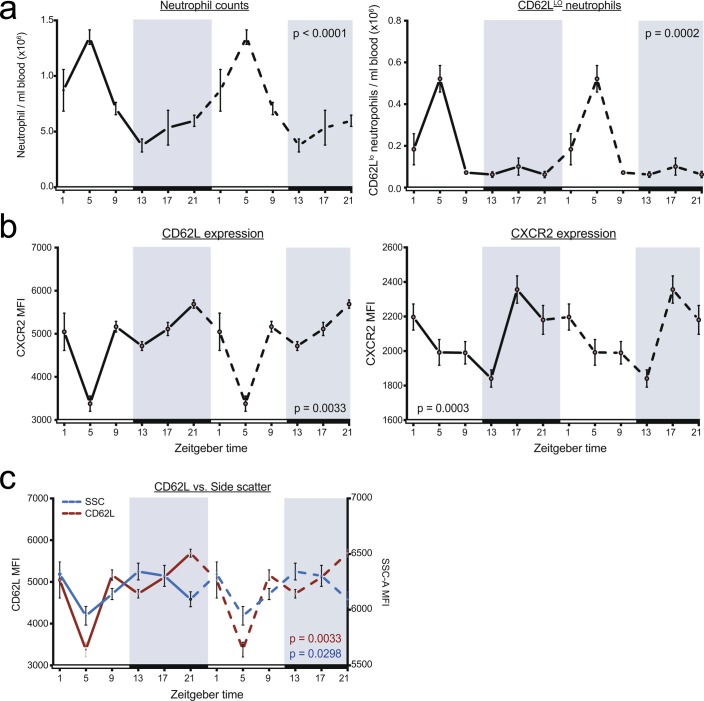
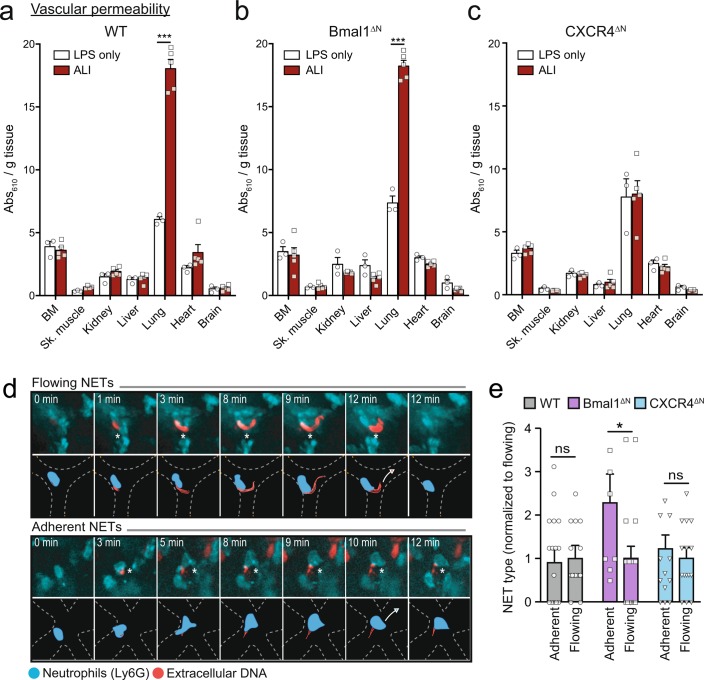
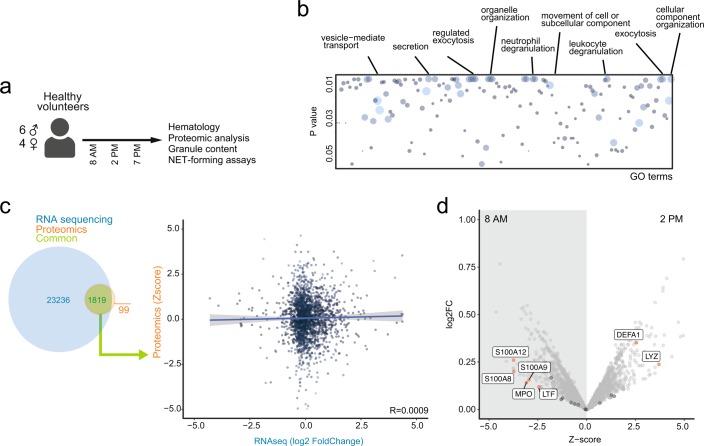
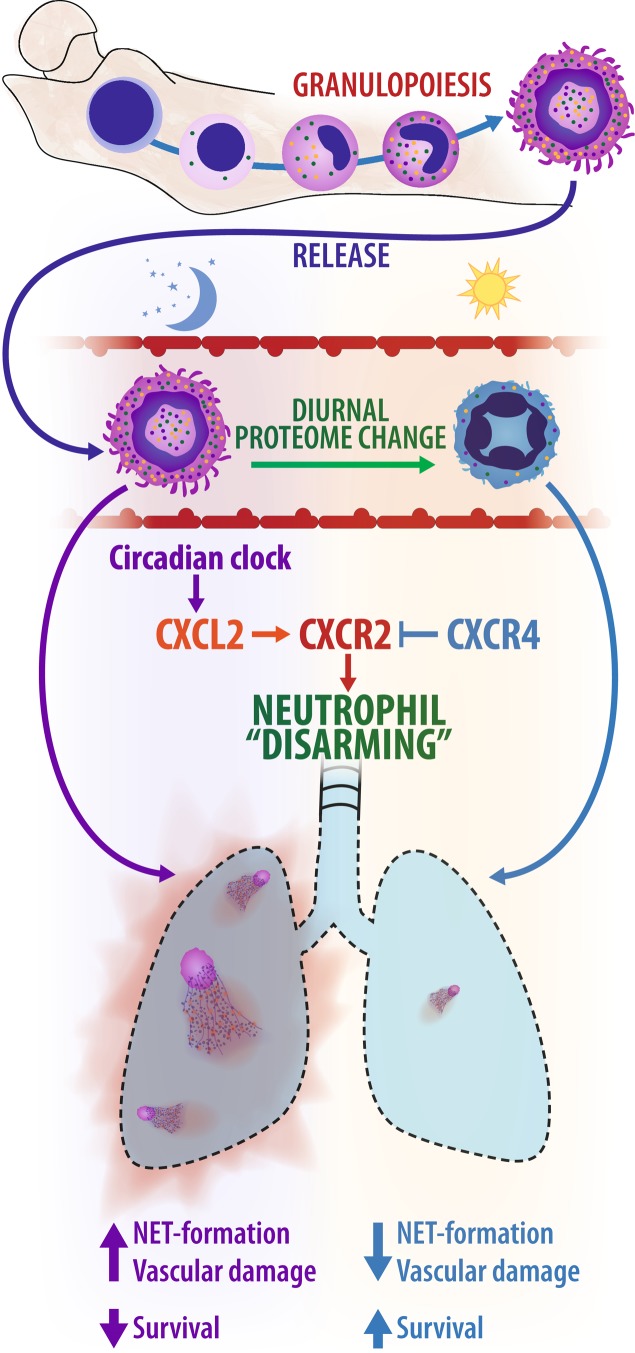
The antimicrobial functions of neutrophils are facilitated by a defensive armamentarium of proteins stored in granules, and by the formation of neutrophil extracellular traps (NETs). However, the toxic nature of these structures poses a threat to highly vascularized tissues, such as the lungs. Here, we identified a cell-intrinsic program that modified the neutrophil proteome in the circulation and caused the progressive loss of granule content and reduction of the NET-forming capacity. This program was driven by the receptor CXCR2 and by regulators of circadian cycles. As a consequence, lungs were protected from inflammatory injury at times of day or in mouse mutants in which granule content was low. Changes in the proteome, granule content and NET formation also occurred in human neutrophils, and correlated with the incidence and severity of respiratory distress in pneumonia patients. Our findings unveil a 'disarming' strategy of neutrophils that depletes protein stores to reduce the magnitude of inflammation.


Conflict of interest statement

The authors declare no competing interests.

Figures

Fig. 1
Fig. 1. Diurnal changes in the neutrophil proteome.
a, Volcano plot of the total proteome showing proteins with FDR < 0.01 (calculated as stated in the Methods from single samples of 60 million neutrophils pooled from nine mice (night) and six mice (day)). A positive Z score represents an increase in nighttime (fresh) over daytime (aged) neutrophils. Color represents the functional category for each protein (top right). b, Gene-set enrichment analysis of the proteomics data showing pathways with P < 0.15 enriched in aged (red) or fresh (blue) neutrophils. The size of the bubble-plot represents overlap between the query and the gene set (bottom right). Vertical lines indicate queries with multiple pathways. c, Volcano plot of the proteomic dataset showing granule proteins with a Z score >2. Colors show the granule type for each protein (top right). d, Z stack maximum projection of neutrophils stained for primary granules with MPO and counterstained with DAPI. Scale bar, 5 μm. e, Quantification of neutrophil granule contents during a full diurnal cycle. Curves are repeated (dashed line) to better appreciate the circadian pattern. Dark phase is shown in gray; n = 30 cells per time point. f, Neutrophil elastase (NE) activity in plasma. Curves are repeated (dashed line) to better appreciate the circadian pattern. Dark phase is shown in gray; n = 4 mice per time point. Data in e and f are shown as mean ± s.e.m., and circadian oscillation P values were determined by amplitude versus zero two-tailed t-test analysis (see Methods).
Fig. 2
Fig. 2. Diurnal loss of NET-forming capacity.
a, Volcano plot of the neutrophil proteome showing proteins found in NETs (red dots), and enrichment of these proteins in nighttime neutrophils. b, Ex vivo NET-formation assay. Neutrophils sorted at ZT13 (nighttime) or ZT5 (daytime) were stimulated with PMA or vehicle to induce NETs and were stained for cit-H3 and DNA (left). Colocalization of both markers was used to quantify NET formation, as shown in the bar graph (right); n = 3 mice per time point. c, Representative images (left) and quantification (right) of in vivo NET formation in the cremaster muscle subjected to ischemia/reperfusion at nighttime (ZT13) or at daytime (ZT5). Triple colocalization of MPO, DNA and cit-H3 was used to define and quantify the area of NETs (red; arrowheads). Neutropenic Mcl1∆N mice (Lyz2Cre;Mcl1fl/fl mice) were used as controls and showed no NETs. Dotted areas are shown magnified in the bottom panels; n = 3 mice per condition. Scale bars, 50 μm. Bars show mean ± s.e.m. *P < 0.05; NS, not significant, as determined by unpaired two-tailed t-test analysis.
Fig. 3
Fig. 3. Degranulation and loss of NET-forming capacity are driven by CXCL2/CXCR2 signaling.
a, Ex vivo stimulation of sorted neutrophils with CXCL2 induces degranulation (right), as quantified by confocal imaging of MPO-stained neutrophils (left); n = 29 (−) and 32 (+) cells. Scale bar, 2 μm. b, Diurnal quantification of granule content in neutrophils from WT, CXCR2∆N or Cxcl2−/− mice, showing a loss of diurnal fluctuation in CXCR2-deficient (n = 38 cells at ZT5 and 40 cells at ZT13) or CXCL2-deficient neutrophils (n = 31 cells at ZT5 and 14 cells at ZT13), compared to their WT counterparts (n = 30 cells at ZT5 and 34 cells at ZT13). c, Ex vivo NET-formation assays with sorted neutrophils stimulated with PMA or vehicle control, at nighttime (ZT13) or daytime (ZT5). NETs were quantified by triple colocalization of cit-H3, DNA and MPO in confocal micrographs (left; scale bar, 25 μm). Each mouse was normalized to its vehicle control and NET formation at ZT13 and ZT5 is compared (right). CXCL2-deficient (n = 3 mice per time) and CXCR2-deficient (n = 6 mice at ZT5 and 2 mice at ZT13) neutrophils showed loss of diurnal fluctuation in NET formation compared with WT cells (n = 6 mice at ZT5 and 4 mice at ZT13). d, CXCL2 signaling causes cell-autonomous degranulation, as shown by analysis of MPO+ granules in neutrophils from bone marrow chimeras reconstituted with DsRed+ wild-type and DsRedNEG Cxcl2−/− donors; scale bar, 5 μm; n = 3 mice. Bars show mean ± s.e.m. **P < 0.01; NS, not significant, as determined by paired (a,d) or unpaired (b,c) two-tailed t-test analysis.
Fig. 4
Fig. 4. Diurnal loss of NET formation and pulmonary protection during ALI.
a, Presence of NETs in lungs. Maximum projections of confocal Z stack series of cleared lungs from control mice (basal) or mice with antibody-induced ALI are shown. Lungs were stained against cit-H3, MPO and DNA, and some NETs are shown (arrowheads). Scale bar, 30 μm. Representative images of n = 3 cleared lungs per condition. b, Time series of intravital imaging captures of NET-like structures in the lungs of ALI-induced mice. NET-like structures were defined as free DNA extruded out of Ly6G+ neutrophils. Scale bar, 10 μm. See also Supplementary Video 1. c, Quantification of NET-like structures as shown in b, and normalized to the number of neutrophils in mice in which ALI was performed at nighttime (ZT13, blue line) or daytime (ZT5, red line), or in mice treated with chloramidine (at ZT5, dashed gray line). Time course (left panel) and area under the curve values (right panel); in both, n = 15 fields from four mice per condition. Individual data points are not shown here as this graph uses a mean ± s.e.m. value for the area under the curve calculated from the data shown in the left panel. d, Representative images of longitudinal CT series of edema formation at 0 or 21 min after inducing ALI ZT13 or ZT5. Note the increased edema (red) at night. Background bone signal (gray) is shown for anatomical positioning. e, Quantification of the images in d. Volume of edema was increased at ZT13 (blue; n = 7 mice) relative to ZT5 (red; n = 7 mice). Mice treated with chloramidine are shown as a control (gray, n = 4 mice). f, Survival of mice subjected to ALI at ZT13 (blue, n = 18 mice) or ZT5 (red, n = 21 mice), or treated with chloramidine (gray, n = 11 mice). Data are shown as mean ± s.e.m. *P < 0.05; **P < 0.01; ***P < 0.001, as determined by one-way ANOVA with Dunnet’s multiple comparison test (c), two-way ANOVA (e) or log-rank (two-tailed Mantel–Cox) test (f).
Fig. 5
Fig. 5. Diurnal degranulation and pulmonary protection is neutrophil intrinsic.
a, Confocal micrographs (left) and quantification (right) of primary granules in neutrophils from WT mice at night (ZT13, n = 33 cells from three mice) or daytime (ZT5, n = 30 cells from three mice), and from mutant mice (n = 50 cells from three CXCR4∆N mice and 41 cells from three Bmal1∆N mice, both at ZT5); scale bar, 2 μm. b, TEM images (left) and quantification of electrodense azurophilic granules (right) in WT and mutant mice (all at ZT5), showing increased granule content in Bmal1∆N and reduced in CXCR4∆N neutrophils compared with WT cells; n = 19 cells from three mice each; scale bar, 1 μm. c, Ex vivo NET formation in sorted WT, Bmal1∆N or CXCR4∆N neutrophils stimulated with PMA or vehicle as control; n = 3 mice per condition. d, Quantification of NET-like structures normalized to the number of neutrophils during ALI in Bmal1∆N (purple line) or CXCR4∆N (blue line) mice. Time course and elevations from baseline (gray area) are shown in the left panel, and the areas under the curve are shown in the right panel (individual data points are not shown here as this graph uses a mean ± s.e.m. value for the area under the curve calculated from the data shown in the left panel). Experiments were performed at ZT5. Data from wild-type mice at ZT5 (light gray, dashed) and ZT13 (dark gray, dashed) from Fig. 4c are shown for reference; n = 15 fields from three mice for each condition. e, Representative images of longitudinal CT series of edema (red) in mutant mice subject to ALI (left) at ZT5, and quantification of the edema volume over time (right); n = 7 mice per genotype. f, Survival curves for Bmal1∆N (n = 19 mice) and CXCR4∆N (n = 12 mice) mice subjected to ALI at ZT5. Data are shown as mean ± s.e.m. *P < 0.05; **P < 0.01; ***P < 0.001; NS, not significant, as determined by one-way ANOVA with Dunnet’s multiple comparison test (ad), two-way ANOVA (e) or two-sided log-rank (Mantel–Cox) test (f).
Fig. 6
Fig. 6. Evidence for neutrophil disarming and pulmonary protection in humans.
a, Blood neutrophil counts in human volunteers at the different time points; n = 10 human volunteers per time point. b, Light-scattering (SSC-A) values for human neutrophils at different times, as measured by flow cytometry; n = 10 human volunteers. c, Quantification of primary granules from confocal images of human neutrophils from images in d; n = 150 cells from ten volunteers per time point. d, Representative images of granule content of human neutrophils, quantified in c. e, Transmission electron micrographs (left) of human neutrophils in the morning (8:00) and early afternoon (14:00), and quantification (right) showing reduced numbers of electrodense primary granules; n = 33 cells from three human volunteers per time point. f, Volcano plot of the human neutrophil proteome analyzed at 8:00 and 14:00, showing proteins with P < 0.001 (see Methods for human TMT proteomics). A negative Z score represents higher values at 8:00 over 14:00 neutrophils; n = 5 per time point. g, Volcano plot of granule proteins in the human neutrophil proteome, showing higher content in granule proteins (color-coded) at 8:00 compared with 14:00; n = 5 samples from healthy volunteers. Red dots and labels show differentially expressed proteins with P < 0.05, and black dots show all granule proteins. Label color indicates the granule type in which the protein is normally found (top right). h,i, Representative confocal images (h) and quantification (i) of ex vivo NET formation by human neutrophils stimulated with PMA or vehicle at the indicated time points; n = 10 volunteers per time point. j, ARDS severity shown as the pneumonia severity index (left) and intrahospital deaths (right) of patients entering the intensive care unit at different times of the day; n = 125 patients. Data are shown as mean ± s.e.m. **P < 0.01, as determined by unpaired two-tailed t-test analysis (f). P values for the circadian plots were calculated by the amplitude versus zero two-tailed t-test analysis (ac,g,i). Maroon line in ac, g and i shows the nonlinear COSINOR fit of the data.
Extended Data Fig. 1
Extended Data Fig. 1. Validation and analysis of neutrophil proteomics.
a, Experimental strategy for proteomic analysis of day-like (from P- and E-selectin treated mice) and night-like (from AMD3100-treated mice) neutrophils isolated by negative selection (see methods) from blood. b, Intracellular staining of proteins from the proteomics dataset for validation in fresh (blue) and aged (violet) neutrophils obtained as indicated in a. All the proteins analyzed correlated with the proteomics data; n = 3 mice per condition. c, GO terms of the differentially expressed proteins (FDR<0.05, see methods section for 18O proteomics) in the proteomics dataset, showing terms with p < 0.05 (from single samples of 60 million neutrophils pooled from 9 mice (night) and 6 mice (day)). Bubble size represents overlap of query vs. the GO term. d, Scatterplot, correlation coefficient and significance level (pvalue) of the Spearman’s correlation of the direction of change of common proteins and genes from our proteomic analysis of fresh and aged neutrophils (this paper) and circadian RNA-sequencing data previously reported (Adrover et al. 2019, from 3 mice at ZT5 and 3 mice at ZT13), showing poor correlation of RNA and protein content. e, Venn-diagram showing the number of differentially detected proteins (p < 0.05, see methods section for mouse TMT proteomics) between vehicle- and AMD3100-treated mice (at ZT5); n = 3 samples per group. f, Heatmap showing levels of granule proteins in this dataset, Note increased detection of most granule proteins in neutrophils from AMD3100-treated mice. Data in (b) are shown as mean ± SEM. *; p < 0.05; **, p < 0.01; ***, p < 0.001, as determined by unpaired two-tailed t-test analysis.
Extended Data Fig. 2
Extended Data Fig. 2. Degranulation of neutrophils in the circulation and in tissues.
a, Reactome pathway analysis of the proteome of night and day neutrophils (see methods section for 18O proteomics, from single samples of 60 million neutrophils pooled from 9 mice (night) and 6 mice (day)) showing pathways with p-value < 0.05. b, Light-scattering properties (a measure of granularity) of blood neutrophils during a full diurnal cycle, measured as side-scatter in flow cytometry. Data are for WT, CXCR2-, CXCR4- or Bmal1-deficient neutrophils, showing that cell-intrinsic disruption of clock regulators blunts diurnal fluctuation in granularity. Curves are repeated for two cycles (dashed line) to better appreciate the circadian pattern; n = 10 (WT), 3 (CXCR2∆N), 4 (CXCR4∆N) and 4 (Bmal1∆N) mice per time point. c, Kinetics of total (top) or aged (bottom) neutrophils in blood indicating times of release of young or accumulation of aged neutrophils; n = 5 mice (ZT13, ZT17, ZT21, ZT1 and ZT9), n = 4 mice (ZT5). d, Shift of the light cycle alters the pattern of granule content in neutrophils. Left, representative confocal images of sorted neutrophils (MPO, green; DAPI, blue; scale, 5 μm); right, granule content per cell at the indicated times and light regime; n = 3 mice. LD, light-dark cycle; DL, dark-light (inverted) cycle. e, Representative confocal images (scale, 1 μm) and f, quantification of granule content in neutrophils from the blood or tissues of WT mice, showing reduced granule counts in tissues compared with blood; n = 30 (blood, lung and spleen), n = 27 (Liver) cells from 3 mice. Data are shown as mean ± SEM. *; p < 0.05; ***, p < 0.001; n.s., not significant, as determined by one-way ANOVA with Dunnet’s multiple comparison test (d), or using the amplitude vs. zero two-tailed t-test for circadian curves (b).
Extended Data Fig. 3
Extended Data Fig. 3. CXCR2-deficient neutrophils are responsive to activating stimuli.
a, Representative confocal images (scale, 2 μm) and b, quantification of granule content (top) and MPO intensity (bottom) in CXCR2-deficient neutrophils upon LPS or PMA stimulation. Granule loss indicates that CXCR2-deficient neutrophils are responsive to inflammatory stimuli; n = 15 cells per group. Data are shown as mean ± SEM. **; p < 0.01; ***, p < 0.001, as determined.
Extended Data Fig. 4
Extended Data Fig. 4. Regulation of circadian patterns by Bmal1.
a, Representative confocal images (left) and quantification of granule content (right) in Bmal1-deficient neutrophils at ZT13 (night) and ZT5 (day). n = 30–31 cells from 3 mice; scale 2 μm. b, Ex vivo NET formation by Bmal1-deficient neutrophils at ZT5 and ZT13. Note that Bmal1-deficient neutrophils fail to display circadian oscillations in both granule and NET formation. n = 3 mice per time point. c, Experimental design of circadian proteomic analysis of Bmal1-deficient neutrophils. d, Granule proteins (left) and NET-associated proteins (right) in the circadian Bmal1∆N neutrophil proteome (n = 3 mice at ZT5 and n = 2 at ZT13). Black dots show all granule or NET-associated proteins, respectively, none of which reached significance in differential expression between night and day (FDR < 0.05, see methods section for TMT proteomics of mouse neutrophils). e, Heatmap of granule proteins in the circadian proteome of wild-type (same as in Fig. 1) and Bmal1∆N neutrophils. Note that the diurnal pattern is lost in Bmal1-deficient neutrophils. Data in (a-b) are shown as mean ± SEM; n.s., not significant, as determined by unpaired two-tailed t-test.
Extended Data Fig. 5
Extended Data Fig. 5. Normal circadian oscillations in Balb/c mice.
a, Total (left) and CD62LO aged (right) neutrophil counts in the blood of Balb/c mice; n = 4–5 mice per time. b, Circadian oscillations in CD62L and CXCR2 expression in neutrophils from Balb/c mice, measured as median fluorescence intensity (MFI) by flow cytometry n = 5 mice (ZT13, ZT17, ZT21, ZT1 and ZT9), n = 4 mice (ZT5). c, Side scatter values plotted together with surface levels of CD62L in neutrophils, showing similar fluctuation patterns as reported for C57BL/6 neutrophils; n = 5 mice (ZT13, ZT17, ZT21, ZT1 and ZT9), n = 4 mice (ZT5). All curves are repeated for two cycles (dashed line) to better appreciate the circadian pattern. Data are shown as mean ± SEM. P values were determined by the amplitude vs. zero two-tailed t-test.
Extended Data Fig. 6
Extended Data Fig. 6. Neutrophils and platelets in the lung microvasculature during ALI.
Quantification of neutrophil a, and platelet b, numbers per field of view over time in wild-type mice subject to ALI at night (ZT13, blue line) or during daytime (ZT5, red line), in the intravital imaging experiments shown in Fig. 4c. Insets show area under the curve (AUC) values; n = 15 fields from 4 mice in each group. c, Neutrophil numbers in the lungs of naïve, LPS-only and wild-type mice in which ALI was induced at ZT5 (n = 8 mice) or ZT13 (n = 5 mice), or at ZT5 in the presence of Cl-amidine (n = 5 mice), as determined by flow cytometry. Neutrophils d, and platelets e, numbers in mutant mice (Bmal1∆N purple line; CXCR4∆N blue line) from the intravital imaging experiments shown in Fig. 5d; n = 15 fields from 4 mice in each genotype. Insets show area under the curve (AUC) values. f, Neutrophil numbers in the lungs of LPS-only control mice (n = 5) or during ALI in Bmal1ΔN (n = 4 mice) or Cre- control (n = 4 mice); and CXCR4ΔN (n = 5 mice) or Cre- control mice (n = 4 mice), as determined by flow cytometry. g, Interactions between platelets and the uropod (U) or leading edge (LE) of adherent neutrophils, in the inflamed cremasteric microvessels of wild-type (n = 45 from 3 mice), Bmal1ΔN (n = 28 from 3 mice) and CXCR4ΔN mice (n = 31 from 3 mice); scale, 5 μm. Data are shown as mean ± SEM. **; p < 0.01; ***, p < 0.001; n.s., not significant, as determined by unpaired two-tailed t-test analysis (a-d) or one-way ANOVA with Dunnet’s multiple comparison test (e-g). In the insets in a-d, individual data points are not shown as this graph uses a mean ± SEM value for the area under the curve calculated from the data shown in the respective panels.
Extended Data Fig. 7
Extended Data Fig. 7. Vascular leakiness and types of NETs during ALI.
Vascular leakiness in a, wild-type, b, Bmal1∆N, and c, CXCR4∆N mice after induction of ALI (LPS + antibody) or in control mice treated with LPS only. WT and Bmal1∆N mice displayed increased leakiness only in lungs upon ALI induction, while CXCR4∆N mice were protected; n = 3 (LPS only) and 5 (ALI) mice per genotype; d, Time-lapse images showing examples of flowing and adherent NETs (asterisks) as observed by intravital imaging of the lung microvasculature during ALI, representative of n = 3 independent experiments. See also Supplementary Movie 5. e, Relative frequency of NET types in WT, Bmal1∆N and CXCR4∆N mice during ALI, n = 15 fields from 3 mice (WT), 10 fields from 3 mice (Bmal1∆N) and 15 fields from 3 mice (CXCR4∆N). Data are shown as mean ± SEM. *; p < 0.05; ***, p < 0.001; n.s., not significant, as determined by two-way ANOVA (a-c; unless otherwise specified, comparisons did not reach significance; and e).
Extended Data Fig. 8
Extended Data Fig. 8. Loss of circadian patterns in Bmal1∆N and CXCR4∆N mice.
a, Survival of wild-type, Bmal1∆N and CXCR4∆N mice subjected to ALI at night (ZT13, solid line) or daytime (ZT5, dashed line); n = 16 mice (ZT5) and 18 mice (ZT13) for wild-type, n = 10 mice per time point for Bmal1∆N; n = 12 mice (ZT5) and 14 mice (ZT13) for CXCR4∆N. b, Representative confocal images (top) and quantification of granule content (bottom) in CXCR4-deficient neutrophils at ZT13 and ZT5. Note the loss of diurnal fluctuations compared with wild-type mice (see Fig. 1e); n = 30 cells (from 3 mice) per time point; scale, 2 μm. c, Ex vivo NET formation after PMA stimulation by CXCR4∆N neutrophils analyzed at ZT13 (n = 3 mice) and ZT5 (n = 3 mice). Note the loss of diurnal changes in NET-formation compared with wild-type cells (see Fig. 2b); d, Neutrophil counts in blood at ZT5 and ZT13 in wild-type (n = 5 mice at ZT5 and 4 mice at ZT13) and Bmal1∆N mice (n = 4 mice per time point). Data are shown as mean ± SEM. *, p < 0.05; **, p < 0.01; n.s., not significant, as determined by two-sided log rank (Mantel-Cox) test (a) or unpaired two-tailed t-test (b-d).
Extended Data Fig. 9
Extended Data Fig. 9. Analysis of the human neutrophil proteome.
a, Experimental design. Blood from 10 healthy volunteers was extracted at 8 am, 2 pm and 7 pm. Neutrophils were purified for proteomic analysis, granule quantification and NET-formation assays. b, GO terms of the differentially expressed proteins between 8am and 2 pm in human neutrophils. c, Correlation analysis (Spearman) of the direction of change of common proteins and genes from paired human proteomic (n = 5 per time) and RNA sequencing (n = 3 per time) analysis, showing poor correlation of RNA and protein content. d, Volcano plot of the human neutrophil proteome highlighting proteins found in NETs. Red dots and labels show proteins that are significantly different among samples (p < 0.05), and black dots show all other NET proteins, and dots show the whole proteome dataset.
Extended Data Fig. 10
Extended Data Fig. 10. Graphical abstract.
Neutrophils are released from the bone marrow into the bloodstream enriched in granule-held antimicrobial, cytotoxic and NET-forming proteins. As they spend time in the circulation, they undergo a homeostatic process of proteome ‘disarming’ that is regulated by the clock gene Bmal1 and signaling through CXCR2. This process causes a reduction in granule content and their ability to form NETs, ultimately reducing their toxicity towards host tissues. During acute lung injury, the presence of granule-poor neutrophils at specific times of day or in CXCR4 mutants protects the lungs and increases survival. Disabling homeostatic degranulation in Bmal1 mutants, in contrast, increases organ damage and death at all times of day.

Comment in

  • Of larks and owls.
    Kaplan MJ. Kaplan MJ. Nat Immunol. 2020 Feb;21(2):104-105. doi: 10.1038/s41590-019-0579-7. Nat Immunol. 2020. PMID: 31932811 Free PMC article. No abstract available.

References

    1. Cowland JB, Borregaard N. Granulopoiesis and granules of human neutrophils. Immunol. Rev. 2016;273:11–28. - PubMed
    1. Ley K, et al. Neutrophils: new insights and open questions. Sci. Immunol. 2018;3:eaat4579. - PubMed
    1. Borregaard N, Sørensen OE, Theilgaard-Mönch K. Neutrophil granules: a library of innate immunity proteins. Trends Immunol. 2007;28:340–345. - PubMed
    1. Rørvig S, Østergaard O, Heegaard NH, Borregaard N. Proteome profiling of human neutrophil granule subsets, secretory vesicles, and cell membrane: correlation with transcriptome profiling of neutrophil precursors. J. Leukoc. Biol. 2013;94:711–721. - PubMed
    1. Borregaard N. Neutrophils, from marrow to microbes. Immunity. 2010;33:657–670. - PubMed

Publication types

MeSH terms