

High-throughput quantitative top-down proteomics
- PMID: 31932818
- PMCID: PMC7529119
- DOI: 10.1039/c9mo00154a
High-throughput quantitative top-down proteomics
Abstract
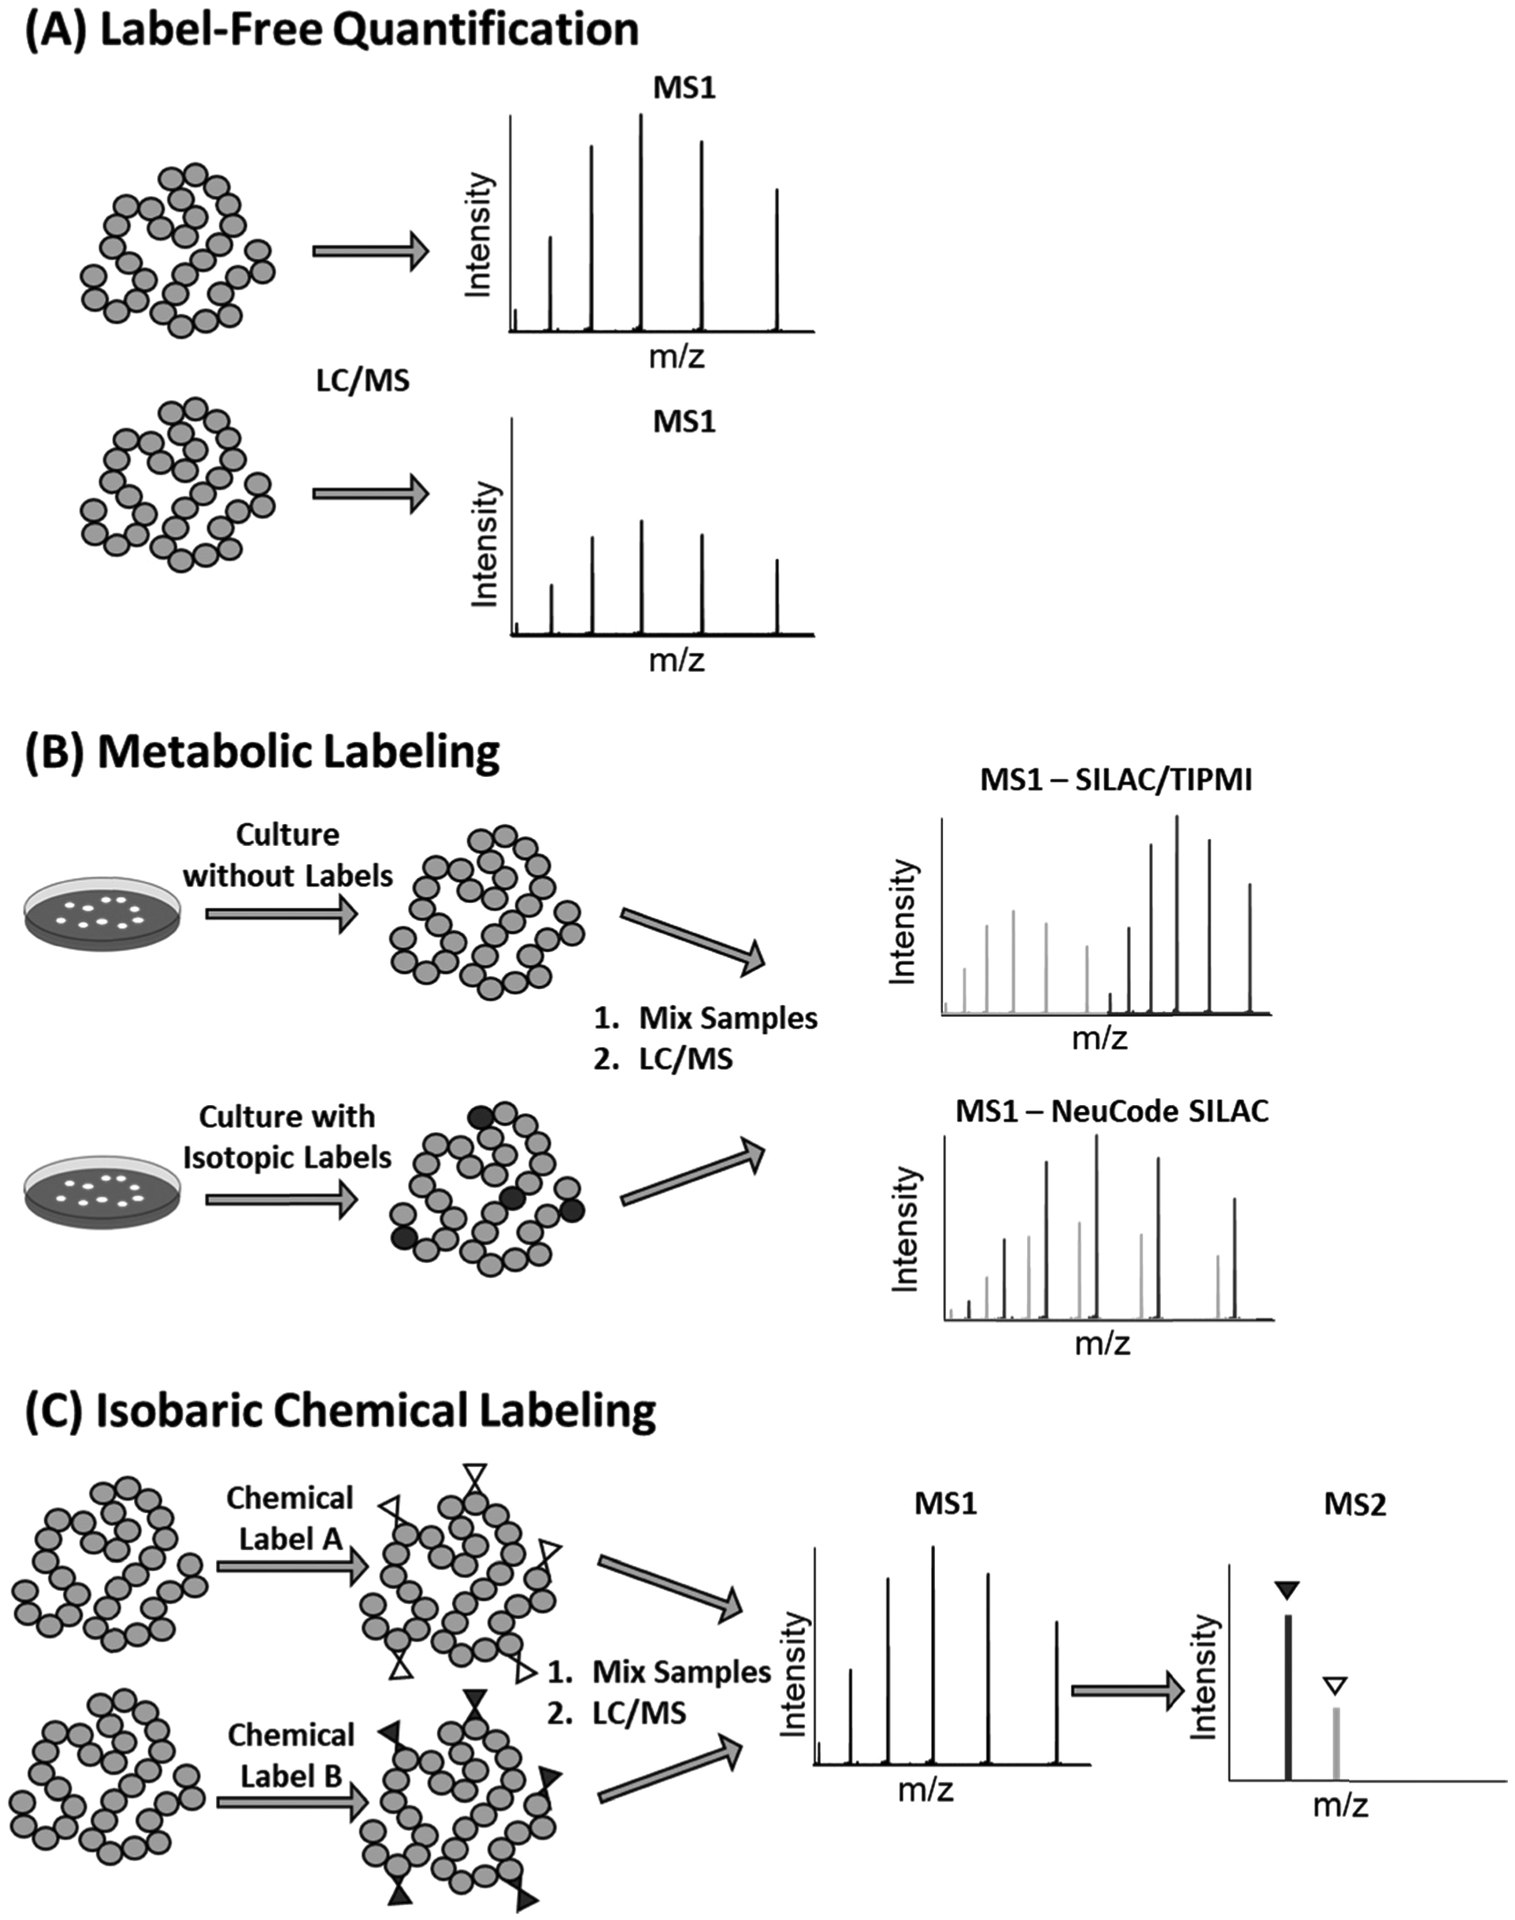
Top-down mass spectrometry (MS) analyzes intact proteins at the proteoform level, which allows researchers to better understand the functions of protein modifications. Recently, top-down proteomics has increased in popularity due to advancements in high-resolution mass spectrometers, increased efficiency in liquid chromatography (LC) separation, and advances in data analysis software. Some unique protein proteoforms, which have been distinguished using top-down MS, have even been shown to exhibit marked variation in biological function compared to similar proteoforms. However, the qualitative identification of a particular proteoform may not be enough to determine the biological relevance of that proteoform. Quantitative top-down MS methods have been notably applied to the study of the differing biological functions of protein proteoforms and have allowed researchers to explore proteomes at the proteoform, rather than the peptide, level. Here, we review the top-down MS methods that have been used to quantitatively identify intact proteins, discuss current applications of quantitative top-down MS analysis, and present new areas where quantitative top-down MS analysis may be implemented.
Conflict of interest statement
Conflicts of interest
There are no conflicts to declare.
Figures
References
Publication types
MeSH terms
Grants and funding
LinkOut - more resources
Full Text Sources
Other Literature Sources