. 2020 Feb;238(2):395-409.
doi: 10.1007/s00221-019-05711-y. Epub 2020 Jan 13.

Visual cues, expectations, and sensorimotor memories in the prediction and perception of object dynamics during manipulation

Affiliations

Visual cues, expectations, and sensorimotor memories in the prediction and perception of object dynamics during manipulation

Thomas Rudolf Schneider et al. Exp Brain Res. 2020 Feb.

Abstract

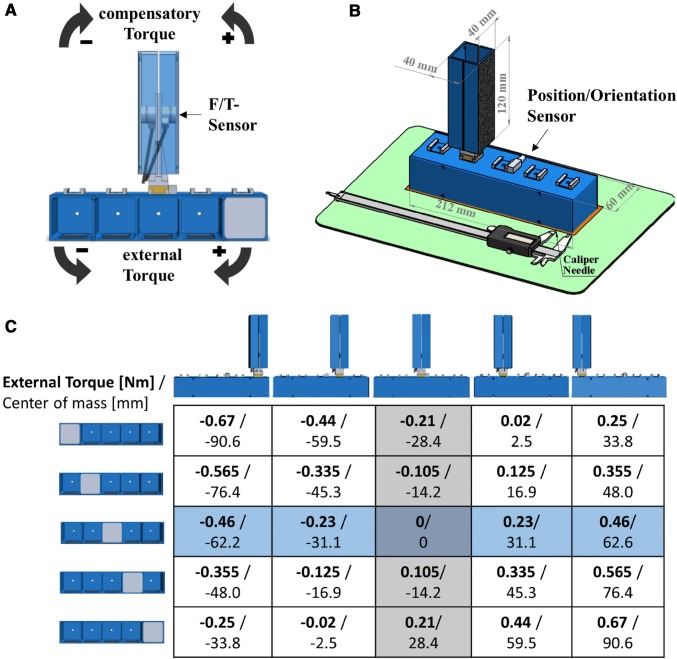
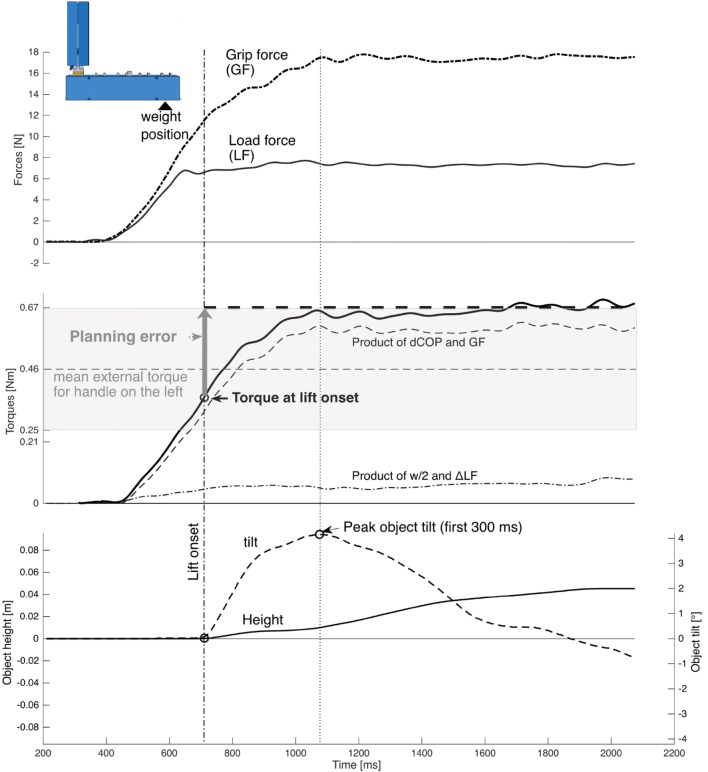
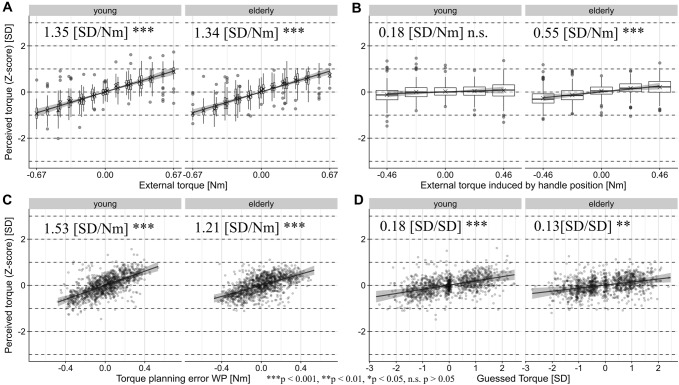
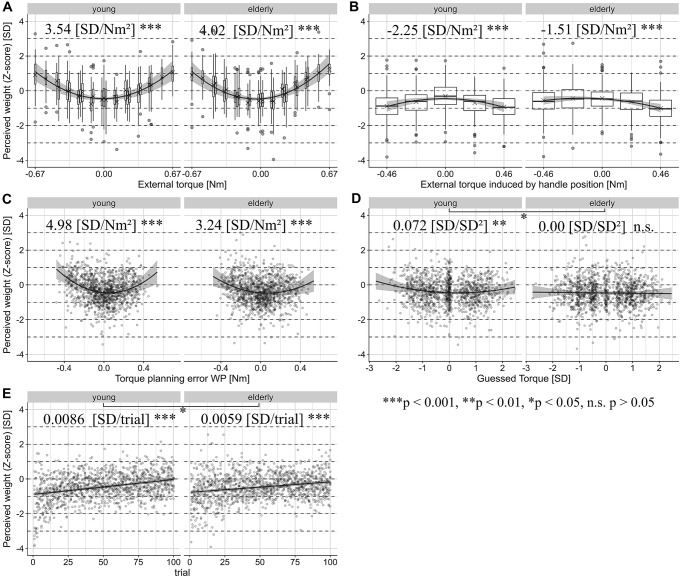
When we grasp and lift novel objects, we rely on visual cues and sensorimotor memories to predictively scale our finger forces and exert compensatory torques according to object properties. Recently, it was shown that object appearance, previous force scaling errors, and previous torque compensation errors strongly impact our percept. However, the influence of visual geometric cues on the perception of object torques and weights in a grasp to lift task is poorly understood. Moreover, little is known about how visual cues, prior expectations, sensory feedback, and sensorimotor memories are integrated for anticipatory torque control and object perception. Here, 12 young and 12 elderly participants repeatedly grasped and lifted an object while trying to prevent object tilt. Before each trial, we randomly repositioned both the object handle, providing a geometric cue on the upcoming torque, as well as a hidden weight, adding an unforeseeable torque variation. Before lifting, subjects indicated their torque expectations, as well as reporting their experience of torque and weight after each lift. Mixed-effect multiple regression models showed that visual shape cues governed anticipatory torque compensation, whereas sensorimotor memories played less of a role. In contrast, the external torque and committed compensation errors at lift-off mainly determined how object torques and weight were perceived. The modest effect of handle position differed for torque and weight perception. Explicit torque expectations were also correlated with anticipatory torque compensation and torque perception. Our main findings generalized across both age groups. Our results suggest distinct weighting of inputs for action and perception according to reliability.

Keywords: Grasping; Sensorimotor memories; Torque perception; Visual processing; Weight perception.


Conflict of interest statement

The authors declare no competing financial or non-financial interests.

Figures

Fig. 1
Fig. 1
Experimental setup. The custom-built grip-device consists of a handle element which was randomly positioned on one of five slots along a horizontal bar via dove-tail linkups (a, b). The handle element allowed subjects to freely choose digit placement on the sandpaper (Bosch, P320) covered gasp surfaces (40 × 120 mm) (b). Additionally, a 250 g aluminum weight was randomly placed into the five cavities of the horizontal bar. The resulting horizontal centers of mass and external torques after lift onset for a vertical object orientation are denoted in c for each combination of handle and weight position. A detachable lid blocked the cavities from view (b). 6-axis force/torque sensors were mounted below the aluminum panels underneath the grasp surfaces, blocked from view (the panels are rendered transparent for illustrative purposes in a. A magnetic position/ orientation tracker was mounted centrally on the horizontal bar (a, b). To indicate their perception of the center of mass/the external torque, subjects used the needle of a digital caliper which was parallel to the horizontal bar and aligned with the right edge of the grip device (b)
Fig. 2
Fig. 2
Representative trial illustrating the task variables. The upwards directed load force sum (LF) exceeds the gravitational force prior to object lift onset (vertical dash-dotted line). The mean grip force (GF) acting orthogonal towards the grasp surfaces causes friction preventing finger slip. To prevent object tilt, the total exerted torque must compensate for the external torque (horizontal dashed line in the torques subplot). The gray area shows the range of torque which may occur for the depicted handle position with the central horizontal line denoting the external torque for this handle position given a weight placement in the middle cavity. The planning error denotes the difference between the external torque and the exerted torque at lift onset, hence the uncompensated or net torque at lift onset. The planning error is highly correlated with the peak object tilt occurring in the first 300 ms after lift onset (vertical dashed line)
Fig. 3
Fig. 3
Partial regression plots of the main effects of the linear mixed-effect model for Tcom with 95% confidence intervals of the regression coefficients computed by parametric bootstrapping. The partial residuals are displayed. The effects are separately plotted for both age groups. For predictors with discrete values, we display the distribution of the data with box and whiskers plots in the style of Tukey. The central horizontal line represents the median, while the lower and upper hinges correspond to the 25th and 75th percentiles, respectively. The upper and lower whiskers extend from the upper and lower hinge to the largest value no further than 1.5 * inter-quartile ranges from the respective hinges. Data beyond are plotted individually. Additionally, the means are indicated by ‘X’. The regression estimates as well as their significance level are noted
Fig. 4
Fig. 4
Partial regression plots of the main effects of the linear mixed-effect model for the perceived torque with 95% confidence intervals of the regression coefficients computed by parametric bootstrapping. The partial residuals are displayed. The effects are separately plotted for both age groups. For predictors with discrete values, we display the distribution of the data with box and whiskers plots in the style of Tukey, with additional ‘X’ denoting the means. The regression estimates as well as their significance level are noted
Fig. 5
Fig. 5
Partial regression plots of the main effects of the linear mixed-effect model for the perceived weight with 95% confidence intervals of the regression coefficients computed by parametric bootstrapping. The partial residuals are displayed. The effects are separately plotted for both age groups. For predictors with discrete values, we display the distribution of the data with box and whiskers plots in the style of Tukey, with additional ‘X’ denoting the means. The regression estimates as well as the significance levels of the main effects and significant interactions with age group are noted

References

    1. Aarts E, Verhage M, Veenvliet JV, Dolan CV, van der Sluis S. A solution to dependency: using multilevel analysis to accommodate nested data. Nat Neurosci. 2014;17:491–496. - PubMed
    1. Bates JCPDM, Pinheiro J, Pinheiro JC, Bates D. Mixed-Effects Models in S and S-PLUS. New York: Springer; 2000.
    1. Bates D, Kliegl R, Vasishth S, Baayen H (2015a) Parsimonious mixed models. http://arxivorg/abs/150604967
    1. Bates D, Mächler M, Bolker B, Walker S. Fitting linear mixed-effects models using lme4. J Stat Softw. 2015;67:1–48.
    1. Bays PM, Wolpert DM. Computational principles of sensorimotor control that minimize uncertainty and variability. J Physiol. 2007;578:387–396. - PMC - PubMed