. 2020 Jan 14:9:e49797.
doi: 10.7554/eLife.49797.

Biochemical reconstitution of branching microtubule nucleation

Affiliations

Biochemical reconstitution of branching microtubule nucleation

Raymundo Alfaro-Aco et al. Elife. .

Abstract

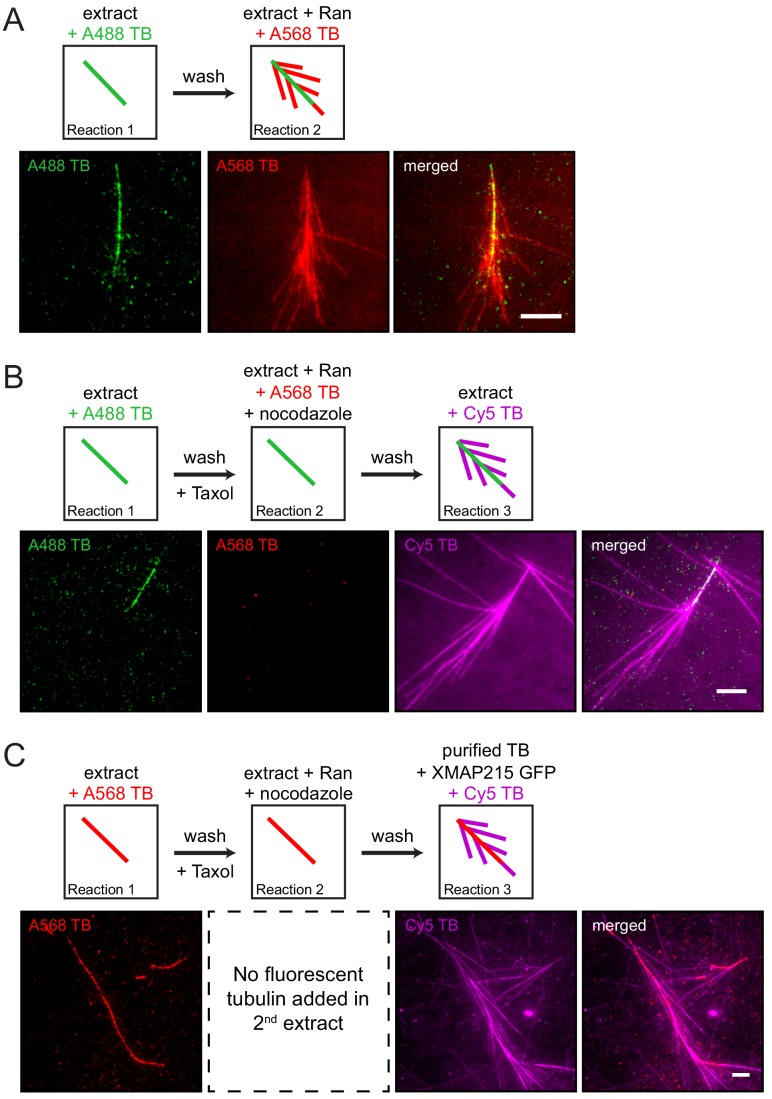
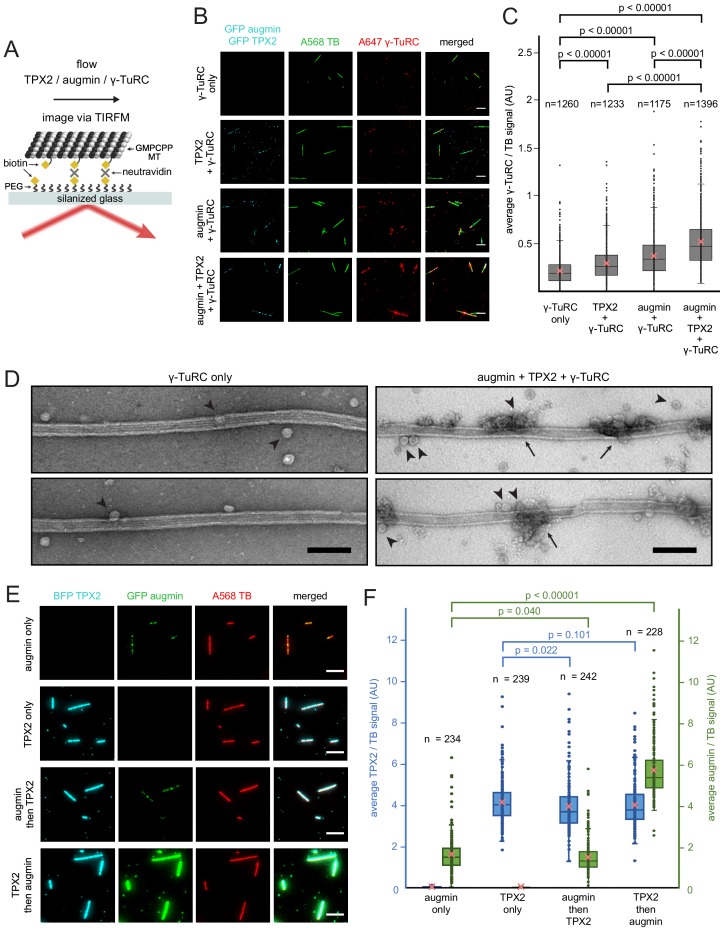
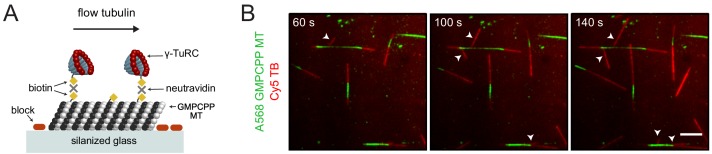
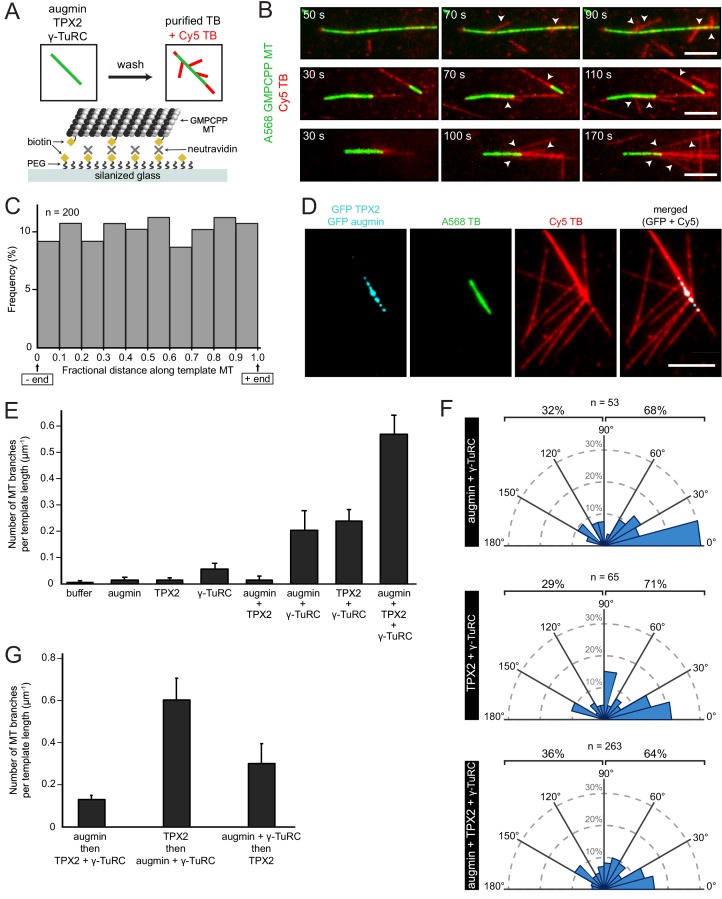
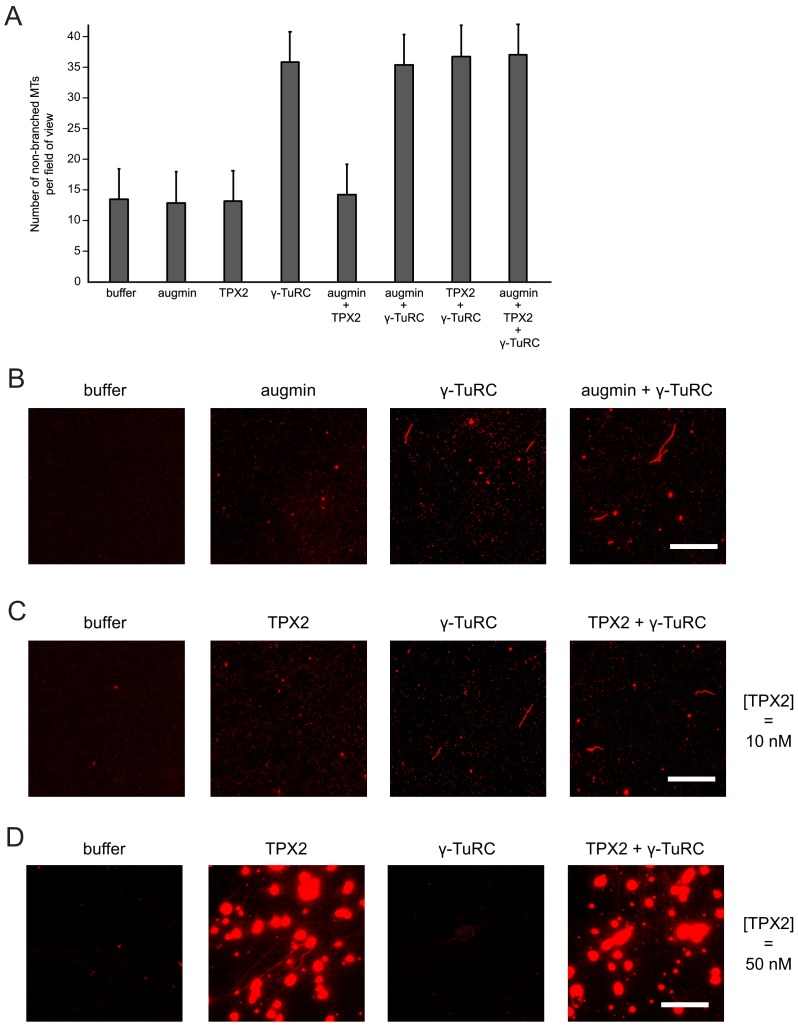
Microtubules are nucleated from specific locations at precise times in the cell cycle. However, the factors that constitute these microtubule nucleation pathways and their mode of action still need to be identified. Using purified Xenopus laevis proteins we biochemically reconstitute branching microtubule nucleation, which is critical for chromosome segregation. We found that besides the microtubule nucleator gamma-tubulin ring complex (γ-TuRC), the branching effectors augmin and TPX2 are required to efficiently nucleate microtubules from pre-existing microtubules. TPX2 has the unexpected capacity to directly recruit γ-TuRC as well as augmin, which in turn targets more γ-TuRC along the microtubule lattice. TPX2 and augmin enable γ-TuRC-dependent microtubule nucleation at preferred branching angles of less than 90 degrees from regularly-spaced patches along microtubules. This work provides a blueprint for other microtubule nucleation pathways and helps explain how microtubules are generated in the spindle.

Keywords: biochemistry; branching; cell biology; chemical biology; microtubule; nucleation; reconstitution; xenopus.


Conflict of interest statement

RA, AT, SP No competing interests declared

Figures

Figure 1.
Figure 1.. The proteins necessary for branching microtubule nucleation in Xenopus egg extract bind to a pre-existing microtubule independent of the nucleation event.
(A–C) Sequential reactions with Xenopus egg extract. (A) Single microtubules formed on the glass surface in the first extract supplemented with Alexa488 tubulin (green). A second extract supplemented with Alexa568 tubulin (red) and RanQ69L was subsequently introduced. New microtubules (red) nucleated from pre-existing microtubules (green). See Figure 1—video 1. (B) Single microtubules formed on the glass surface in the first extract supplemented with Alexa488 tubulin (green). A second extract supplemented with Alexa568 tubulin (red), RanQ69L and nocodazole was subsequently introduced, followed by a third extract supplemented with Cy5 tubulin (magenta). Branched microtubules (magenta) nucleated from pre-existing microtubules (green) via the branching factors released in the second extract, while no microtubules formed in the presence of nocodazole (red). See Figure 1—figure supplement 1 and Figure 1—figure supplement 2A. (C) Similar to (B), except that the first extract was supplemented with Alexa568 tubulin (red), the second extract contained no fluorescent tubulin, and the third extract reaction was substituted for purified Cy5 tubulin (magenta) and XMAP215. Branched microtubules (magenta) nucleated from pre-existing microtubules (red), which had been pre-loaded with branching factors in the second extract. See Figure 1—figure supplement 2B and Figure 1—video 2. For all experiments, images were collected approximately 5 min after the last solution was exchanged. Scale bars, 5 μm. The experiments were repeated three times with different Xenopus egg extracts.
Figure 1—figure supplement 1.
Figure 1—figure supplement 1.. Testing the inhibitory effect of nocodazole in Xenopus egg extract.
Branching microtubule nucleation was stimulated in Xenopus egg extract with 10 μM RanQ69L in the presence of increasing concentrations of nocodazole. microtubules were labeled with Alexa568 tubulin (red) and their plus-ends with EB1-GFP (green). Scale bars, 10 μm. The experiment was repeated three times with different Xenopus egg extracts.
Figure 1—figure supplement 2.
Figure 1—figure supplement 2.. Sequential Xenopus egg extract reactions.
(A) Single microtubules formed on the glass surface in the first extract supplemented with Alexa488 tubulin (green). A second extract supplemented with Alexa568 tubulin (red) and nocodazole, but lacking RanQ69L, was subsequently introduced, followed by a third extract supplemented with Cy5 tubulin (magenta). Pre-existing microtubules (green) only extended from their plus-ends (magenta) in the third extract reaction because no branching factors were released in the second reaction step, while no microtubules formed in the presence of nocodazole (red). (B) Analogous to (A), except that the second extract was supplemented with RanQ69L, and the third extract reaction was substituted for purified Cy5 tubulin (magenta). Branched microtubules (magenta) nucleated from pre-existing microtubules (green), while no microtubules formed in the presence of nocodazole (red). For all experiments, images were collected approximately 5 min after the last solution was exchanged. Scale bars, 5 μm. The experiments were repeated three times with different Xenopus egg extracts.
Figure 2.
Figure 2.. Binding of augmin, TPX2 and γ-TuRC to a template microtubule.
(A) Diagram of the experimental set-up. GMPCPP-stabilized microtubules were attached to a PEG-passivated cover glass with biotin-neutravidin links. (B) γ-TuRC (10 nM) visualized using Alexa647-labeled antibodies (red) along microtubules (green), in the absence or presence of GFP-augmin (50 nM) and GFP-TPX2 (50 nM) (cyan). Scale bars, 5 μm. (C) Boxplot of average γ-TuRC signal relative to the average tubulin signal, where each dot represents one microtubule from the experiment in (B). The number of microtubules (n) was obtained from four replicates using γ-TuRC purified from two different preps. (D) GMPCPP-stabilized microtubules incubated with γ-TuRC (10 nM) only or with augmin (50 nM), TPX2 (50 nM) and γ-TuRC (10 nM), visualized by electron microscopy after uranyl acetate staining. Ring-shaped structures that correspond to γ-TuRCs (arrowheads), and clusters of protein formed on microtubules (arrows) are visible. Scale bars, 100 nm. (E) GFP-augmin (50 nM) (green) and BFP-TPX2 (50 nM) (cyan) visualized along microtubules (red) by themselves or in sequential binding steps. Scale bars, 5 μm. (F) Boxplot of average BFP-TPX2 signal or GFP-augmin signal relative to the average tubulin signal, where each dot represents one microtubule from the experiment in (E). The number of microtubules (n) was obtained from two replicates. For (C) and (F), the boxes extend from 25th to 75th percentiles, the whiskers extend from minimum to maximum values, and the mean values are plotted as crosses. P-values were calculated from independent T-tests.
Figure 2—figure supplement 1.
Figure 2—figure supplement 1.. Microtubule nucleation from artificially-attached γ-TuRCs to a template microtubule.
(A) Diagram of the experimental set-up. GMPCPP-stabilized microtubules attached non-specifically to a silanized cover glass, and γ-TuRCs (10 nM) attached to the microtubules with biotin-neutravidin links. Nucleation of new microtubules was visualized using Cy5 tubulin. (B) Using the set-up in (A), the formation of artificial microtubule branches (red, arrowheads) from GMPCPP-stabilized microtubules (green) was observed. Scale bar, 5 μm. Experiment was performed once.
Figure 2—figure supplement 2.
Figure 2—figure supplement 2.. Purified TPX2, augmin and γ-TuRC.
(A) SDS-PAGE of purified GFP-TPX2 visualized by Coomassie Blue staining. (B) SDS-PAGE of purified GFP-labeled augmin holocomplex visualized by silver staining. (C) SDS-PAGE of purified γ-TuRC visualized by silver staining. (D) Purified γ-TuRC visualized using negative stain electron microscopy. Scale bar, 100 nm.
Figure 3.
Figure 3.. Biochemical reconstitution of branching microtubule nucleation using purified augmin, TPX2 and γ-TuRC.
(A) Diagram of the experimental set-up. GMPCPP-stabilized microtubules were attached to a PEG-passivated cover glass with biotin-neutravidin links. Following the binding of augmin (50 nM), TPX2 (50 nM), and γ-TuRC (10 nM), nucleation of new microtubules was visualized using Cy5 tubulin. (B) Using the set-up in (A), the formation of microtubule branches (red, arrowheads) from GMPCPP-stabilized microtubules (green) was observed. Scale bars, 5 μm. See Figure 3—figure supplement 1A and Figure 3—video 1. (C) Fractional distance along the template microtubule where microtubule branches formed. The 0-point on the x-axis denotes nucleation at the minus-end of the template microtubule, while the 1-point denotes nucleation at the plus-end. The number of branching events (n) was obtained from twelve replicates using γ-TuRC purified from four different preps. (D) Same as (A), microtubule branches (red) grow from distinct GFP-augmin and GFP-TPX2 puncta (cyan) localized on GMPCPP-stabilized microtubules (green). (E) Number of microtubule branches per field of view after 4 min, normalized to the length of template microtubule available, for all the combinations of branching factors. Values are the mean of four replicates using γ-TuRC purified from one prep, and error bars represent standard error of the mean. (F) Angle of branching for three different combinations of branching factors. The number of branching events (n) was obtained from eight replicates using γ-TuRC purified from two different preps in the case of augmin + γ-TuRC and TPX2 + γ-TuRC, and from twelve replicates using γ-TuRC purified from four different preps in the case of augmin + TPX2 + γ-TuRC. (G) Number of microtubule branches per field of view after 4 min, normalized to the length of template microtubule available, for different binding sequences. Values are the mean of four replicates using γ-TuRC purified from one prep, and error bars represent standard error of the mean.
Figure 3—figure supplement 1.
Figure 3—figure supplement 1.. Microtubules can spontaneously form in solution and subsequently interact with the template GMPCPP-stabilized microtubule.
Time-lapse images from the experiment in Figure 3B showing an example of a microtubule (red, arrowhead) that is spontaneously nucleated in solution and contacts the GMPCPP-stabilized template microtubule (green) afterwards. Scale bar, 5 μm.
Figure 3—figure supplement 2.
Figure 3—figure supplement 2.. Branching microtubule nucleation with augmin + γ-TuRC and TPX2 + γ-TuRC.
(A) Similar to the experiment in Figure 3A–D, but using an unlabeled version of TPX2. GFP-augmin is present in the observed puncta on template microtubules. (B) Similar to the experiment in Figure 3A–B, but only augmin and γ-TuRC were bound to the GMPCPP-stabilized microtubule. The formation of some microtubule branches (red, arrowheads) from GMPCPP-stabilized microtubules (green) was observed. (C) Same as (B), microtubule branches (red) grow from distinct GFP-augmin puncta (cyan) localized on GMPCPP-stabilized microtubules (green). (D) Similar to the experiment in Figure 3A–B, but only TPX2 and γ-TuRC were bound to the GMPCPP-stabilized microtubule. The formation of some microtubule branches (red, arrowheads) from GMPCPP-stabilized microtubules (green) was also observed. (E) Same as (D), microtubule branches (red) grow from distinct GFP-TPX2 puncta (cyan) localized on GMPCPP-stabilized microtubules (green). Scale bars, 5 μm.
Figure 3—figure supplement 3.
Figure 3—figure supplement 3.. Effect of augmin and TPX2 on de novo microtubule nucleation.
(A) Quantification of non-branched microtubules from the experiment in Figure 3E. Values are the mean of four replicates using γ-TuRC purified from one prep, and error bars represent standard error of the mean. (B) Microtubule nucleation assay in solution with purified augmin (50 nM) and γ-TuRC (5 nM). (C) Microtubule nucleation assay in solution with purified TPX2 (10 nM) and γ-TuRC (5 nM). (D) Microtubule nucleation assay in solution with purified TPX2 (50 nM) and γ-TuRC (5 nM). Scale bars, 20 μm.
Figure 3—figure supplement 4.
Figure 3—figure supplement 4.. Reconstitution of branching microtubule nucleation using purified augmin, TPX2, γ-TuRC and XMAP215.
Similar to the experiment in Figure 3B, but comparing the effect of having GFP-XMAP215 in the final solution of Cy5 tubulin. The images correspond to the first frame of the time-lapse collected. The panels on the right (merged only) correspond to the same fields of view 70 s later. Scale bar, 5 μm. Experiment was performed once.
Author response image 1.

References

    1. Alfaro-Aco R, Thawani A, Petry S. Structural analysis of the role of TPX2 in branching microtubule nucleation. The Journal of Cell Biology. 2017;216:983–997. doi: 10.1083/jcb.201607060. - DOI - PMC - PubMed
    1. Bieling P, Telley IA, Hentrich C, Piehler J, Surrey T. Fluorescence microscopy assays on chemically functionalized surfaces for quantitative imaging of microtubule, motor, and +TIP dynamics. Methods in Cell Biology. 2010;95:555–580. doi: 10.1016/S0091-679X(10)95028-0. - DOI - PubMed
    1. Cunha-Ferreira I, Chazeau A, Buijs RR, Stucchi R, Will L, Pan X, Adolfs Y, van der Meer C, Wolthuis JC, Kahn OI, Schätzle P, Altelaar M, Pasterkamp RJ, Kapitein LC, Hoogenraad CC. The HAUS complex is a key regulator of Non-centrosomal microtubule organization during neuronal development. Cell Reports. 2018;24:791–800. doi: 10.1016/j.celrep.2018.06.093. - DOI - PMC - PubMed
    1. David AF, Roudot P, Legant WR, Betzig E, Danuser G, Gerlich DW. Augmin accumulation on long-lived microtubules drives amplification and kinetochore-directed growth. The Journal of Cell Biology. 2019;218:2150–2168. doi: 10.1083/jcb.201805044. - DOI - PMC - PubMed
    1. Decker F, Oriola D, Dalton B, Brugués J. Autocatalytic microtubule nucleation determines the size and mass of xenopus laevis egg extract spindles. eLife. 2018;7:e31149. doi: 10.7554/eLife.31149. - DOI - PMC - PubMed

Publication types