. 2020 Jan 2:8:1.
doi: 10.1038/s41413-019-0078-3. eCollection 2020.

Disruption of Dhcr7 and Insig1/2 in cholesterol metabolism causes defects in bone formation and homeostasis through primary cilium formation

Affiliations

Disruption of Dhcr7 and Insig1/2 in cholesterol metabolism causes defects in bone formation and homeostasis through primary cilium formation

Akiko Suzuki et al. Bone Res. .

Abstract

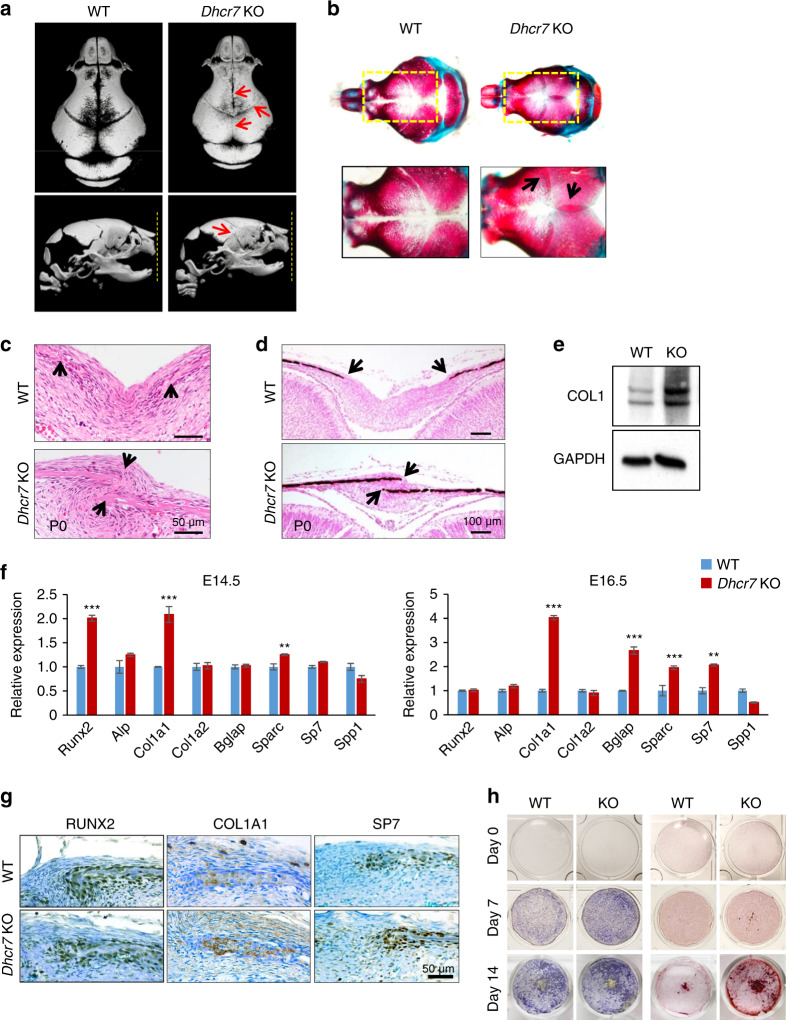
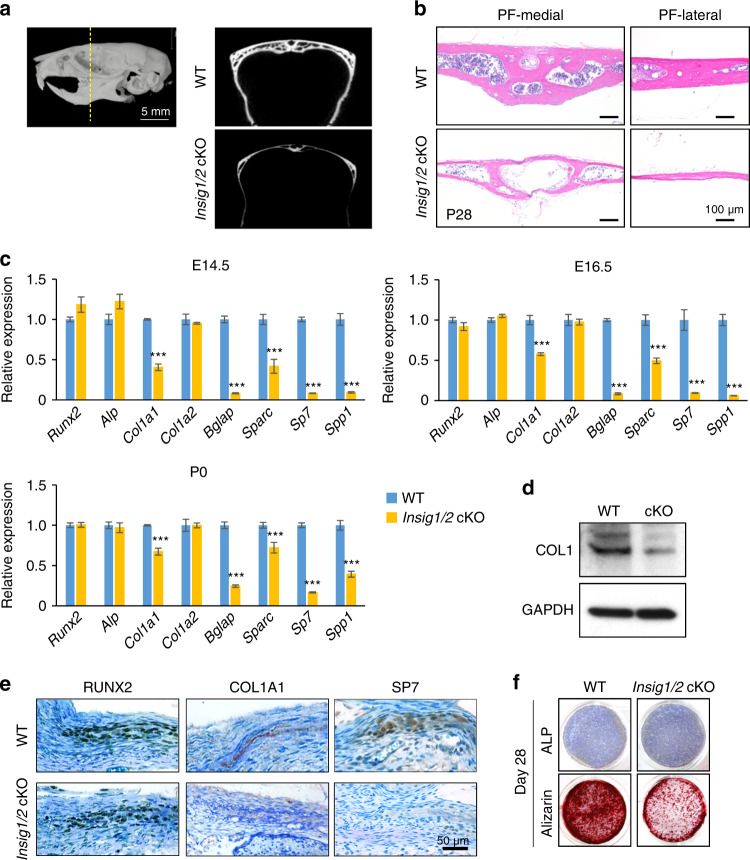
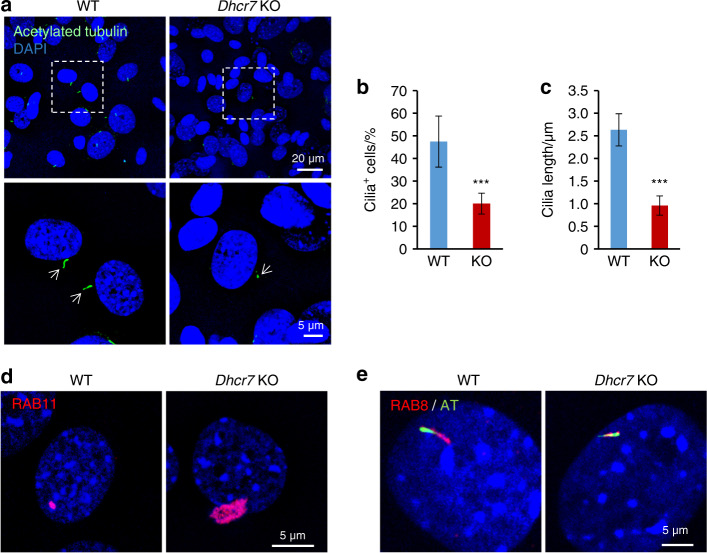
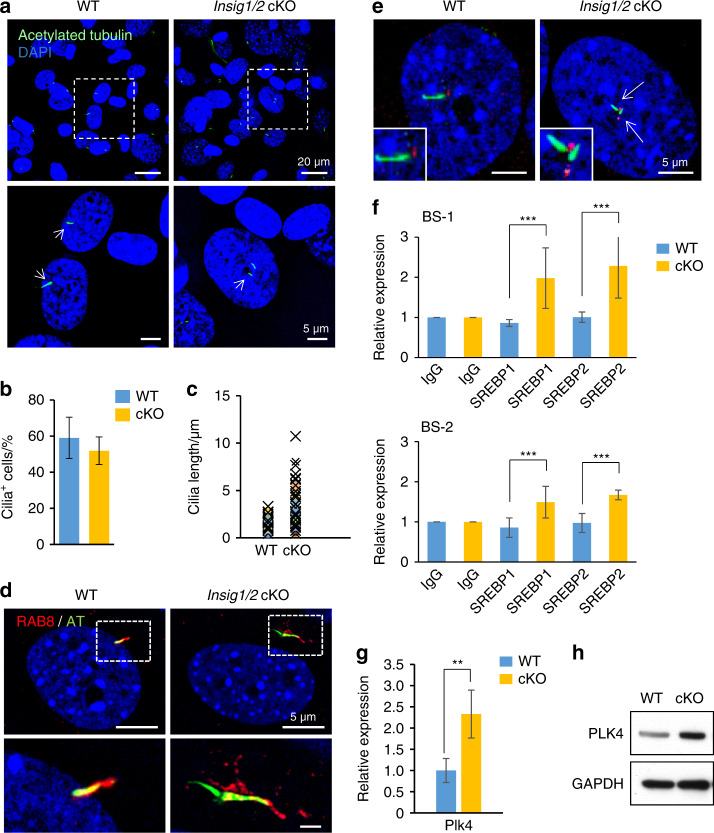
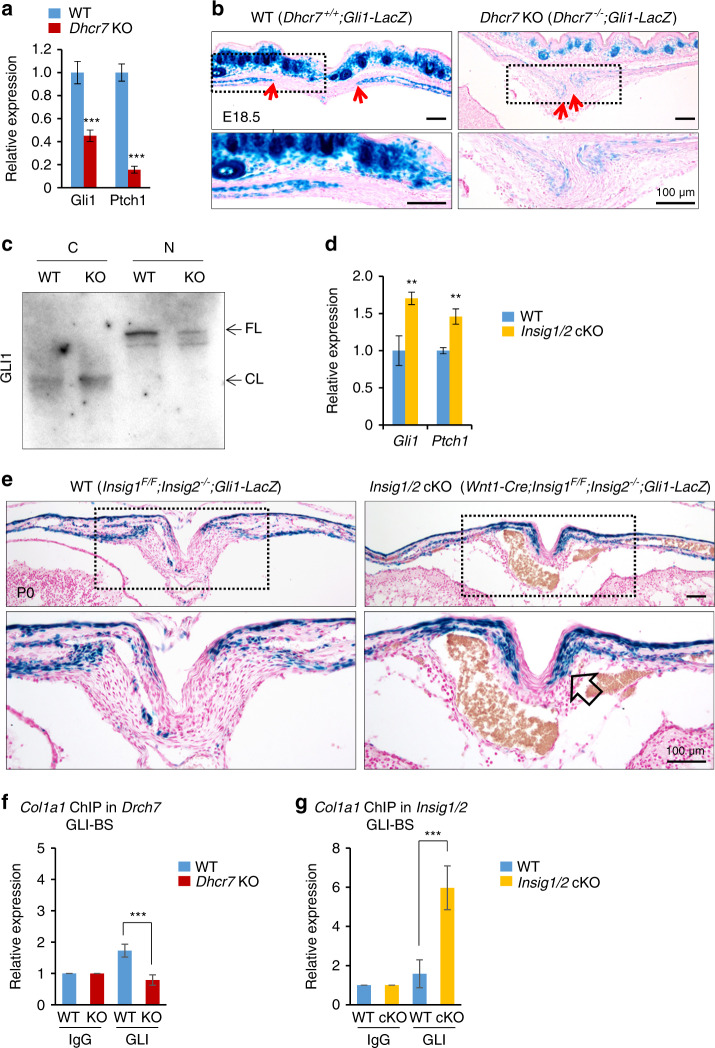
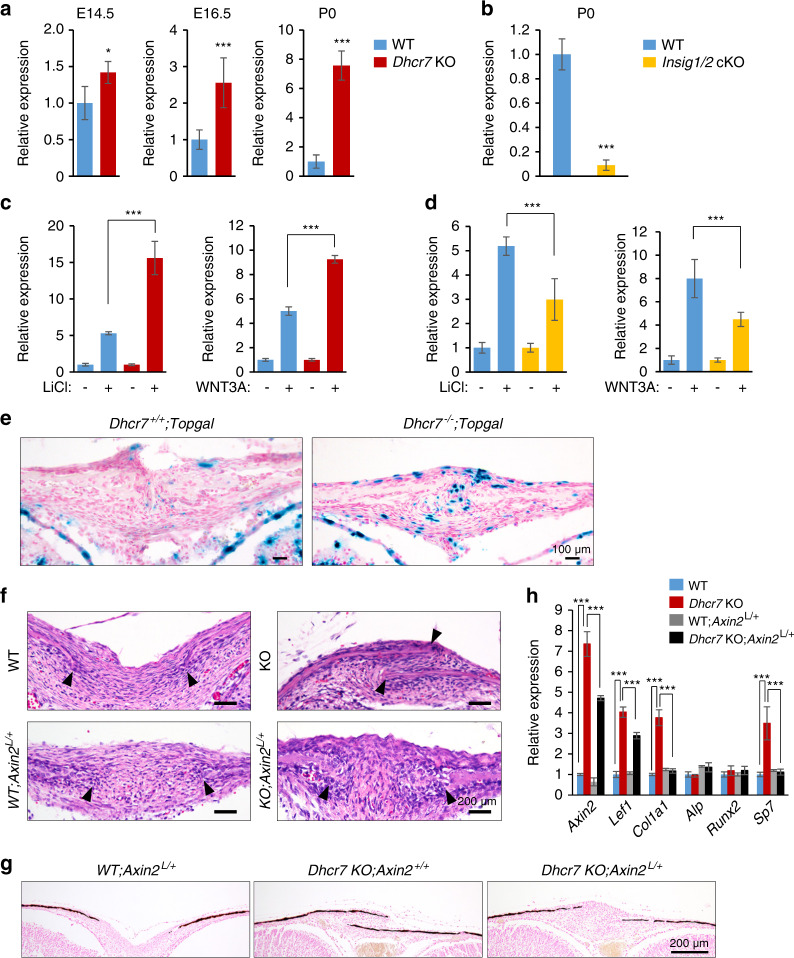
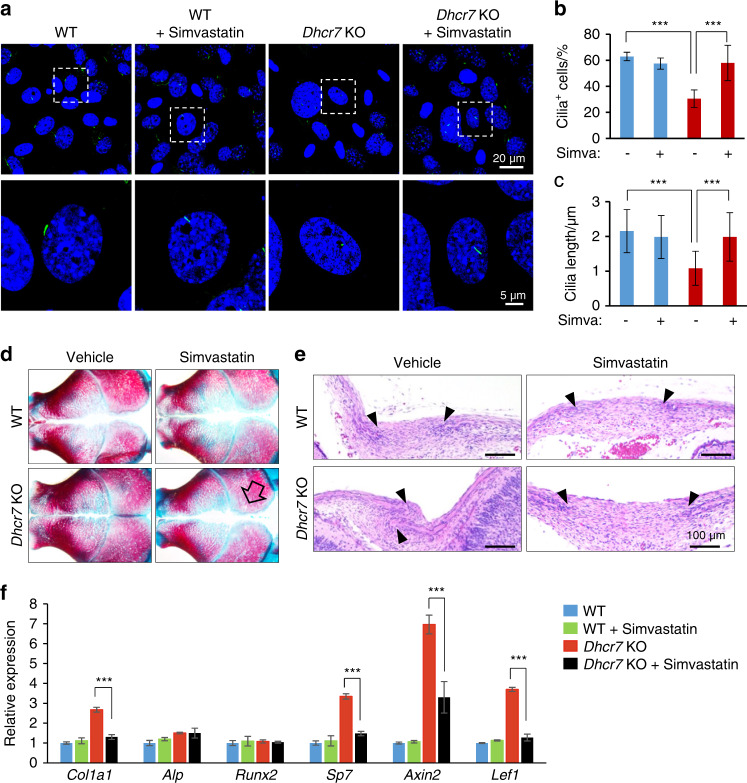
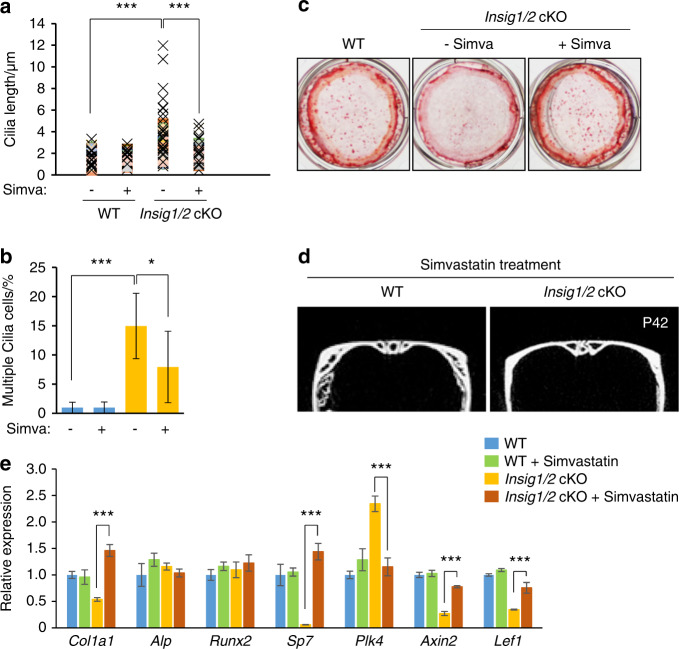
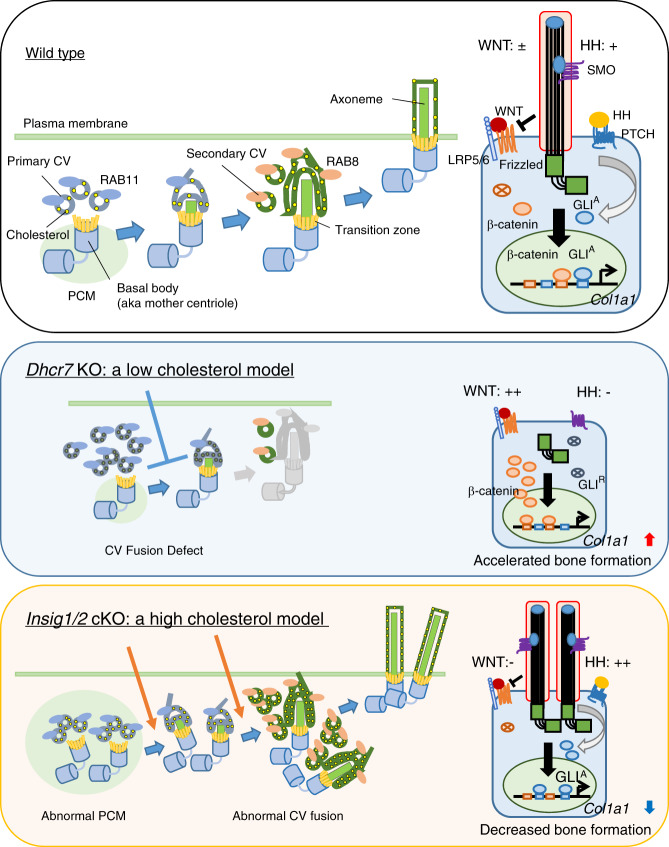
Human linkage studies suggest that craniofacial deformities result from either genetic mutations related to cholesterol metabolism or high-cholesterol maternal diets. However, little is known about the precise roles of intracellular cholesterol metabolism in the development of craniofacial bones, the majority of which are formed through intramembranous ossification. Here, we show that an altered cholesterol metabolic status results in abnormal osteogenesis through dysregulation of primary cilium formation during bone formation. We found that cholesterol metabolic aberrations, induced through disruption of either Dhcr7 (which encodes an enzyme involved in cholesterol synthesis) or Insig1 and Insig2 (which provide a negative feedback mechanism for cholesterol biosynthesis), result in osteoblast differentiation abnormalities. Notably, the primary cilia responsible for sensing extracellular cues were altered in number and length through dysregulated ciliary vesicle fusion in Dhcr7 and Insig1/2 mutant osteoblasts. As a consequence, WNT/β-catenin and hedgehog signaling activities were altered through dysregulated primary cilium formation. Strikingly, the normalization of defective cholesterol metabolism by simvastatin, a drug used in the treatment of cholesterol metabolic aberrations, rescued the abnormalities in both ciliogenesis and osteogenesis in vitro and in vivo. Thus, our results indicate that proper intracellular cholesterol status is crucial for primary cilium formation during skull formation and homeostasis.

Keywords: Bone; Homeostasis.


Conflict of interest statement

Competing interestsThe authors declare no competing interests.

Figures

Fig. 1
Fig. 1
Loss of Dhcr7 accelerates osteogenesis. a MicroCT images of the calvaria—top view (upper panels) and side view (lower panels)—of newborn wild-type (WT) control and Dhcr7−/− knockout (KO) mice. Red arrows indicate early closure of the metopic, coronal, and sagittal sutures. Yellow dotted lines in the lower panels indicate the tips of premaxillae. b Skeletal staining of skulls from newborn WT control and KO mice. Yellow boxed areas are enlarged in the lower images. Black arrows in KO images indicate overlapping of frontal and parietal bones at the coronal suture and left and right parietal bones at the sagittal suture. c Hematoxylin and Eosin (H&E) staining of the sagittal sutures of newborn WT and KO mice. Arrows indicate the osteogenic front. Scale bar, 50 µm. d von Kossa staining of the sagittal sutures of newborn WT and KO mice. Arrows indicate the osteogenic front. Scale bar, 100 µm. e Immunoblotting for type I collagen (COL1) in P0 calvaria of WT and KO mice. GADPH was used as loading control. f Quantitative RT-PCR of the indicated osteogenic genes at E14.5 (left) and E16.5 (right) in WT (blue bars) and KO (red bars) mice. n = 6 per genotype per stage. **P < 0.01; ***P < 0.001. g Immunohistochemistry analysis for RUNX2, COL1A1 and SP7 (Osterix) in newborn WT and KO mice. Nuclei were counterstained with 0.04% methylene blue. Scale bar, 50 µm. h Alkaline phosphatase (left) and Alizarin Red (right) staining of osteoblasts isolated from newborn WT and KO calvaria after induction of osteogenic differentiation at Day 0, 7, and 14.
Fig. 2
Fig. 2
Excessive cholesterol synthesis decreased bone formation in Insig1/2 cKO mice. a MicroCT images of the frontal bones (a slice at the level of the distal end of the 3rd molar, indicated by the yellow dotted line) of WT and Insig1/2 conditional KO (cKO) mice at P35. b H&E staining of the medial and lateral regions of the posterior frontal bones (PF) from P28 WT and Insig1/2 cKO mice. Scale bars, 100 µm. c Quantitative RT-PCR for the indicated osteogenic genes in WT (blue bars) and Insig1/2 cKO (yellow bars) mice at E14.5, E16.5, and P0. n = 6 per genotype per stage. ***P < 0.001. d Immunoblotting for COL1 in newborn WT and Insig1/2 cKO mice. GADPH was used as loading control. e Immunohistochemical analysis for RUNX2, COL1A1 and SP7 (Osterix) in newborn WT and Insig1/2 cKO mice. Nuclei were counterstained with 0.04% methylene blue. Scale bar, 50 µm. f Alkaline phosphatase (top) and Alizarin Red (bottom) staining of osteoblasts isolated from the frontal bones of newborn WT and Insig1/2 cKO after induction of osteogenic differentiation at Day 28.
Fig. 3
Fig. 3
Impaired cholesterol synthesis results in defective ciliogenesis in Dhcr7 KO osteoblasts. a Immunocytochemistry (IC) analyses of primary cilia in osteoblasts from wild-type (WT) control and Dhcr7 knockout (KO) mice. Primary cilia were stained with anti-acetylated tubulin antibody (green), and nuclei were stained with DAPI (blue). Boxed areas in upper images are enlarged, and arrows indicate primary cilia. Scale bars: 20 µm in the upper images and 5 µm in the lower images. Arrows indicate primary cilia. b Percentage of cells with primary cilia in osteoblasts from WT (blue bar) and Dhcr7 KO (red bar) mice. More than 200 cells were randomly analyzed in three independent experiments. ***P < 0.001. c Quantification of the length of primary cilia in osteoblasts from WT (blue bar) and Dhcr7 KO (red bar) mice. More than 200 cells were randomly analyzed in three independent experiments. ***P < 0.001. d IC analyses for RAB11 (red) in WT and Dhcr7 KO osteoblasts. Nuclei were stained with DAPI (blue). Scale bar, 5 µm. e IC analyses for RAB8 (red) and acetylated tubulin (AT; green) in WT and Dhcr7 KO osteoblasts. Nuclei were stained with DAPI (blue). Scale bar, 5 µm.
Fig. 4
Fig. 4
Excessive cholesterol synthesis results in abnormal primary cilium formation. a IC analyses for anti-acetylated tubulin (AT; green) in WT and Insig1/2 conditional KO (cKO) osteoblasts. Nuclei were stained with DAPI (blue). Boxed areas in upper images are enlarged, and arrows indicate primary cilia. Scale bars: 20 µm in the upper images and 5 µm in the lower images. b Percentage of cells with primary cilia in osteoblasts from WT (blue bar) and Insig1/2 cKO (yellow bar) osteoblasts. More than 200 cells were randomly analyzed in three independent experiments. c Quantification of the length of primary cilia in osteoblasts from WT (left) and Insig1/2 cKO (right) mice. More than 200 cells were randomly analyzed in three independent experiments. ***P < 0.001. d IC for RAB8 (red) and AT (green) in WT and Insig1/2 cKO osteoblasts. Nuclei were stained with DAPI (blue). Boxed areas in upper images are enlarged. Scale bars, 5 µm. e IC analyses for γ-tubulin (red) and AT (green) in WT and Insig1/2 cKO osteoblasts. Nuclei were stained with DAPI (blue). Arrows indicate duplicated primary cilia and basal bodies. Primary cilia are enlarged in insets. Scale bars, 5 µm. f ChIP assays of IgG control and SREBP1 or SREBP2 for SRE (BS1 and BS2) of the Plk4 promoter region in WT control (blue bars) and Insig1/2 cKO (yellow bars) osteoblasts. n = 3 per group. ***P < 0.001. g Quantitative RT-PCR for Plk4 in WT (blue bar) and Insig1/2 cKO (yellow bar) osteoblasts. n = 6 per group. **P < 0.01. h Immunoblotting for PLK4 in WT and Insig1/2 cKO osteoblasts. GAPDH was used as loading control.
Fig. 5
Fig. 5
Altered hedgehog signaling in calvaria from Dhcr7 and Insig1/2 mutant mice during craniofacial development. a Quantitative RT-PCR analyses for Gli1 and Ptch1 expression as a readout for HH signaling activity in newborn wild-type (WT) control (blue bars) and Dhcr7 knockout (KO; red bars) calvaria. n = 6 per group. ***P < 0.001. b β-galactosidase staining (blue) for sites of HH signaling activation in the frontal bones of E18.5 Dhcr7+/+;Gli1-LacZ (WT) and Dhcr7−/−;Gli1-LacZ (Dhcr7 KO) mice. Red arrows indicate osteogenic fronts; boxed areas are enlarged in lower images. Nuclei were stained with nuclear fast red. Scale bars, 100 µm. c Cell fractionation and subsequent immunoblotting analysis for GLI1, using cytosol (C) and nuclear (N) fractions from WT control and Dhcr7 KO osteoblasts. FL, full-length; CL, cleaved. d Quantitative RT-PCR analysis for Gli1 and Ptch1 in newborn WT control (blue bars) and Insig1/2 conditional KO (cKO; yellow bars) frontal bones. n = 6 per group. **P < 0.01. e β-galactosidase staining (blue) for sites of HH signaling activation in the frontal bones of P0 Insig1F/F;Insig2−/−;Gli1-LacZ (WT) and Wnt1-Cre;Insig1F/F;Insig2−/−;Gli1-LacZ (Insig1/2 cKO) mice. Open arrow indicates increased Gli1-LacZ; boxed areas are enlarged in lower images. Nuclei were stained with nuclear fast red. Scale bars, 100 µm. f ChIP assays of IgG control and GLI-1 for the Col1a1 promoter region in Dhcr7 KO (red bars) and WT control (blue bars) osteoblasts. n = 3 per group. ***P < 0.001. g ChIP assays of IgG control and GLI-1 for the Col1a1 promoter region in Insig1/2 cKO (yellow bars) and WT control (blue bars) osteoblasts. n = 3 per group. ***P < 0.001.
Fig. 6
Fig. 6
Altered WNT/β-catenin signaling in calvaria from Dhcr7 and Insig1/2 mutant mice during craniofacial development. a Quantitative RT-PCR for Axin2 in calvaria from wild-type (WT; blue bars) control and Dhcr7 knockout (KO; red bars) mice at E14.5, E16.5, and P0 (newborn). n = 6 per group. *P < 0.05; ***p < 0.001. b Quantitative RT-PCR for Axin2 in calvaria from newborn WT (blue bar) and Insig1/2 conditional KO (cKO; yellow bar) mice. n = 6 per group. ***P < 0.001. c Quantitative RT-PCR for Axin2 after treatment with LiCl (left panel) or WNT3A (right panel) in WT (blue bars) and Dhcr7 KO (red bars) osteoblasts. n = 6 per group. ***P< 0.001. d Quantitative RT-PCR for Axin2 after treatment with LiCl (left panel) or WNT3A (right panel) in WT (blue bars) and Insig1/2 cKO (yellow bars) osteoblasts. n = 6 per group. ***P < 0.001. e β-galactosidase staining (blue) for sites of WNT/β-catenin signaling activation in the frontal bones of P0 Dhcr7+/+;Topgal and Dhcr7−/−;Topgal mice. Nuclei were stained with nuclear fast red. Scale bars, 100 µm. f Hematoxylin and Eosin staining of the sagittal sutures of newborn WT, WT;Axin2L/+, Dhcr7 KO and Dhcr7 KO;Axin2L/+ mice. Arrowheads indicate the osteogenic front. Accelerated bone formation of the sutures (frontal, coronal, and sagittal sutures) was normalized in newborn Dhcr7 KO;Axin2L/+ mice (n = 6/6). Scale bars, 100 µm. g Von Kossa staining of the sagittal sutures of newborn WT;Axin2L/+, Dhcr7 KO and Dhcr7 KO;Axin2L/+ mice. Scale bar, 200 µm. h Quantitative RT-PCR of the indicated genes in newborn WT (blue bars), Dhcr7 KO (red bars), WT;Axin2L/+ (gray bars) and Dhcr7KO;Axin2L/+ (black bars) mice. n = 6 per group. ***P < 0.001.
Fig. 7
Fig. 7
Simvastatin rescues altered bone formation in Dhcr7 mutant mice. a Immunocytochemistry (IC) analyses of primary cilia in osteoblasts from wild-type (WT) control and Dhcr7 knockout (KO) mice after simvastatin treatment. Primary cilia were stained with anti-acetylated tubulin antibody (green), and nuclei were stained with DAPI (blue). Boxed areas in upper images are enlarged. Scale bars, 20 µm in the upper images and 5 µm in the lower images. b Percentage of cells with primary cilia in osteoblasts from WT (blue bars) and Dhcr7 KO (red bars) mice after treatment with simvastatin. n = 124 per group. ***P < 0.001. c Quantification of the length of primary cilia in osteoblasts from WT (blue bars) and Dhcr7 (red bars) KO mice after simvastatin treatment. n = 124 per group. ***P < 0.001. d Skull staining after simvastatin treatment (10 mg·kg−1 body weight, intraperitoneal injection to a pregnant mouse, E12.5‒E18.5). The open arrow indicates rescued calvarial abnormalities. e Hematoxylin and Eosin staining of the sagittal sutures of newborn WT and Dhcr7 KO mice after simvastatin treatment. Arrowheads indicate the osteogenic front. Accelerated bone formation of the sutures (frontal, coronal, and sagittal sutures) was normalized in newborn Dhcr7 KO mice (n = 6/6). Scale bars, 100 µm. f Quantitative RT-PCR of the indicated genes in newborn WT (blue bars), WT treated with simvastatin (green bars), Dhcr7 KO (red bars), and Dhcr7 KO treated with simvastatin (black bars) mice. n = 6 per group. ***P < 0.001.
Fig. 8
Fig. 8
Simvastatin rescues altered bone formation in Insig1/2 mutant mice. a Quantification of ciliary length in WT and Insig1/2 cKO osteoblasts with/without simvastatin treatment (Simva). n = 124 per group. ***P < 0.001. b Quantification of cells with multiple cilia with/without simvastatin treatment (Simva) in WT (blue bars) and Insig1/2 cKO (yellow bars). n = 124 per group. *P < 0.05; ***p < 0.001. c Alizarin Red staining of osteoblasts isolated from newborn WT and Insig1/2 cKO frontal bones after induction of osteogenic differentiation with/without simvastatin treatment at Day 28. d MicroCT images from WT and Insig1/2 cKO mice after simvastatin treatment (10 mg·kg−1 body weight from P7 to P42). e Quantitative RT-PCR of the indicated genes in P42 WT (blue bars), WT treated with simvastatin (green bars), Insig1/2 cKO (yellow bars), and Insig1/2 cKO treated with simvastatin (brown bars) mice. n = 6 per group. ***P < 0.001.
Fig. 9
Fig. 9
Model of primary cilium formation altered in Dhcr7−/− and Insig1/2 mutant osteoblasts. Ciliogenesis starts with the interaction of the basal body (aka mother centriole) with primary ciliary vesicles (CVs), which can be labeled with RAB11, and then the axoneme grows within the ciliary membrane while fusing with secondary CVs, which can be labeled with RAB8. Eventually the elongated primary cilium fuses with the plasma membrane, allowing the distal part of the cilium to interact with the extracellular milieu. In Dhcr7 knockout (KO) osteoblasts, primary cilia were fewer and shorter than in controls. By contrast, Insig1/2 conditional KO (cKO) osteoblasts showed supernumerary and longer primary cilia compared to controls. Primary CVs labeled with RAB11 accumulated in the cells, and secondary CVs labeled with RAB8 failed to gather at cilium formation sites in Dhcr7 KO osteoblasts. Secondary CVs stained with RAB8 accumulated in Insig1/2 cKO osteoblasts, and the number of basal bodies was abnormally increased in Insig1/2 cKO osteoblasts. During osteogenesis, WT osteoblasts have a single primary cilium that suppresses WNT/β-catenin signaling and activates HH signaling, which induces Col1a1 expression. In Dhcr7 KO osteoblasts, WNT/β-catenin signaling is hyper-activated (WNT: + + ) and HH signaling is compromised (HH: –), while in Insig1/2 cKO osteoblasts WNT/β-catenin signaling is inhibited (WNT: −) and HH signaling is hyper-activated (HH: + + ).

Similar articles

Cited by

References

    1. Porter FD, Herman GE. Malformation syndromes caused by disorders of cholesterol synthesis. J. Lipid Res. 2011;52:6–34. - PMC - PubMed
    1. Iwata J, et al. Modulation of lipid metabolic defects rescues cleft palate in Tgfbr2 mutant mice. Hum. Mol. Genet. 2014;23:182–193. - PMC - PubMed
    1. Engelking LJ, et al. Severe facial clefting in Insig-deficient mouse embryos caused by sterol accumulation and reversed by lovastatin. J. Clin. Invest. 2006;116:2356–2365. - PMC - PubMed
    1. Rossi M, et al. Clinical phenotype of lathosterolosis. Am. J. Med. Genet. A. 2007;143A:2371–2381. - PubMed
    1. Porter FD. Smith-Lemli-Opitz syndrome: pathogenesis, diagnosis and management. Eur. J. Hum. Genet. 2008;16:535–541. - PubMed