. 2020 Jan 8;6(2):eaax5849.
doi: 10.1126/sciadv.aax5849. eCollection 2020 Jan.

Epidermal autonomous VEGFA/Flt1/Nrp1 functions mediate psoriasis-like disease

Affiliations

Epidermal autonomous VEGFA/Flt1/Nrp1 functions mediate psoriasis-like disease

Farida Benhadou et al. Sci Adv. .

Abstract

Psoriasis is a common chronic skin disorder characterized by keratinocyte hyperproliferation with altered differentiation accompanied by inflammation and increased angiogenesis. It remains unclear whether the first events that initiate psoriasis development occur in keratinocytes or inflammatory cells. Here, using different psoriasis mouse models, we showed that conditional deletion of Flt1 or Nrp1 in epidermal cells inhibited psoriasis mediated by Vegfa overexpression or c-Jun/JunB deletion. Administration of anti-Nrp1 antibody reverted the psoriasis phenotype. Using transcriptional and chromatin profiling of epidermal cells following Vegfa overexpression together with Flt1 or Nrp1 deletion, we identified the gene regulatory network regulated by Vegfa/Nrp1/Flt1 during psoriasis development and uncovered a key role of Fosl1 in regulating the chromatin remodeling mediated by Vegfa overexpression in keratinocytes. In conclusion, our study identifies an epidermal autonomous function of Vegfa/Nrp1/Flt1 that mediates psoriatic-like disease and demonstrates the clinical relevance of blocking Vegfa/Nrp1/Flt1 axis in psoriasis.


Figures

Fig. 1
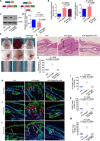
Fig. 1. Flt1 expression by keratinocytes is essential for Vegfa-induced psoriasis.
(A) Strategy to constitutively activate Vegfa and inhibit Flt1. (B) Vegfa and Flt1 mRNA expression by qRT-PCR on FACS-isolated keratinocytes (n = 3) (means ± SEM, Mann-Whitney). (C) Flt1 expression assessed by Western blot on FACS-isolated basal keratinocytes. (D) Flt1 protein expression (n = 3) (means ± SEM, Mann-Whitney). (E) Naso-oral region, ear, and tail. (F) Hematoxylin and eosin (H&E) on tail skin. Scale bars, 50 μm. (G) Epidermal tail thickness measured microscopically (n = 10) (means ± SEM, Student’s t test). (H) K14/EdU staining. Scale bars, 50 μm. (I) Percentage of EdU-positive basal cells (BCs) in interfollicular epidermis (IFE) [n = 398 (Ctrl), n = 436 (K14-Vegfa), n = 422 (K14-Vegfa/Flt1 cKO) total BCs, n = 10 mice] (mean ± SEM, Student’s t test). (J) K14/CD45 staining. Scale bars, 50 μm. (K) Density of CD45-positive cells in dermal IFE area (represents the dermal area just beneath the IFE) of 300,565 μm2 (Ctrl), 289,678 μm2 (K14-Vegfa), and 278,767 μm2 (K14-Vegfa/Flt1 cKO); n = 10 mice. Number of CD45-positive cells per 10,000 μm2 (means ± SEM, Student’s t test). (L) K14/CD31 staining. Scale bars, 50 μm. (M) Number of CD31-positive cells (microvascular density) calculated in dermal IFE area of 324,567 μm2 (Ctrl), 345,234 μm2 (K14-Vegfa), and 342,356 μm2 (K14-Vegfa/Flt1 cKO); n = 10 mice. Number of CD31-positive cells per 10,000 μm2 (means ± SEM, Student’s t test). Photo credit: Benhadou Farida, Laboratory of Stem Cells and Cancer.
Fig. 2
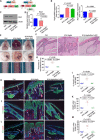
Fig. 2. Cell autonomous function of Nrp1 in the epidermis is critical for Vegfa-induced psoriasis.
(A) Strategy to constitutively activate Vegfa and delete Nrp1 expression in epidermis. (B) Vegfa and Nrp1 mRNA expression by qRT-PCR on FACS-isolated keratinocytes (n = 3) (means ± SEM, Mann-Whitney test). (C) Nrp1 expression assessed by Western blot performed on FACS-isolated basal keratinocytes. (D) Nrp1 protein expression (n = 3) (means ± SEM, Mann-Whitney test). (E) Naso-oral region, ear, and tail. (F) H&E on tail skin. Scale bars, 50 μm. (G) Epidermal tail thickness measured microscopically (n = 10) (mean ± SEM, Student’s t test). (H) K14/EdU staining. Scale bars, 50 μm. (I) Percentage of EdU-positive BCs [n = 507 (Ctrl), n = 487 (K14-Vegfa), n = 490 (K14-Vegfa/Nrp1 cKO) total BCs; n = 10 mice] (means ± SEM, Student’s t test). (J) K14/CD45 staining. Scale bars, 50 μm. (K) Density of CD45-positive cells in the dermal IFE area of 344,965 μm2 (Ctrl), 449,687 μm2 (K14-Vegfa), and 423,876 μm2 (K14-Vegfa/Nrp1 cKO); n = 10 mice. CD45-positive cells per 10,000 μm2 (means ± SEM, Student’s t test). (L) K14/CD31 staining. Scale bars, 50 μm. (M) Number of CD31-positive cells calculated in a dermal IFE area of 409,560 μm2 (Ctrl), 432,890 μm2 (K14-Vegfa), and 428,532 μm2 (K14-Vegfa/Nrp1 cKO); n = 10 mice. Number of CD31-positive cells per 10000 μm2 (means ± SEM, Student’s t test). Photo credit: Benhadou Farida, Laboratory of Stem Cells and Cancer.
Fig. 3
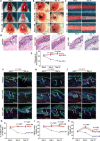
Fig. 3. Function-blocking anti-Nrp1 antibodies improve Vegfa-induced psoriasis.
(A to C) Naso-oral region, ear, and tail, (D) H&E on tail skin. Scale bars, 50 μm. (E) Measures of epidermal thickness (n = 3) (means ± SEM, Mann-Whitney). (F) K14/EdU staining. Scale bars, 50 μm. (G) Percentage of EdU-positive BCs [n = 387 (isotype, day 0), n = 354 (isotype, day 15), n = 424 (Nrp1b AB, day 0), n = 409 (Nrp1b AB, day 15), n = 391 (Nrp1a AB, day 0), n = 421 (Nrp1a AB, day 15) total BCs, n = 3] (means ± SEM, Mann-Whitney). (H) K14/CD45 staining. Scale bars, 50 μm. (I) Density of CD45-positive cells in the dermal IFE area of 254,342 μm2 (isotype, day 0), 298,567 μm2 (isotype, day 15), 267,890 μm2 (Nrp1b AB, day 0), 287,908 μm2 (Nrp1b AB, day 15), 257,560 μm2 (Nrp1a AB, day 0), 294,901 μm2 (Nrp1a AB, day 15); n = 10. Number of CD45-positive cells per 10,000 μm2 (means ± SEM, Mann-Whitney). (J) K14/CD31 staining. Scale bar, 50 μm. (K) Microvascular density in dermal IFE area of 267,980 μm2 (isotype, day 0), 234,589 μm2 (isotype, day 15), 222,370 μm2 (Nrp1b AB, day 0), 223,456 μm2 (Nrp1b AB, day 15), 200,154 μm2 (Nrp1a AB, day 0), and 212,980 μm2 (Nrp1a AB at day 15). Number of CD31-positive cells per 10,000 μm2 (means ± SEM, Mann-Whitney). Photo credit: Benhadou Farida, Laboratory of Stem Cells and Cancer.
Fig. 4
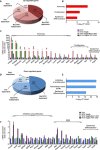
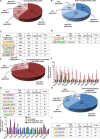
Fig. 4. Transcriptional landscape associated with Nrp1/Flt1/Vegfa signaling in psoriasis.
(A) Pie chart showing the percentage of total up-regulated genes in K14-Vegfa and depending either on common Nrp1/Flt1 (=Nrp1/Flt1 dependent) or specifically on Nrp1 (=Nrp1 dependent) or Flt1 (Flt1 dependent) expression. Genes with unchanged expression after Nrp1or Flt1 epidermal ablation were also represented (=Nrp1/Flt1-independent up genes). (B) GO analysis of up-regulated genes in Vegfa overexpression in an Nrp1- and Flt1-dependent manner. (C) mRNA relative expression of up-regulated genes by RNA-seq in Vegfa overexpression in FACS-isolated basal keratinocytes (n = 2) (means ± SEM). (D) Pie chart showing the percentage of total down-regulated genes in K14-Vegfa and depending either on common Nrp1/Flt1 expression (=Nrp1/Flt1 dependent) or specifically on Nrp1 (=Nrp1 dependent) or Flt1 (Flt1 dependent) expression. Genes with unchanged expression after Nrp1 or Flt1 epidermal ablation were also represented (=Nrp1/Flt1-independent down genes). (E) GO analysis of down-regulated genes in Vegfa overexpression in an Nrp1- and Flt1-dependent manner. (F) mRNA relative expression of down-regulated genes by RNA-seq in Vegfa-overexpressing mice and depending on Nrp1 or Flt1 expression in FACS-isolated keratinocytes (n = 2) (means ± SEM).
Fig. 5
Fig. 5. Chromatin landscape associated with Nrp1/Flt1/Vegfa signaling in psoriasis.
(A) Percentage of total up-regulated peaks in K14-Vegfa and depending either on Nrp1/Flt1 (=Nrp1/Flt1 dependent) or specifically on Nrp1 (=Nrp1 dependent) or Flt1 (Flt1 dependent) or independent of Nrp1 or Flt1 expression (=Nrp1/Flt1 independent). (B) Percentage of down-regulated peaks and their distribution in the different categories. (C) Enriched TF motifs found in the peaks that were up- or down-regulated (D) in an Nrp1/Flt1-dependent manner. P value of enrichment of the motif in peaks compared with background and percentage of peaks containing the motif. (E) Percentage of total up-regulated peaks in K14-Vegfa overlapping with up-regulated genes and depending either on Nrp1/Flt1 expression (=Nrp1/Flt1 dependent) or specifically on Nrp1 (=Nrp1 dependent) or Flt1 (Flt1 dependent) or independent of Nrp1 or Flt1 expression (=Flt1/Nrp1 independent). (F) mRNA expression of up-regulated genes by RNA-seq in FACS-isolated basal keratinocytes (n = 2) (means ± SEM). (G) Enriched transcription TF motifs in the peaks up-regulated in an Nrp1/Flt1-dependent manner. (H) Percentage of total down-regulated genes and their distribution in the different categories. (I) mRNA expression of down-regulated genes by RNA-seq in FACS-isolated basal keratinocytes (n = 2) (means ± SEM). (J) Enriched TF motifs in the peaks down-regulated in an Nrp1/Flt1-dependent manner.
Fig. 6
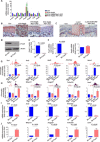
Fig. 6. Fosl1 acts downstream of Vegfa/Flt1 signaling in the regulation of chromatin remodeling and transcriptional change associated with psoriasis.
(A) mRNA expression of AP-1 members by RNA-seq in FACS-isolated basal keratinocytes (n = 2) (means ± SEM). (B) IHC (immunohistochemistry) of Fosl1 nuclear staining in tail epidermis. Scale bars, 10 μm. (C) IHC of Folsl1 in ear epidermis. Scale bars, 10 μm. (D) Fosl1 expression assessed by Western blot on primary cultured keratinocytes from K14-Vegfa after transduction with control (sh Ctrl) or Fosl1-specific shRNA (sh Fosl1).(E) Protein expression of Fosl1 (n = 3). Histogram represents means ± SEM. (F) Vegfa and Fosl1 mRNA expression measured par qRT-PCR on primary cultured keratinocytes from K14-Vegfa transduced with sh Ctrl or sh Fols1 (n = 3) (means ± SEM, Mann-Whitney). (G) Relative chromatin accessibility measured by ATAC qPCR of chromatin regions presenting AP-1 binding sites in the regulatory regions of up- or down-regulated genes (H) in primary cultured keratinocytes from K14-Vegfa transduced with sh Ctrl or sh Fosl1 (n = 3). Primers were designed around the control region (c) and peak region (p) (means ± SEM, Mann-Whitney). (I) mRNA expression by qRT-PCR of up- or down-regulated genes (J) presenting AP-1 binding sites in their regulatory regions in primary cultured keratinocytes from K14-Vegfa transduced with sh Ctrl or sh Fosl1 (n = 3) (means ± SEM, Mann-Whitney test).

Similar articles

Cited by

References

    1. Langley R. G., Krueger G. G., Griffiths C. E., Psoriasis: Epidemiology, clinical features, and quality of life. Ann Rheum Dis 64 Suppl. 2, ii18–ii23 (2005). - PMC - PubMed
    1. Lowes M. A., Suarez-Farinas M., Krueger J. G., Immunology of psoriasis. Annu. Rev. Immunol. 32, 227–255 (2014). - PMC - PubMed
    1. Canavese M., Altruda F., Ruzicka T., Schauber J., Vascular endothelial growth factor (VEGF) in the pathogenesis of psoriasis—A possible target for novel therapies? J. Dermatol. Sci. 58, 171–176 (2010). - PubMed
    1. Wang Z., Liang W., Zhang B., Lv M., Wang J., Zhang L., Single nucleotide polymorphisms of VEGF gene and psoriasis risk. J. Dermatol. Sci. 49, 263–265 (2008). - PubMed
    1. Datta-Mitra A., Riar N. K., Raychaudhuri S. P., Remission of psoriasis and psoriatic arthritis during bevacizumab therapy for renal cell cancer. Indian J. Dermatol. 59, 632 (2014). - PMC - PubMed

Publication types

MeSH terms