. 2020 Jan 8;6(2):eaax6232.
doi: 10.1126/sciadv.aax6232. eCollection 2020 Jan.

Disordered chromatin packing regulates phenotypic plasticity

Affiliations

Disordered chromatin packing regulates phenotypic plasticity

Ranya K A Virk et al. Sci Adv. .

Abstract

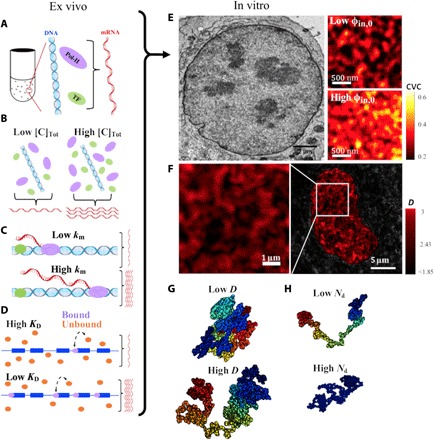
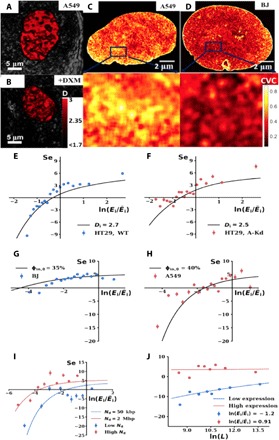
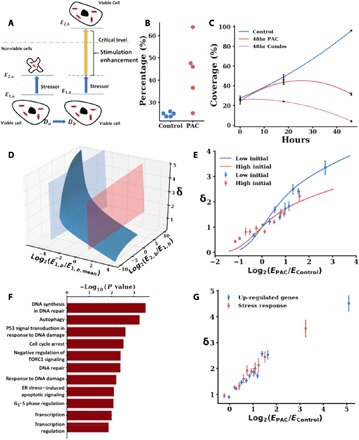
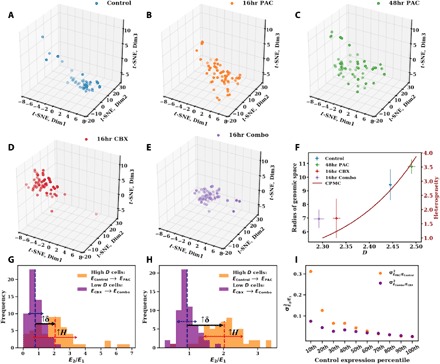
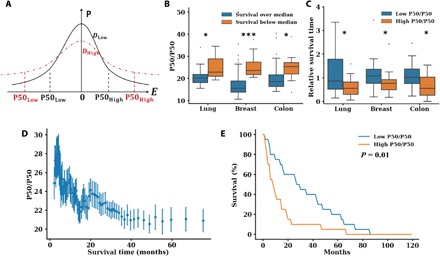
Three-dimensional supranucleosomal chromatin packing plays a profound role in modulating gene expression by regulating transcription reactions through mechanisms such as gene accessibility, binding affinities, and molecular diffusion. Here, we use a computational model that integrates disordered chromatin packing (CP) with local macromolecular crowding (MC) to study how physical factors, including chromatin density, the scaling of chromatin packing, and the size of chromatin packing domains, influence gene expression. We computationally and experimentally identify a major role of these physical factors, specifically chromatin packing scaling, in regulating phenotypic plasticity, determining responsiveness to external stressors by influencing both intercellular transcriptional malleability and heterogeneity. Applying CPMC model predictions to transcriptional data from cancer patients, we identify an inverse relationship between patient survival and phenotypic plasticity of tumor cells.


Figures

Fig. 1
Fig. 1. The chromatin-packing macromolecular-crowding model integrates molecular and physical regulators of transcription.
The regulators influencing transcription reactions can be generally divided into two categories: molecular regulators (km, KD, and [C]tot) (A to D) and physical regulators (D, φin,0, and Nd) (E to H). (A) The CPMC model describes transcription as a series of diffusion-limited chemical reactions. Ex vivo, expression depends on (B) concentration of transcriptional reactants [C]tot (TFs, green; Pol-II, yellow), (C) RNA polymerase elongation rate (km), and (D) the disassociation rate of Pol-II from the transcription start site (TSS; KD). (E) Left: In addition to the molecular determinants, transcriptional reactions are influenced by the highly dense and complex nuclear environment. The concentration of the main crowder with the nucleus, chromatin, can be measured by chromatin electron microscopy (ChromEM). As an example, ChromEM of a nucleus of an A549 lung adenocarcinoma cell is shown. Right: ChromEM measurements of chromatin volume concentration (CVC) demonstrate that chromatin density varies throughout the nucleus. Chromatin packing domains can be visualized as areas of higher chromatin packing density. Within each packing domain, the average volume fraction of chromatin can range from 15 to 65%. Typical domains are 100 to 200 nm in diameter and may contain, on average, ~400 kb. (F) Representative PWS image of an A549 cell demonstrating the existence of chromatin packing domains as regions of elevated chromatin packing scaling (also referred to as fractal dimension) D, which vary throughout the nucleus. (G) A polymer with a higher D (right) has a more heterogeneous density distribution and a greater accessible surface area compared to a polymer with a lower D (left). (H) Nd is the genomic size (in bps) of a chromatin packing domain and can range from less than 100 kbp to several Mbp. Packing domains are illustrated by color coding, with each color representing a separate domain.
Fig. 2
Fig. 2. Comparison of the CPMC model with experimental measurements of gene expression as a function of physical regulators Di, Nd, and φin,0 and gene length L.
(A and B) Representative live-cell PWS microscopy images of nuclear D scaled between 2.56 and 2.66 for control (A) and 12-hour dexamethasone (DXM)–treated lung adenocarcinoma A549 cells (B). Brighter red corresponds to higher chromatin packing scaling. (C and D) Representative heat maps of CVC values from analysis of ChromEM images of cell nuclei from A549 cells (C) and human fibroblasts BJ (D). Representative magnified regions from each nucleus demonstrate an average CVC of 0.35 in A549 cells compared to 0.30 in BJ cells, which represents the chromatin contribution to the average crowding volume fraction φin,0. (E to J) Comparison between the CPMC model (solid lines) and experimentally measured (points) sensitivity of gene expression to an incremental change in chromatin packing scaling D (Se, y axis) as a function of initial gene expression (x axis). (E) Cells with chromatin with a higher initial Di = 2.7 [wild-type (WT) HT-29 cells] have a bidirectional Se curve that becomes attenuated if Di is lowered to 2.5 (short hairpin RNA knockdown Arid1a HT-29 cells) (F). Each point represents the average of 100 genes. Changes in D were induced by cell treatment with 10% FBS, 100 nM EGF, and 100 nM PMA. The CPMC model was able to explain 86% of the variance of the experimental data for WT HT-29 cells and 51% of the variance for Arid1a HT-29 cells. (G) Se in cells with a lower φin,0 [BJ cells, φin,0 = 35%; each point corresponds to 300 genes; explained variance (EV) = 59%] is attenuated in comparison to that of cells with a higher density (H) (A549 cells; φin,0 = 40%, 100 genes per point, EV = 74%). (I) Genes located within larger packing domains (Nd ~ 2 Mbp, 12 genes per point, EV = 56%) have a lower initial expression but have a larger Se in comparison to genes localized within smaller packing domains (Nd ~ 50 kbp, 12 genes per point, EV = 37%). The change in D was induced in A549 cells by treatment with 100 nM dexamethasone. Nd was approximated on the basis of corresponding TAD size: 2-Mbp TADs for the high Nd group of genes versus 50-kbp TADs for the low Nd genes. TAD size was measured using the Arrowhead function from Juicer Tools used to analyze Hi-C data. (J) Comparison between the CPMC model (solid line) with experimental results (points, 60 genes per point) in HT-29 cells showing the effect of gene length (L, x axis) on Se (y axis). In agreement with the model, shorter, initially underexpressed genes (low expression, blue curve; points, EV = 67%) are disproportionally repressed by an incremental increase in D compared to longer genes (high expression, red curve, points). Error bars represent SE from four biological replicates.
Fig. 3
Fig. 3. The scaling of chromatin packing increases the transcriptional malleability of cancer cells.
(A) In response to a stressor, such as a chemotherapeutic agent (e.g., paclitaxel), cells with a higher level of transcriptional malleability may have the ability to respond faster, which may lead to an increased survival. Cells with higher D (right, Db) have an increased a change in the rate of transcription induced by a stimulus/stressor by a factor δ (yellow arrow) relative to a change in the rate of transcription in a cell with a lower D = Da < Db. If in response to a stressor a cell may increase its probability of remaining viable by upregulating expression of pro-survival genes beyond a given threshold, a higher D cell b would increase the probability of reaching this crucial level of expression compared to cell a. (B and C) The fraction of high D cells in a cell population increases after treatment with paclitaxel (PAC) for 48 hours, suggesting that cells with higher D are more likely to survive exposure to a cytotoxic chemotherapeutic agent. (B) The percentage of cells having D in the top quartile of D values of a control cell population (y axis) increases in cells that survive treatment with paclitaxel for 48 hours. For both conditions, each dot represents the percentage of high D cells for PWS experiments on one cell population for a total number of N = 5 replicates per condition. (C) Combination treatment with celecoxib, which lowers D, and paclitaxel for 48 hours results in an increased elimination of cancer cells compared with untreated controls and cells only treated with paclitaxel. (D) CPMC model predictions of the relative transcriptional malleability coefficient δ for initially underexpressed (blue spline) and overexpressed genes (red spline) for Da = 2.3 and Db = 2.5, a difference in D relevant to experimentally observed differences in celecoxib-treated versus untreated A2780 cells. (E) scRNA-seq on A2780 cells was performed to compare transcriptional profiles of control A2780 cells (high D population) and cells treated with 75 μM of a D-lowering agent celecoxib (low D population) and their response to treatment with 5 nM paclitaxel (stressor) for 16 hours. Initially underexpressed and initially overexpressed genes are defined on the basis of control expression levels. Genes are grouped on the basis of their quantile of log2(EPAC/Econtrol), and the mean and SE of each quantile for initially underexpressed genes (blue dots, 300 genes per data point) and initially overexpressed genes (red dots, 100 genes per data point) are plotted. (F) GO analysis identified biological processes that are most significantly involved in the response to 48-hour paclitaxel treatment. Up-regulated genes were defined as those with at least twofold increase in expression. (G) Chromatin packing scaling–facilitated up-regulation (δ) of the stress response genes identified by the GO analysis (red points, 150 genes per data point) was similar to that for all up-regulated genes (blue points, 650 genes per data point).
Fig. 4
Fig. 4. The scaling of chromatin packing regulates intercellular transcriptional heterogeneity of cancer cells.
(A to E) 3D projections of scRNA-seq data (TPM values of 8275 expressed genes) onto reduced t-SNE space for five conditions: (A) control cells (n = 46), (B) cells treated with 5 nM paclitaxel for 16 hours (16hr PAC; n = 55), (C) 5 nM paclitaxel for 48 hours (48hr PAC; n = 53), (D) 75 μM celecoxib for 16 hours (16hr CBX; n = 62), and (E) combination of 75 μM celecoxib and 5 nM paclitaxel for 16 hours (16hr Combo; n = 59). The size of the cluster indicates the transcriptional heterogeneity within the population of surviving cells for each condition. (F) The radius of genomic space Rc [the radius of clusters from (A) to (E)] increases as a function of the chromatin packing scaling D. D was measured by live-cell PWS at each time point on cells before sequencing. Cells treated with paclitaxel (higher D) have greater transcriptional heterogeneity, especially when compared to cells treated with a nonsteroidal anti-inflammatory agent, celecoxib, which lowers D. Likewise, the CPMC model (red curve, right side, y axis) shows that intercellular transcriptional heterogeneity increases with D. Error bars represent the SE of D calculated from PWS measurements (x axis) and Rc (y axis) for each condition. (G) Relative expression of high D versus low D cells in response to paclitaxel treatment for genes associated with DNA repair pathways, which are up-regulated in 48-hour paclitaxel–treated cells. For each condition (Control, 16hr PAC, 2hr CBX, and 16hr Combo), TPM values of these genes (48 in total) were averaged within each cell. Next, expression of paclitaxel-stimulated cells was normalized by the average of the corresponding unstimulated population. The resulting intercellular distribution of relative expression levels is shown. Dashed lines represent the mean relative expression. Solid red and blue arrows represent the SD of distributions EPAC/EControl and ECBX/ECombo, respectively. For these stress response genes, cells with a higher initial D versus cells with a lower initial D had an increase in transcriptional malleability (↑δ) and a higher intercellular transcriptional heterogeneity (↑ H). (H) Distribution of relative expression of genes, as described in (G), in the lowest percentile (10th percentile) of control expression levels (839 in total). (I) Variance (σ2) of intercellular distribution of relative expression for each percentile of control expression levels. Initially underexpressed genes show an increased effect of chromatin packing scaling on increasing intercellular transcriptional heterogeneity in response to paclitaxel stimulation compared to that of initially overexpressed genes.
Fig. 5
Fig. 5. The relationship between transcriptional divergence (P50/P50) and patient survival in stage III and IV lung, breast, and colon cancers.
(A) From the Se curve predicted by the CPMC model, cells with high D, such as cancer cells, have a wider distribution of gene expression (transcriptional divergence). Quantitatively, this transcriptional divergence can be calculated by measuring the ratio of the expression of the top 50% of genes to that of the bottom 50% of genes (P50/P50). (B to E) Analysis of transcriptional divergence, P50/P50, in the cancer cells of patients with stage III and IV lung cancer (n = 31), breast cancer (n = 168), and colon cancer (n = 60) versus survival from the time of diagnosis based on TCGA dataset for patients <75 years old at the time of diagnosis. (B) P50/P50 was elevated in patients with a survival duration below the median for each cancer type (P = 0.021, P < 0.001, and P = 0.018 for lung, breast, and colon cancers, respectively). (C) The RST (ratio between patient survival time and that predicted by a multidimensional linear regression model based on known prognostic factors such as stage at diagnosis, race, and molecular subtypes of the tumor) is higher for patients with low P50/P50 (P50/P50 below the mean for all patients with a given cancer type). RST < 1 indicates survival shorter than expected based on demographic factors and molecular subtype (all P < 0.05). For all three malignancies, RST < 0.8 in high P50/P50 patients. RST is an independent predictor of survival duration. (D) Pooling all patients with these malignancies, we analyzed survival duration (x axis, in months) versus P50/P50 at the time of diagnosis. There was an inverse relation between P50/P50 and survival duration. Each point is an MWA of 10 patients to account for unreported variables (e.g., comorbidities). (E) The Kaplan-Meier curve measuring patient survival for the three malignancies. Patients with a high P50/P50 (P50/P50 above the mean) have a shorter survival duration (median survival = 8 months) than patients with low P50/P50 (P50/P50 below the mean, median survival = 28 months; P = 0.01).

References

    1. Rathert P., Roth M., Neumann T., Muerdter F., Roe J.-S., Muhar M., Deswal S., Cerny-Reiterer S., Peter B., Jude J., Hoffmann T., Boryń Ł. M., Axelsson E., Schweifer N., Tontsch-Grunt U., Dow L. E., Gianni D., Pearson M., Valent P., Stark A., Kraut N., Vakoc C. R., Zuber J., Transcriptional plasticity promotes primary and acquired resistance to BET inhibition. Nature 525, 543–547 (2015). - PMC - PubMed
    1. Stern S., Dror T., Stolovicki E., Brenner N., Braun E., Genome-wide transcriptional plasticity underlies cellular adaptation to novel challenge. Mol. Syst. Biol. 3, 106 (2007). - PMC - PubMed
    1. Plasschaert L. W., Žilionis R., Choo-Wing R., Savova V., Knehr J., Roma G., Klein A. M., Jaffe A. B., A single-cell atlas of the airway epithelium reveals the CFTR-rich pulmonary ionocyte. Nature 560, 377–381 (2018). - PMC - PubMed
    1. Nguyen Q. H., Pervolarakis N., Blake K., Ma D., Davis R. T., James N., Phung A. T., Willey E., Kumar R., Jabart E., Driver I., Rock J., Goga A., Khan S. A., Lawson D. A., Werb Z., Kessenbrock K., Profiling human breast epithelial cells using single cell RNA sequencing identifies cell diversity. Nat. Commun. 9, 2028 (2018). - PMC - PubMed
    1. Haber A. L., Biton M., Rogel N., Herbst R. H., Shekhar K., Smillie C., Burgin G., Delorey T. M., Howitt M. R., Katz Y., Tirosh I., Beyaz S., Dionne D., Zhang M., Raychowdhury R., Garrett W. S., Rozenblatt-Rosen O., Shi H. N., Yilmaz O., Xavier R. J., Regev A., A single-cell survey of the small intestinal epithelium. Nature 551, 333–339 (2017). - PMC - PubMed

Publication types

LinkOut - more resources