. 2020 Jan 15;31(2):87-100.
doi: 10.1091/mbc.E18-05-0329.

Investigating eukaryotic cells with cryo-ET

Affiliations

Investigating eukaryotic cells with cryo-ET

Cai Tong Ng et al. Mol Biol Cell. .

Abstract

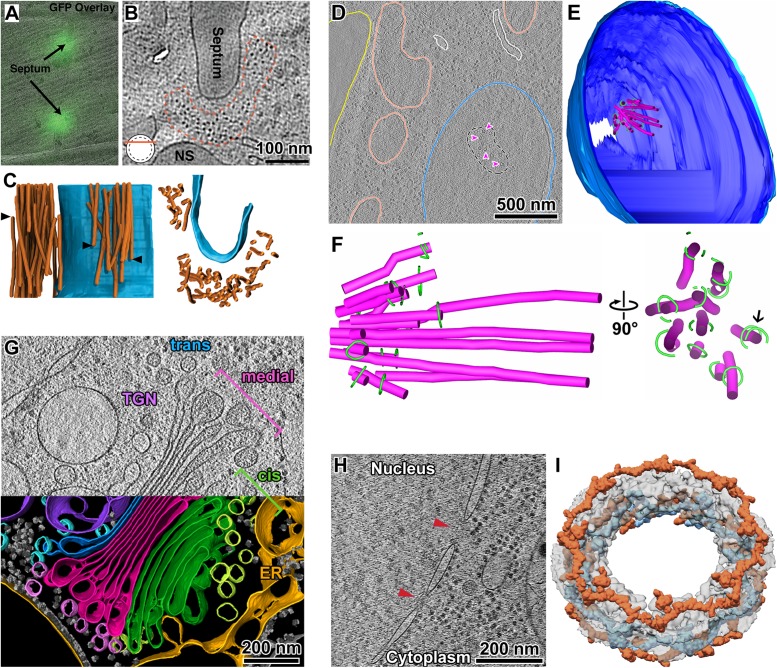
The interior of eukaryotic cells is mysterious. How do the large communities of macromolecular machines interact with each other? How do the structures and positions of these nanoscopic entities respond to new stimuli? Questions like these can now be answered with the help of a method called electron cryotomography (cryo-ET). Cryo-ET will ultimately reveal the inner workings of a cell at the protein, secondary structure, and perhaps even side-chain levels. Combined with genetic or pharmacological perturbation, cryo-ET will allow us to answer previously unimaginable questions, such as how structure, biochemistry, and forces are related in situ. Because it bridges structural biology and cell biology, cryo-ET is indispensable for structural cell biology-the study of the 3-D macromolecular structure of cells. Here we discuss some of the key ideas, strategies, auxiliary techniques, and innovations that an aspiring structural cell biologist will consider when planning to ask bold questions.


Figures

FIGURE 1:
FIGURE 1:
The principles of cryo-EM and cryo-ET. (A) The example object is “NUS” in block letters, centered within a thin spherical shell. The object’s projection image (bounded by a trapezoid) is shown below the Cartesian coordinates symbol. Electrons (e, white arrow) travel along the z-axis. To show the object’s orientation, the front of the shell has been removed. (B) Cryo-EM images are projections, not shadows. Density profiles (ρ) along the dashed lines (x-axis) are shown in the plots below. (C) In a cryo-ET experiment, the sample is rotated around the tilt axis (y-axis in this example), typically over a tilt range from −60° to +60°. Five possible tilted orientations are shown. (D) A tilt series consists of the set of cryo-EM images recorded over this tilt range. Each image corresponds to the object, as oriented directly above in C. The image gray levels are proportional to the samples’ projected mass along the z-axis. Together, the images encode the information needed for a 3-D reconstruction. Supplemental Movie S1 shows the full tilt series. (E) After alignment, the images (bounded by trapezoids) are oriented according to their corresponding tilt angles and then “back projected” to generate a 3-D density map called a cryotomogram. The limited tilt range of (±60°) results in missing-wedge artifacts, which manifest as image distortions. These distortions include the triangular features at 6 and 12 o’clock, the spokelike feature protruding from the bottom of the U, and the poorly defined lower portion of the letter S.
FIGURE 2:
FIGURE 2:
The missing wedge influences cryotomograms in unintuitive ways. The left subpanels correspond to a “complete” data set (180° tilt range) while the right subpanels correspond to an incomplete data set, with a 60° wedge of data missing. The tilt axis is parallel to the y-axis, and the electron beam is parallel to the z-axis. (A) Volumetric representations of cryo-ET data in Fourier space; kx, ky, and kz denote the Fourier-space coordinate system, which is aligned to the real-space coordinate system shown in the other panels. The right panel shows the two missing wedges, bounded by dashed lines. (B) Outer-kinetochore Dam1C/DASH ring densities simulated at 12 Å resolution. The rings in the bottom panel are rotated 90° around the x-axis, relative to an unchanged missing wedge. From PDB 6CFZ (Jenni and Harrison, 2018). (C) Nucleosome densities, also simulated at 12 Å resolution and shown in two orientations like in B. From PDB 1KX5 (Davey et al., 2002). Supplemental Movies S2 and S3 show how the Dam1C/DASH ring and the nucleosome are distorted in other orientations relative to the missing wedge. Note that real cryotomograms are affected by additional factors not modeled here. These factors include defocus, radiation damage, and discrete angular sampling.
FIGURE 3:
FIGURE 3:
Structural cell biology of chromatin. (A) An early example projection image of a cryosectioned CHO cell (McDowall, 1984). Key cytological features include the nucleus (N), chromatin (Ch), nucleolus (Nu), and a nuclear pore complex (P). Cryomicrotomy artifacts such as knife marks (KM) and chatter (W) are also indicated. Image courtesy of A. McDowall. (B) Cryotomographic slice of a Saccharomyces cerevisiae nucleus, imaged with “defocus” phase contrast. The boxed region is enlarged twofold and shown in the top-right panel. This position is also rendered as isosurfaces in the bottom-right panel. Adapted from Chen et al. (2016). (C) Cryotomographic slice of a Schizosaccharomyces pombe nucleus imaged with “Volta” phase contrast. The bottom-left subpanel shows a threefold enlarged view of a representative nucleosome (white arrow) and a larger multi-MDa complex (megacomplex) in the top-left corner. Both complexes are from the position boxed in the main panel. The bottom-right subpanels are cartoons of the organization of nucleosomes and megacomplexes in G2 and prometaphase (PM) nuclei. Adapted from Cai et al. (2018b). (D) Cryotomographic slice of an embryonic Drosophila neuronal nucleus. Heterochromatin is marked out with white dashed lines and the nuclear pore complex (NPC) is labeled. Adapted from Eltsov et al. (2018). (E) Nucleosome remapping in a HeLa cell nucleus. Left: cryotomographic slice of a HeLa cell nucleus. The regions with higher local nucleosome concentrations are marked out with purple dashed lines. The white arrow indicates a nuclear pore complex. Right: 3-D annotation of the same cryotomogram after nucleosome remapping. (F) Arrangement and organization of di- and trinucleosomes in the HeLa cell nucleus. The two nucleosome conformational classes that were “purified” in silico are shaded magenta and blue. E and F were adapted from Cai et al. (2018a).
FIGURE 4:
FIGURE 4:
Cryo-ET analysis of model organisms. (A) Correlation of a fluorescence light cryomicroscopy image of a S. pombe cell cryosection and the cryo-EM projection image of the same position. The fluorescence signal comes from Rlc1-GFP, which marks myosin at the septum’s leading edge. (B) Cryotomographic slice of S. pombe, taken near the contractile actomyosin ring densities (outlined with red dots). (C) Two views (left and right) of a 3-D annotation of an actomyosin ring (orange) and septum (blue). The arrowheads denote the termini of some actomyosin ring densities. A–C were adapted from Swulius et al. (2018). (D) Cryotomographic slice of a metaphase S. cerevisiae cell. Cell membrane (yellow); mitochondria (salmon); nuclear membrane (blue); spindle microtubules (magenta arrowheads). (E) 3-D annotation of seven serial cryotomograms. Outer-nuclear membrane (light blue); inner nuclear membrane (dark blue); spindle microtubules (magenta); Dam1C/DASH complex (green). (F) Enlarged orthogonal views of the 3-D annotation of the metaphase S. cerevisiae spindle from E. D–F were adapted from Ng et al. (2019). (G) Cryotomographic slice of a C. reinhardtii Golgi body (top half) and its corresponding 3-D annotation (bottom half). Portions of the trans-Golgi network (TGN) and endoplasmic reticulum (ER) were captured in this cryotomogram. Adapted from Bykov et al. (2017). (H) Cryotomographic slice of the nuclear periphery of C. reinhardtii. Red arrowheads indicate nuclear pore complexes. (I) A subtomogram average of the C. reinhardtii nuclear pore complex. The Y-complexes (orange and light blue) make up the bulk of the cytoplasmic and nuclear rings of the nuclear pore. H and I were adapted from Mosalaganti et al. (2018).
FIGURE 5:
FIGURE 5:
Structural cell biology of cellular pathology. (A) Fluorescence light cryomicrograph of a cryosection of HeLa cells. The green fluorescence signals correspond to GFP-Bax. (B) Correlation of the fluorescence cryomicroscopy signals from A with a low-magnification cryo-EM projection image of the same cell. (C) Cryotomographic slice corresponding to the white square in B. GFP-Bax cluster densities are annotated in red. (D) Details of a rupturing mitochondrion from another cell. The red and yellow arrowheads, respectively, indicate the inner and outer membranes. A–D were adapted from Ader et al. (2019). (E) Cryotomographic slice showing the bacterium Amoebophilus asiaticus in the cytoplasm of an infected amoeba cell. An array of type 6 secretion structures (T6S array) is indicated within the cytoplasm of the bacterium. Adapted from Böck et al. (2017). (F, G) Projection image and cryotomographic slice, respectively, of cryosections of S. cerevisiae cells that have large prion structures. F and G show parts of a “dot” and a “ring” prion structure, respectively. (H) Model of arrangement of Sup35 fiber arrays (purple) and cross-bridges (pink). F–H were adapted from Saibil et al. (2012).
FIGURE 6:
FIGURE 6:
Structural cell biology of floppy complexes. This schematic shows how a divide, conquer, and unite strategy can reveal kinetochore structures in situ. (A) Cartoons of cryotomograms (thin gray slabs; tomo1, tomo2, etc.) of thinned yeast (rounded gray bodies). In this example, the kinetochores are first localized by fluorescence cryomicroscopy (green signal). Cryo-CLEM greatly facilitates the identification of subtomograms that contain kinetochores. (B) Alignment and classification of smaller subtomograms that contain kinetochore subassemblies. Owing to the flexibility and conformational heterogeneity of the kinetochores, each subassembly must be windowed and then tracked throughout the alignment and classification process. Subassemblies that have similar conformations are aligned and averaged, producing a higher signal-to-noise ratio “class average.” In this schematic, the outer kinetochore, inner kinetochore, and centromere-associated complexes are colored green, violet, and blue, respectively. (C) These class averages can then be rotated and translated to the orientations and coordinates of each copy in their in situ context at the tips of kinetochore microtubules (gray). This remapping approach can deal with “floppy” complexes as long as some of the subassemblies are monolithic.

Similar articles

Cited by

References

    1. Ader NR, Hoffmann PC, Ganeva I, Borgeaud AC, Wang C, Youle RJ, Kukulski W. (2019). Molecular and topological reorganizations in mitochondrial architecture interplay during Bax-mediated steps of apoptosis. Elife , e40712. - PMC - PubMed
    1. Adrian M, Dubochet J, Lepault J, McDowall AW. (1984). Cryo-electron microscopy of viruses. Nature , 32–36. - PubMed
    1. Al-Amoudi A, Castano-Diez D, Devos DP, Russell RB, Johnson GT, Frangakis AS. (2011). The three-dimensional molecular structure of the desmosomal plaque. Proc Natl Acad Sci USA , 6480–6485. - PMC - PubMed
    1. Al-Amoudi A, Diez DC, Betts MJ, Frangakis AS. (2007). The molecular architecture of cadherins in native epidermal desmosomes. Nature , 832–837. - PubMed
    1. Albert S, Schaffer M, Beck F, Mosalaganti S, Asano S, Thomas HF, Plitzko JM, Beck M, Baumeister W, Engel BD. (2017). Proteasomes tether to two distinct sites at the nuclear pore complex. Proc Natl Acad Sci USA , 13726–13731. - PMC - PubMed

Publication types

MeSH terms

LinkOut - more resources