Multicenter Study
. 2020 Feb 13;5(3):e134251.
doi: 10.1172/jci.insight.134251.

Siponimod enriches regulatory T and B lymphocytes in secondary progressive multiple sclerosis

Collaborators, Affiliations
Multicenter Study

Siponimod enriches regulatory T and B lymphocytes in secondary progressive multiple sclerosis

Qi Wu et al. JCI Insight. .

Abstract

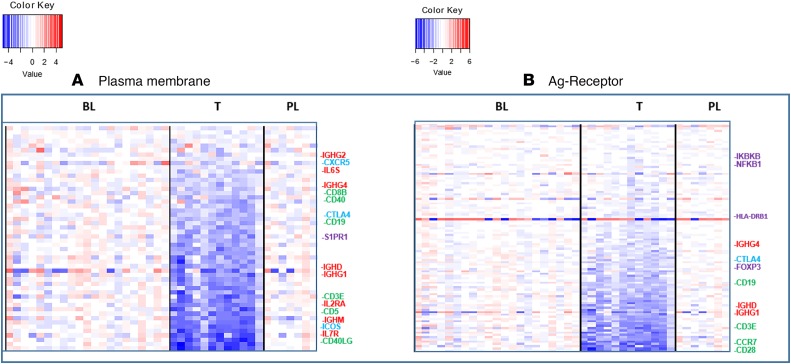
BACKGROUNDSiponimod (BAF312) is a selective sphingosine-1-phosphate receptor 1 and 5 (S1PR1, S1PR5) modulator recently approved for active secondary progressive multiple sclerosis (SPMS). The immunomodulatory effects of siponimod in SPMS have not been previously described.METHODSWe conducted a multicentered, randomized, double-blind, placebo-controlled AMS04 mechanistic study with 36 SPMS participants enrolled in the EXPAND trial. Gene expression profiles were analyzed using RNA derived from whole blood with Affymetrix Human Gene ST 2.1 microarray technology. We performed flow cytometry-based assays to analyze the immune cell composition and microarray gene expression analysis on peripheral blood from siponimod-treated participants with SPMS relative to baseline and placebo during the first-year randomization phase.RESULTSMicroarray analysis showed that immune-associated genes involved in T and B cell activation and receptor signaling were largely decreased by siponimod, which is consistent with the reduction in CD4+ T cells, CD8+ T cells, and B cells. Flow cytometric analysis showed that within the remaining lymphocyte subsets there was a reduction in the frequencies of CD4+ and CD8+ naive T cells and central memory cells, while T effector memory cells, antiinflammatory Th2, and T regulatory cells (Tregs) were enriched. Transitional regulatory B cells (CD24hiCD38hi) and B1 cell subsets (CD43+CD27+) were enriched, shifting the balance in favor of regulatory B cells over memory B cells. The proregulatory shift driven by siponimod treatment included a higher proliferative potential of Tregs compared with non-Tregs, and upregulated expression of PD-1 on Tregs. Additionally, a positive correlation was found between Tregs and regulatory B cells in siponimod-treated participants.CONCLUSIONThe shift toward an antiinflammatory and suppressive homeostatic immune system may contribute to the clinical efficacy of siponimod in SPMS.TRIAL REGISTRATIONNCT02330965.

Keywords: Autoimmunity; Multiple sclerosis.


Conflict of interest statement

Conflict of interest: YMD has served as a consultant/speaker and/or received grant support from Acorda Therapeutics, Bayer Pharmaceutical, Biogen Idec, Celgene, EMD Serono, Genentech, Sanofi-Genzyme, Novartis, Questor, Chugai Pharmaceuticals, and Teva Neuroscience.

Figures

Figure 1
Figure 1. AMS04 patient allocation and disposition.
RTP, randomized treatment phase; OLP, open‑label phase. The blue boxed part is the RTP that we present in this study.
Figure 2
Figure 2. Microarray analysis before and after siponimod treatment.
In this experiment, 1531 differentially expressed genes were identified out of a total of 13,399 genes with measured expression as shown in volcano plot (A). A threshold of 0.05 for statistical significance (P value) and a log fold change (logFc) in expression with absolute value of at least 0.58 was chosen. Blue dots and down arrow indicate genes with decreased expression. Red dots and up arrow indicate genes with increased expression. (B) 3D PCA analysis: With PC1-47%, PC2-29%, PC3-24%, separation of SPMS baseline group (green dots) from siponimod-treated (blue dots) and placebo-treated (gray dots) groups is shown, indicating different gene expression profiles for SPMS patients before and after siponimod treatment. (C) The significantly representative pathways are shown generated by iPathwayGuide with overrepresentation on the x axis (pORA) and the total pathway accumulation on the y axis (pAcc).
Figure 3
Figure 3. Heatmap of cellular signaling pathway changes after siponimod treatment.
Heatmaps with significant changes in genes comparing siponimod-treated (T) with SPMS baseline (BL) and placebo-treated (PL) in plasma membrane (A) and antigen-receptor (B) signaling pathways ordered by expression level from bottom (low) to top (high). These 2 pathways were chosen because they were classified in iPathwayGuide. Blue indicates decreased gene expression and red indicates increased gene expression. BL and PL were largely unchanged, while T showed a general reduction in expression. The rows are different genes. Blue-labeled genes: cosignaling molecules e.g. CTLA4, ICOS, and CXCR5; red-labeled genes: immunoglobulin and interleukin related; green-labeled genes: cell surface markers; and purple-labeled genes: other signaling molecules. The columns reflect BL (baseline, n = 21); PL (placebo, n = 7); and T (siponimod treatment, n = 12).
Figure 4
Figure 4. Changes in blood cell counts from baseline to 12 months in study participants assigned to siponimod or placebo.
(A) Absolute white blood cell (WBC) counts. Placebo n: 0 months = 13, 6 months = 12, 9–12 months = 12. Siponimod n: 0 months = 23, 6 months = 20, 9–12 months = 18. (B) Absolute peripheral blood mononuclear cell (PBMC) counts calculated by subtracting granulocytes from WBC counts. Placebo n: 0 months = 13, 6 months = 12, 9–12 months = 12. Siponimod n: 0 months = 23, 6 months = 20, 9–12 months = 17. (C) Absolute lymphocyte counts. Placebo n: 0 months = 13, 6 months = 12, 9–12 months = 12. Siponimod n: 0 months = 23, 6 months = 20, 9–12 months = 17. Symbols represent individual participants. Horizontal lines indicate mean for placebo (black) and siponimod (red). P values above the data symbols represent statistically significant differences between placebo and siponimod at the same time point. Mann-Whitney U test was used for A; B, 9–12 months; and C, 6 and 9–12 months. Unpaired t test was used for B, 0 and 6 months.
Figure 5
Figure 5. Siponimod treatment primarily decreases absolute levels of CD4+ T cells and CD19+ B cells in blood.
Absolute cell counts per milliliter blood were calculated using clinical complete blood cell counts and the percentages as determined by flow cytometry following staining with the markers TCRαβ, CD4, CD14, CD8, CD19, CD56, Lin, and HLA-DR. (A) CD4+ T cells (TCRαβ+CD4+). (B) CD8+ T cells (TCRαβ+CD8+). Data for one patient at all time points were excluded because they were statistical outliers. (C) CD4/CD8 ratio. Data for one patient at all time points were excluded because they were statistical outliers. (D) B cells (CD19+). (E) NK cells (TCRαβCD56+). (F) NKT cells (TCRαβ+CD56+). (G) Monocytes (CD14+). Symbols represent individual participants, horizontal lines show means for placebo (black) and siponimod (red); numbers above the data symbols represent statistically significant differences between placebo (black) and siponimod (red). Mann-Whitney U test was used for A and B; C and D, 0 and 9–12 months; E, 9–12 months; and F and G, 0 and 9–12 months. Unpaired t test was used for E, 0 and 6 months; and G, 6 months. Unpaired t test with Welch’s correction was used for C and D, 6 months. (A, B, and DG) Placebo n: 0 months = 9, 6 months = 9, 9–12 months = 12. (C) Placebo n: 0 months = 8, 6 months = 8, 9–12 months = 11. (C and EG) Siponimod n: 0 months = 16, 6 months = 16, 9–12 months = 16. (B) Siponimod n: 0 months = 15, 6 months = 15, 9–12 months = 16. (A and D) Siponimod n: 0 months = 16, 6 months = 16, 9–12 months = 17.
Figure 6
Figure 6. Changes in CD4+ naive and memory T cell populations from baseline to 12 months following treatment with placebo or siponimod.
Cross-sectional representation (AD) and longitudinal representation (EH) of frequencies of subsets as a fraction of total CD3+CD4+ T cells. (A and E) Naive T (CD45ROCCR7+). (B and F) Tcm (CD45RO+CCR7+). (C and G) Tem (CD45RO+CCR7). (D and H) Temra (CD45ROCCR7). (AD) Symbols represent individual participants, horizontal lines show means for placebo (black) and siponimod (red); numbers above the data symbols represent statistically significant differences between placebo (black) and siponimod (red) at the same time point. Unpaired t test was used for A and B. Mann-Whitney U test was used for C, 0 months and D. Unpaired t test with Welch’s correction was used for C, 6 and 9–12 months. Placebo n: 0 months = 10, 6 months = 9, 9–12 months = 12. Siponimod n: 0 months = 17, 6 months = 16, 9–12 months = 18. (EH) Data are mean ± SEM. P values represent statistically significant differences within group comparisons for placebo (black) and siponimod (red) using Tukey’s or Dunn’s multiple-comparisons test. Placebo n = 9. (E–G) Siponimod n: 0 months = 14, 6 months = 15, 9–12 months = 14. (H) Siponimod n = 13.
Figure 7
Figure 7. Changes in CD4 naive and memory T cell populations from baseline to 12 months following treatment with placebo or siponimod.
Cross-sectional representation (AD) and longitudinal representation (EH) of frequencies of subsets as a fraction of total CD3+CD4 T cells. (A and E) Naive T (CD45ROCCR7+). (B and F) Tcm (CD45RO+CCR7+). (C and G) Tem (CD45RO+CCR7). (D and H) Temra (CD45ROCCR7). (AD) Symbols represent individual participants, lines show means for placebo (black) and siponimod (red); numbers above the data symbols represent statistically significant differences between placebo (black) and siponimod (red) at the same time point. Unpaired t test was used for A, 0 and 6 months; C, 6 and 9–12 months. Mann-Whitney U test was used for A, 9–12 months; B; and D, 0 months. Unpaired t test with Welch’s correction was used for C, 0 months; D, 6 and 9–12 months. (EH) Data are shown as mean ± SEM. P values represent statistically significant differences within group comparisons for placebo (black) and siponimod (red) using Tukey’s or Dunn’s multiple-comparisons test. (AD) Placebo n: 0 months = 10, 6 months = 9, 9–12 months = 12. Siponimod n: 0 months = 17, 6 months = 16, 9–12 months = 18. (EH) Placebo n = 9. (E and F) Siponimod n = 13. (G and H) Siponimod n: 0 months = 14, 6 months = 15, 9–12 months = 14.
Figure 8
Figure 8. Siponimod shifts the balance of effector T cells toward more Th2 and Treg cells in blood.
Frequencies of effector T cell subsets shown as a fraction of total CD3+CD4+ T cells. (A and E) Th2 (CD4+CXCR3CCR6CD161CRTH2+) (B and F) Th2/Th17 (CD4+CXCR3CCR6+CD161+) ratio. (C and G) Treg (CD4+CD25+FoxP3+). (D and H) Treg/Th17 ratio. (AD) Symbols represent individual participants, lines show means for placebo (black) and siponimod (red); numbers above the data symbols represent P values where the difference between placebo (black) and siponimod (red) is statistically significant at the same time points. Unpaired t test was used for AC, 0 months; and D, 6 months. Mann-Whitney U test was used for A, 6 months; B, 6 and 9–12 months; and C, 9–12 months. Unpaired t test with Welch’s correction was used for A, 9–12 months; C, 6 months; and D, 0 and 9–12 months. (EH) Longitudinal representation. Data are shown as mean ± SEM. P values represent statistically significant differences within group comparisons for placebo (black) and siponimod (red) using Tukey’s or Dunn’s multiple-comparisons test. (A–D) Placebo n: 0 months = 10, 6 months = 9, 9–12 months = 12. (A and B) Siponimod n: 0 months = 17, 6 months = 16, 9–12 months = 18. (C and D) Siponimod n: 0 months = 17, 6 months = 14, 9–12 months = 18. (E–H) Placebo n: 0 months = 9, 6 months = 9, 9–12 months = 9. Siponimod n: 0 months = 14, 6 months = 15, 9–12 months = 14.
Figure 9
Figure 9. Siponimod treatment increases percentage of regulatory B cell populations in blood.
Cross-sectional representation (A–F) and longitudinal representation (G and H) of frequencies of B cell subsets as fraction of total CD19+ B cells. (A) Naive B cells (CD19+IgD+CD27). (B) CD27+ B cells (CD19+CD27+). (C) Unswitched memory B cells (CD19+IgD+CD27+). (D) Switched memory B cells (IgDCD27+). Regulatory B cell populations: (E and G) Transitional Bregs (CD19+ CD24++CD38++). (F) B1 cells (CD19+CD43+CD27+). (H) Transitional/switched memory B cell ratio. (AF) Symbols represent individual participants, lines show means for placebo (black) and siponimod (red); numbers above the data symbols represent P values where the difference between placebo and siponimod is statistically significant at the same time points. Unpaired t test was used for B; D, 0 and 9–12 months; and E, 6 months. Mann-Whitney U test was used for A; C; D, 6 months; E, 0 and 6 months; and F. Unpaired t test with Welch’s correction was used for E, 9–12 months. Placebo n: 0 months = 10, 6 months = 8, 9–12 months = 12. Siponimod n: 0 months = 17, 6 months = 15, 9–12 months = 17. (G and H) Data are shown as mean ± SEM. P values represent statistically significant differences within group comparisons for placebo (black) and siponimod (red) using Tukey’s or Dunn’s multiple-comparisons test. (G and H) Placebo n: 0 months = 10, 6 months = 8, 9–12 months = 12. Siponimod n: 0 months = 15, 6 months = 14, 9–12 months = 17.
Figure 10
Figure 10. Increased frequency of combined Bregs (sum of transitional B cells and B1 cells) are closely correlated with increased frequency of Tregs (CD25+FoxP+CD4+ T cells) in siponimod-treated, but not placebo-treated patients.
(A) Transitional Breg plus B1 cells cross-sectional representation. Symbols represent individual participants, lines show means for placebo (black) and siponimod (red); numbers above the data symbols represent statistically significant P values for differences between placebo and siponimod at the same time points. Mann-Whitney U test was used for A, 0 and 6 months. Unpaired t test with Welch’s correction was used for A, 9–12 months. Placebo n: 0 months = 10, 6 months = 8, 9–12 months = 12. Siponimod n: 0 months = 15, 6 months = 14, 9–12 months = 17. (B) Spearman’s correlation analysis of combined Breg frequencies of B cells with Treg frequencies of CD4+ T cells was done using data derived from patients before and after 6 months and 9–12 months of placebo treatment. Treg and Breg pairs n = 27 (0 months = 9, 6 months = 9, 9–12 months = 9). (C) Spearman’s correlation analysis of combined regulatory B cell (transitional Breg + B1) frequencies of B cells with Treg frequencies of CD4+ T cells was done using data derived patients before (black symbols) and after 6 months (red open symbols) and 9–12 months (red squares) of siponimod treatment. Spearman’s correlation coefficient r and P value are shown. Treg versus Breg pairs n = 33 (0 months = 12, 6 months = 11, 9–12 months = 10). The line in the graph is the best-fit linear regression line.
Figure 11
Figure 11. Tregs that are increased in frequency after siponimod treatment exhibit increased proliferation.
(A) Representative FACS profile of CD4+ T cells from patient before and after treatment with siponimod (12 months) or placebo (10 months, end of study). (B) Cross-sectional comparison of Ki67+ percentage of FoxP3+CD4+ T cells at baseline, 6 months, and 9–12 months after treatment with placebo (0 months, n = 8; 6 months, n = 8; 9–12 months, n = 12) or siponimod (0 months, n = 13; 6 months, n = 13; 9–12 months, n = 16). (C) Increased PD-1+ frequency of CD4+ T cells in 9–12 month siponimod-treated patients (n = 10) compared with 9–12 month placebo-treated patients (n = 7). Numbers above the data symbols represent P values where the difference between placebo and siponimod is statistically significant at the same time points. Unpaired t test was used for A, 0 and 9–12 months. Mann-Whitney U test was used for A, 9–12 months; and C.

References

    1. Lublin FD, et al. Defining the clinical course of multiple sclerosis: the 2013 revisions. Neurology. 2014;83(3):278–286. doi: 10.1212/WNL.0000000000000560. - DOI - PMC - PubMed
    1. Fitzner D, Simons M. Chronic progressive multiple sclerosis - pathogenesis of neurodegeneration and therapeutic strategies. Curr Neuropharmacol. 2010;8(3):305–315. doi: 10.2174/157015910792246218. - DOI - PMC - PubMed
    1. Kappos L, et al. Siponimod versus placebo in secondary progressive multiple sclerosis (EXPAND): a double-blind, randomised, phase 3 study. Lancet. 2018;391(10127):1263–1273. doi: 10.1016/S0140-6736(18)30475-6. - DOI - PubMed
    1. Mao-Draayer Y, Sarazin J, Fox D, Schiopu E. The sphingosine-1-phosphate receptor: A novel therapeutic target for multiple sclerosis and other autoimmune diseases. Clin Immunol. 2017;175:10–15. doi: 10.1016/j.clim.2016.11.008. - DOI - PMC - PubMed
    1. Lublin F, et al. Oral fingolimod in primary progressive multiple sclerosis (INFORMS): a phase 3, randomised, double-blind, placebo-controlled trial. Lancet. 2016;387(10023):1075–1084. doi: 10.1016/S0140-6736(15)01314-8. - DOI - PubMed

Publication types

Associated data