. 2020 Jan 13;37(1):104-122.e12.
doi: 10.1016/j.ccell.2019.12.006.

Treatment-Induced Tumor Dormancy through YAP-Mediated Transcriptional Reprogramming of the Apoptotic Pathway

Affiliations

Treatment-Induced Tumor Dormancy through YAP-Mediated Transcriptional Reprogramming of the Apoptotic Pathway

Kari J Kurppa et al. Cancer Cell. .

Abstract

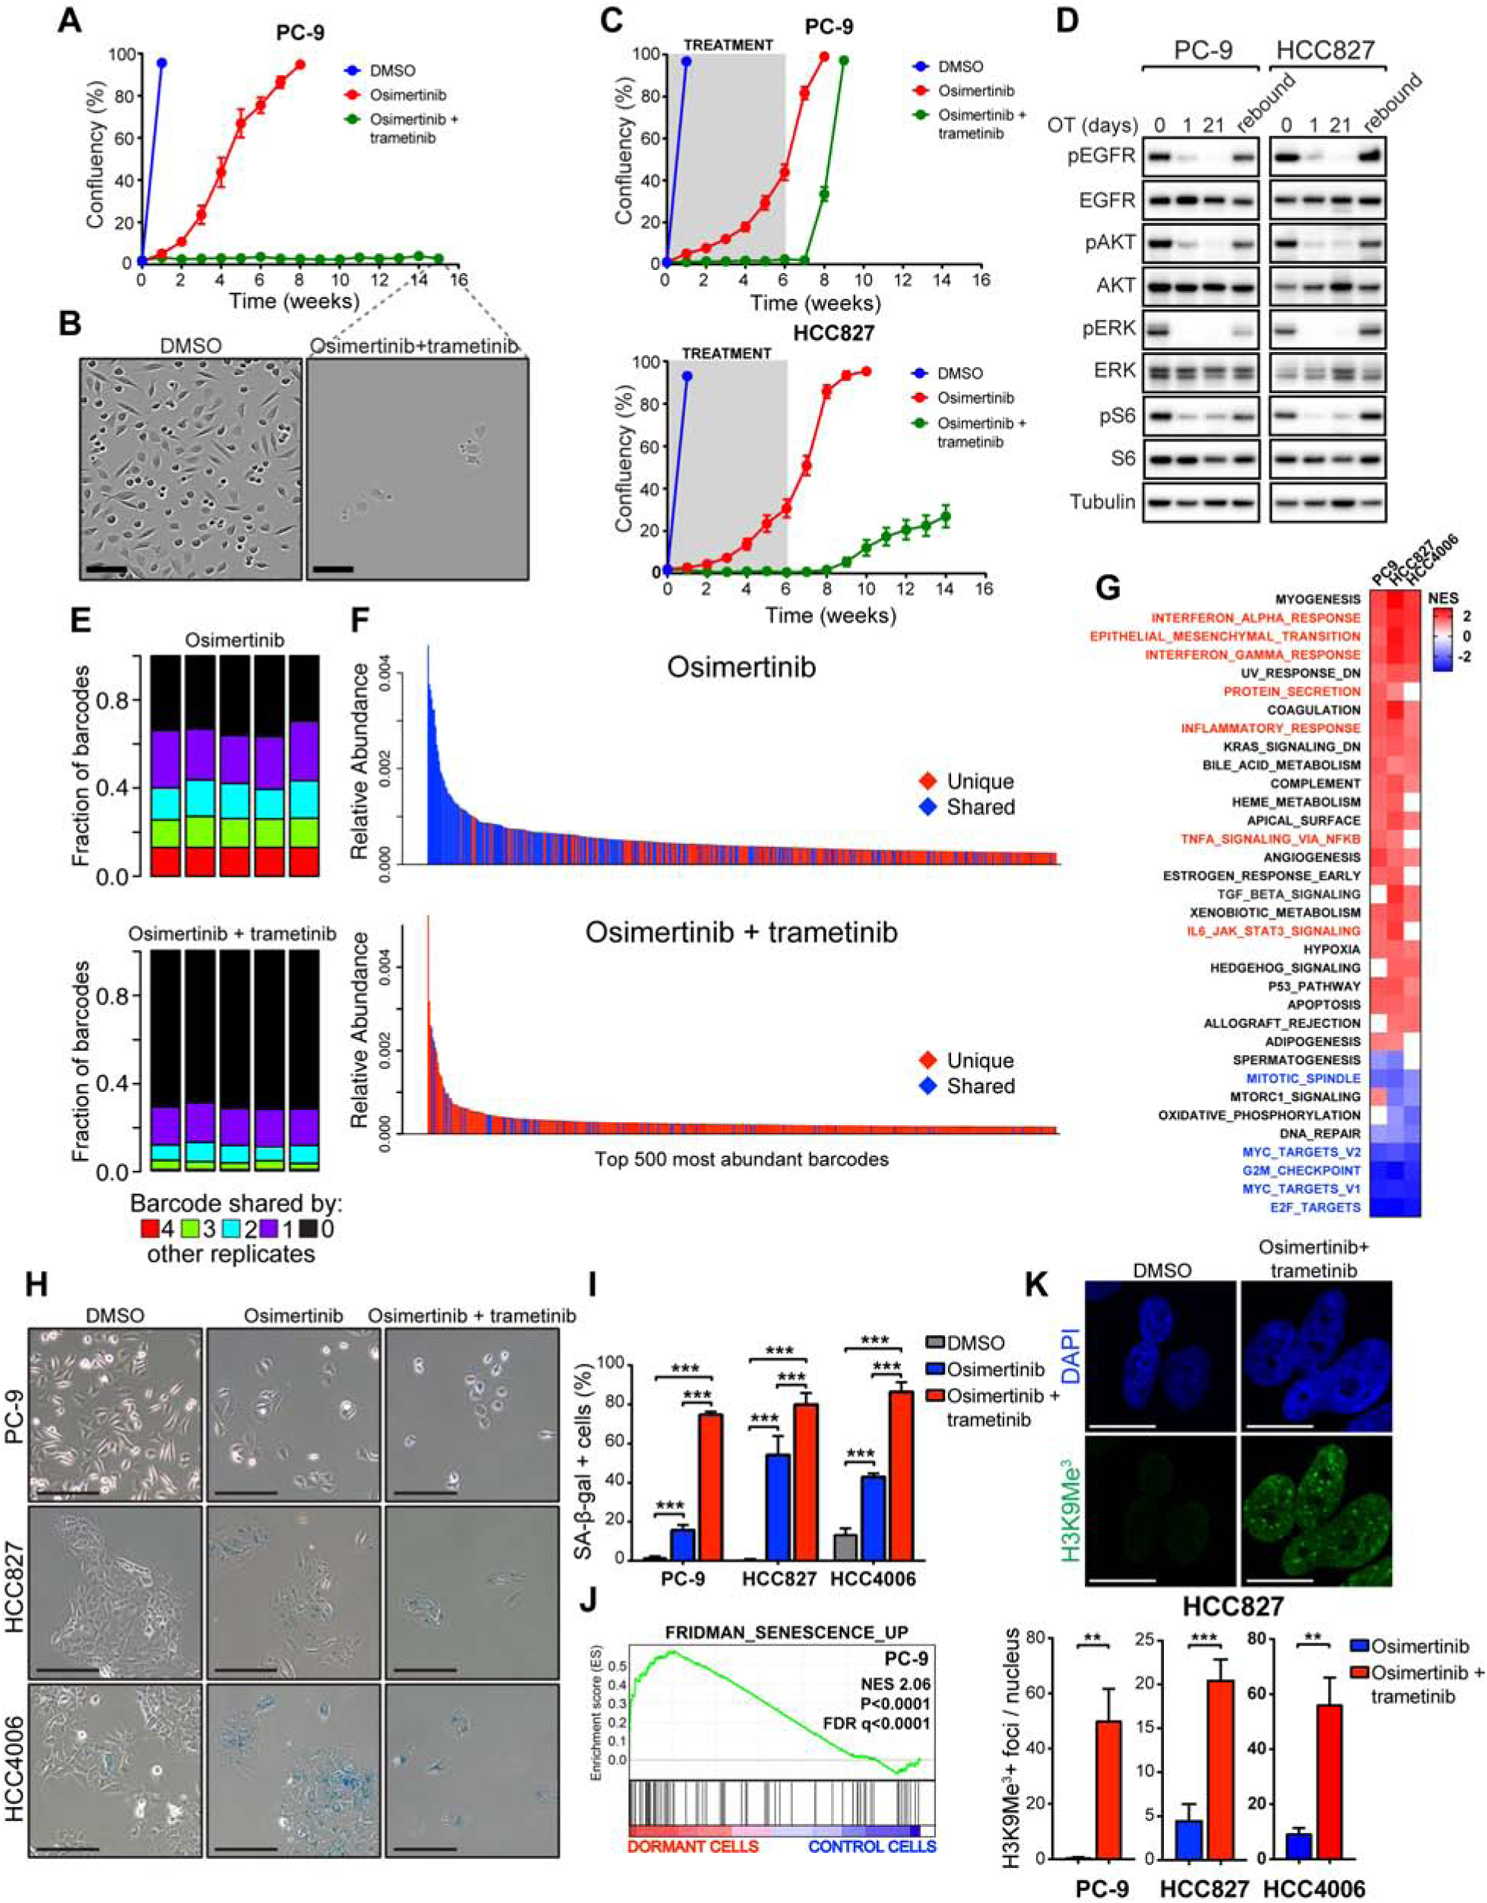
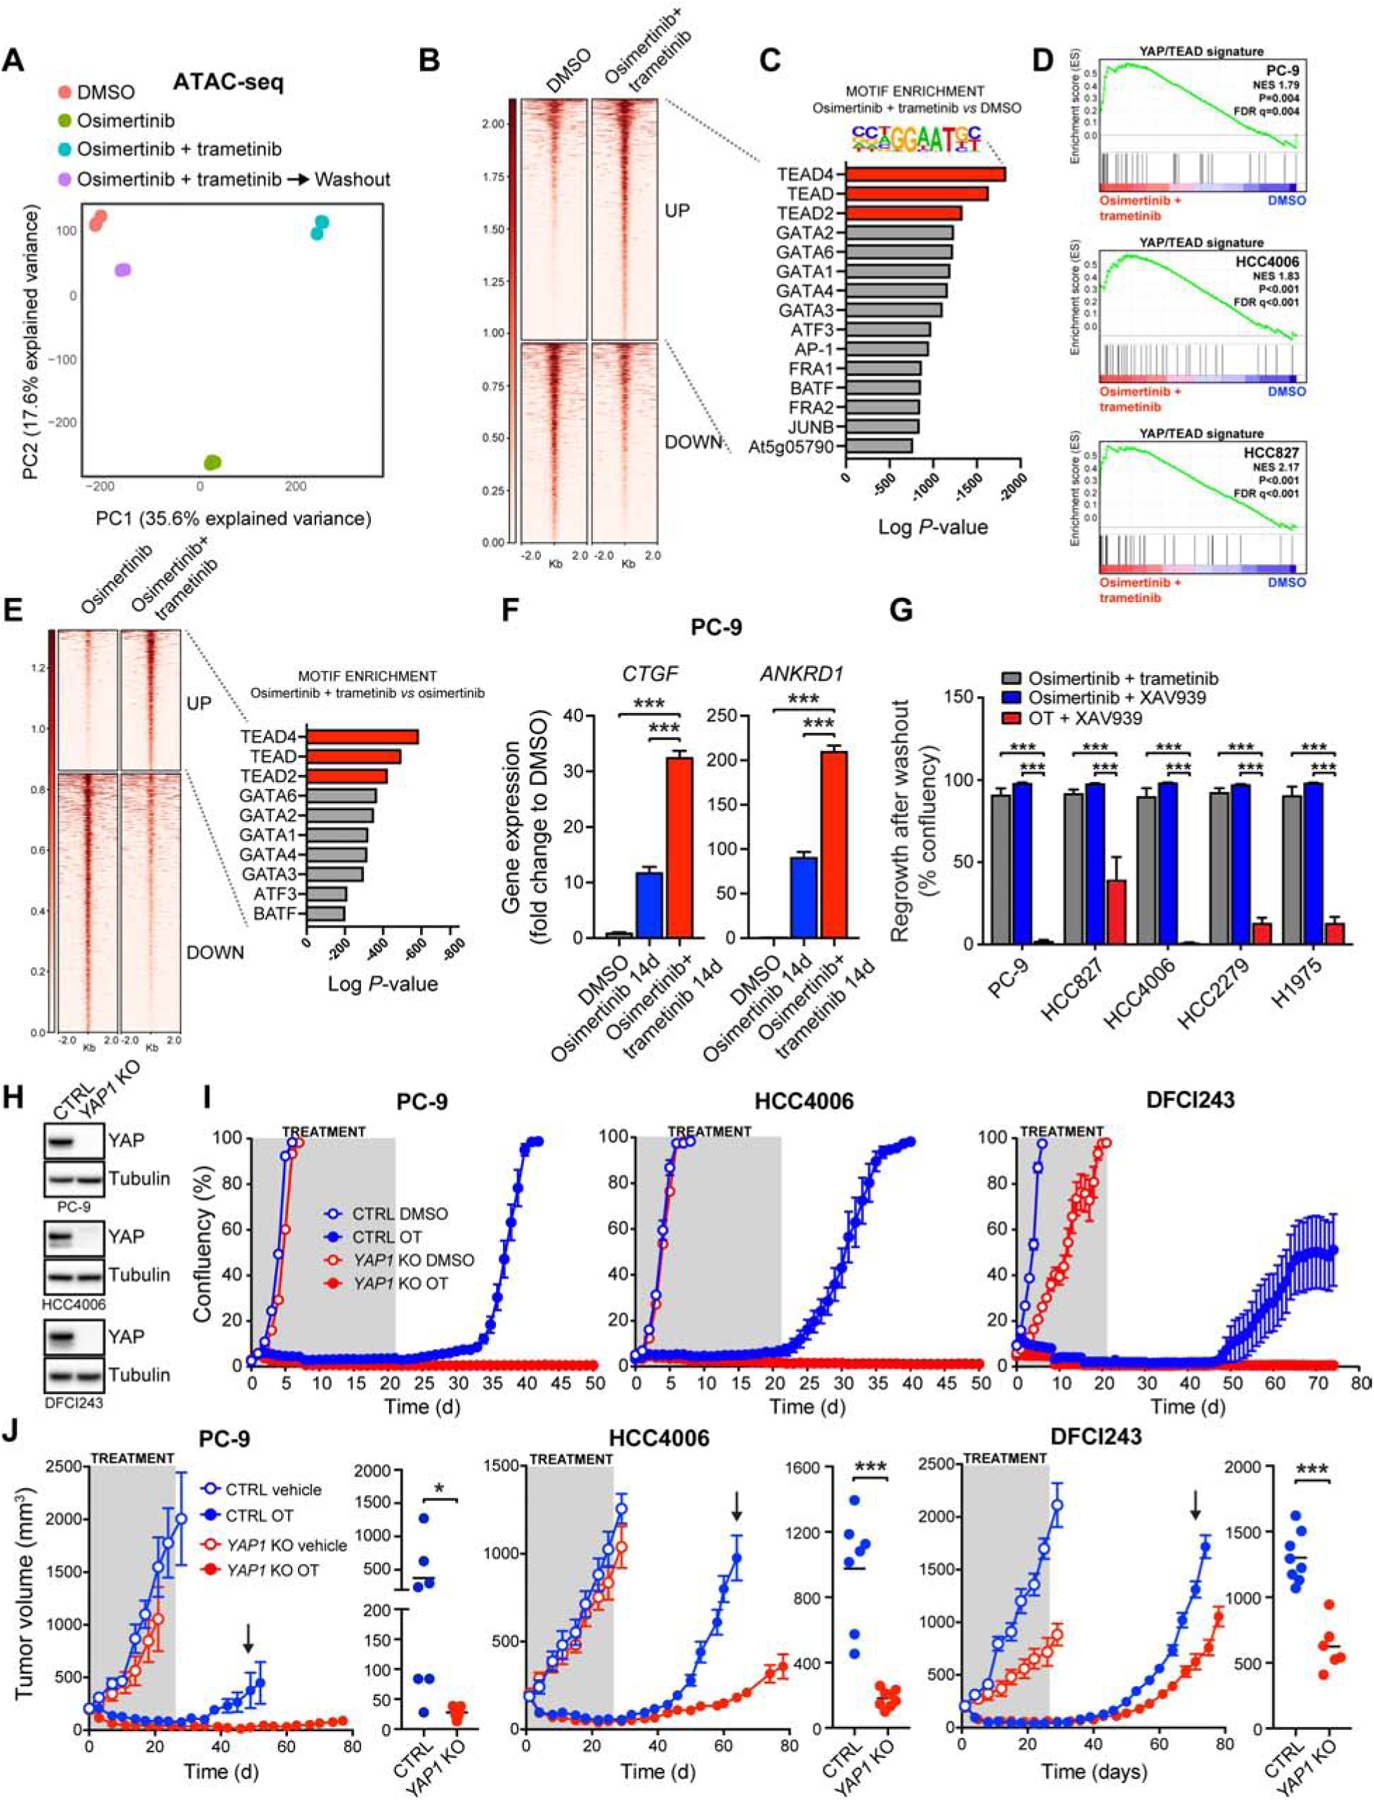
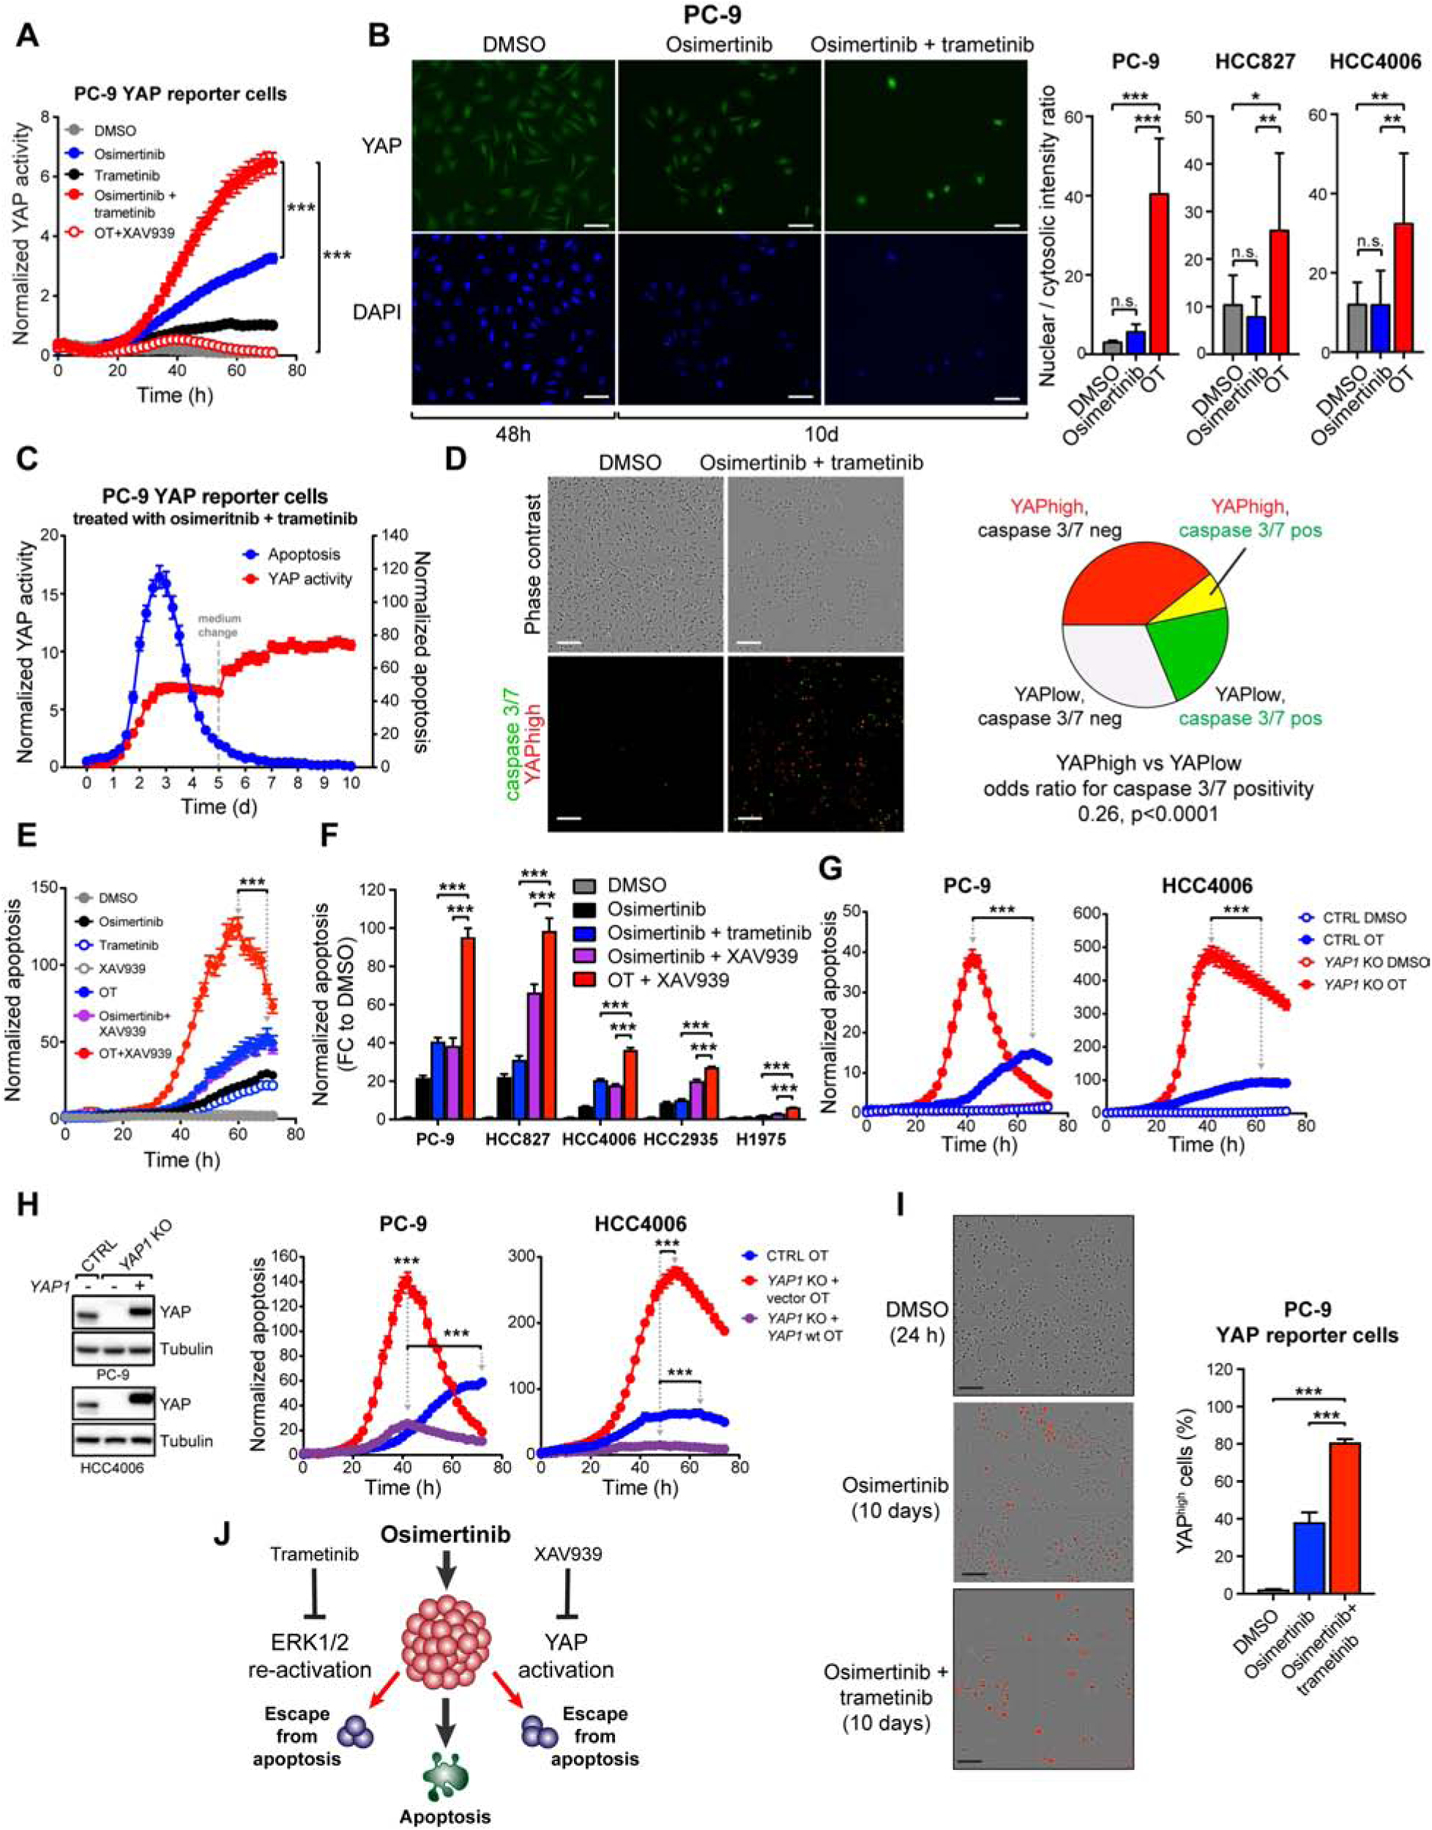
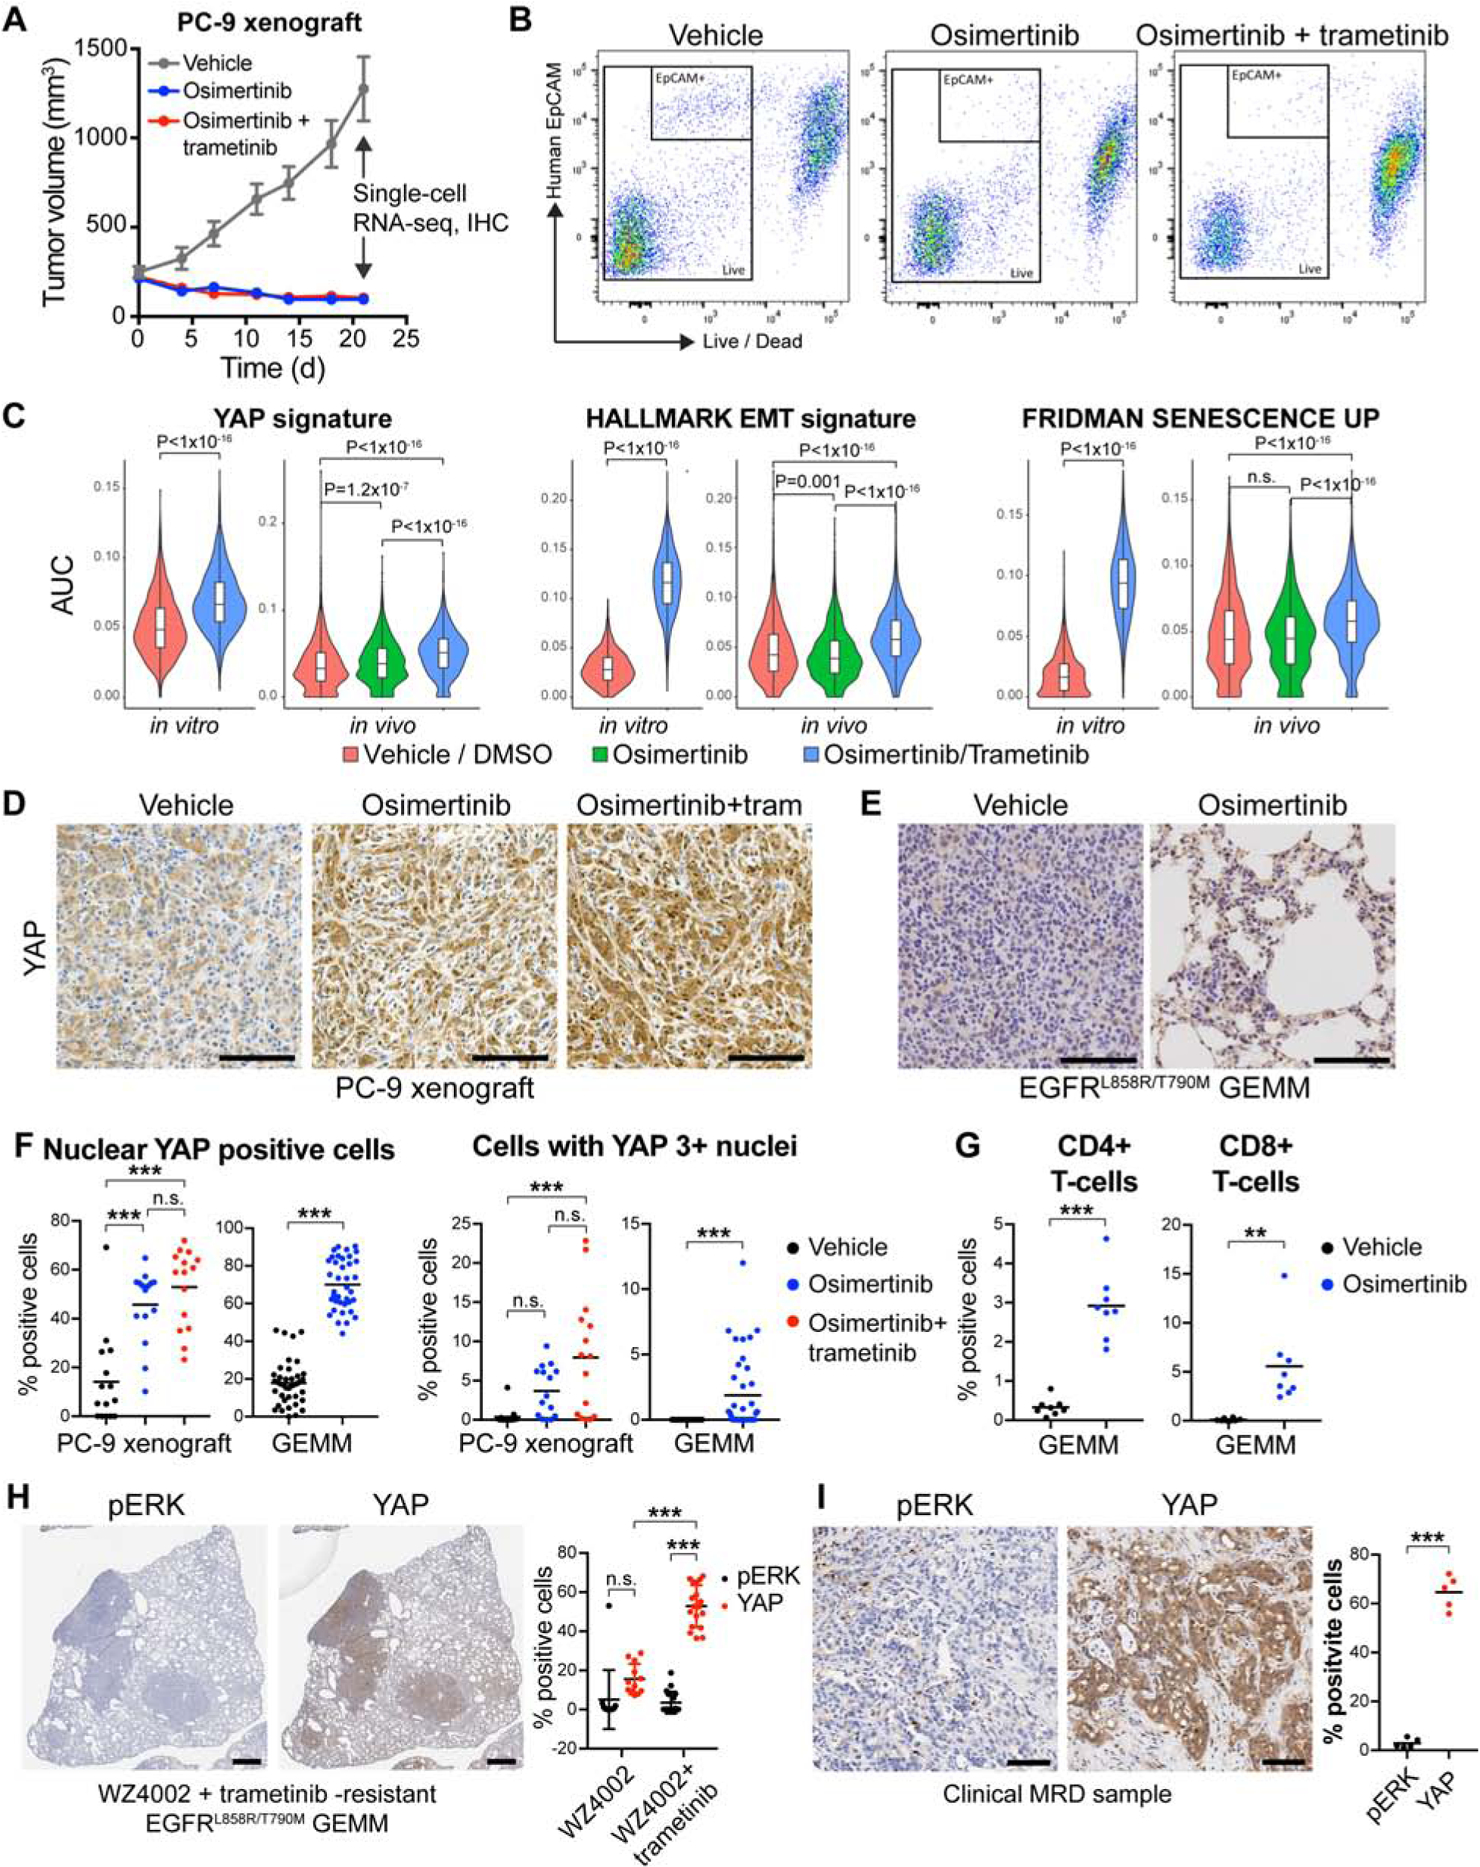
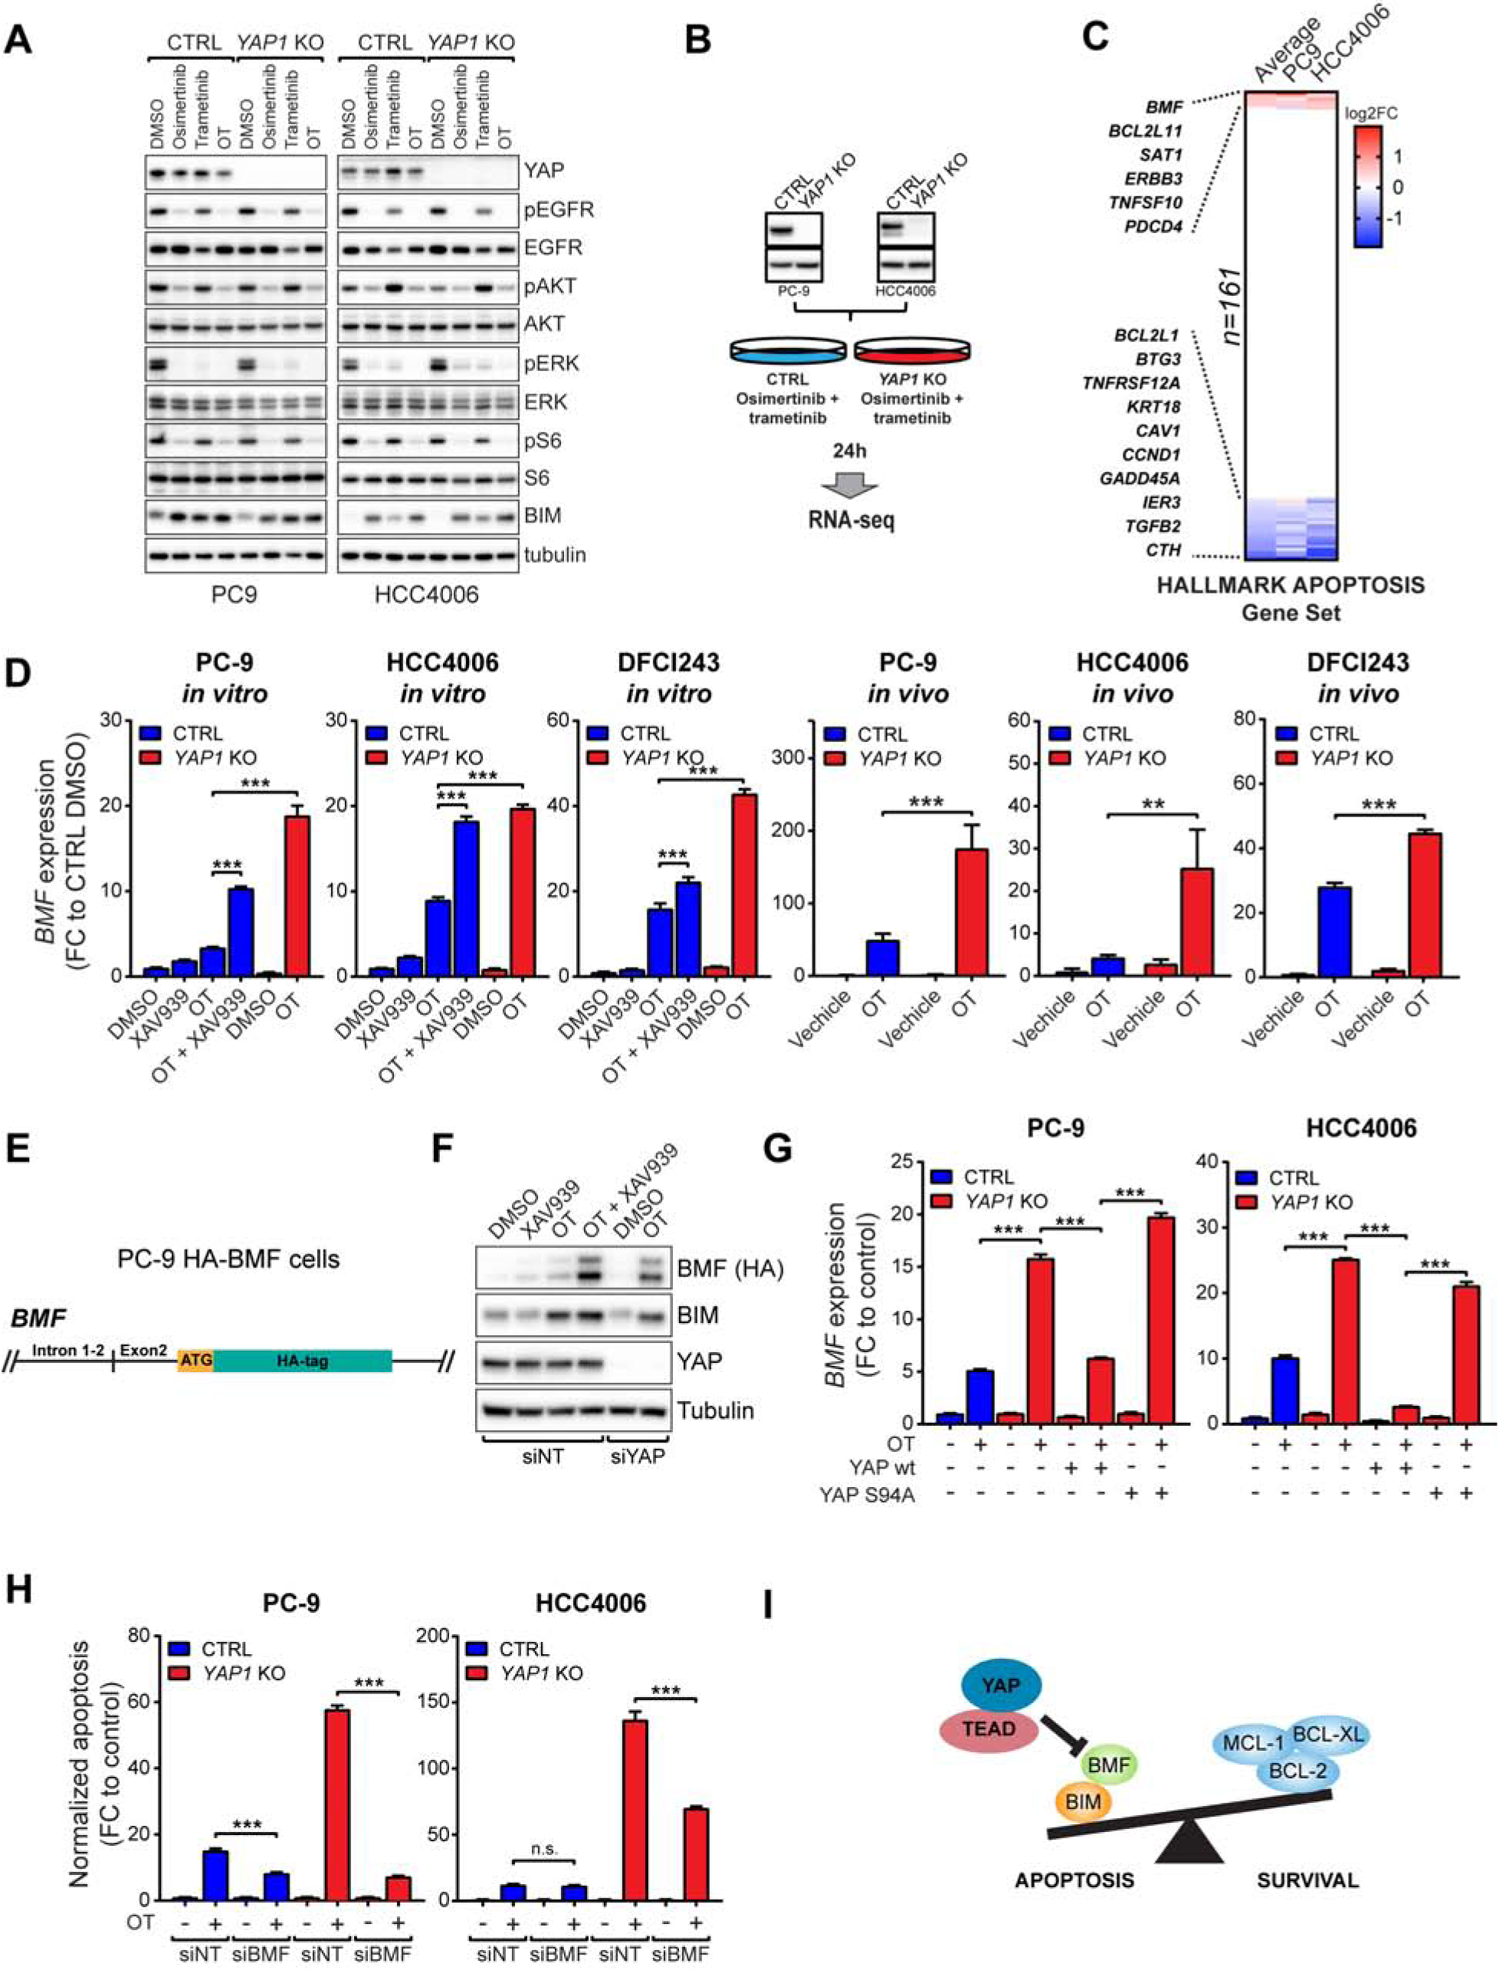
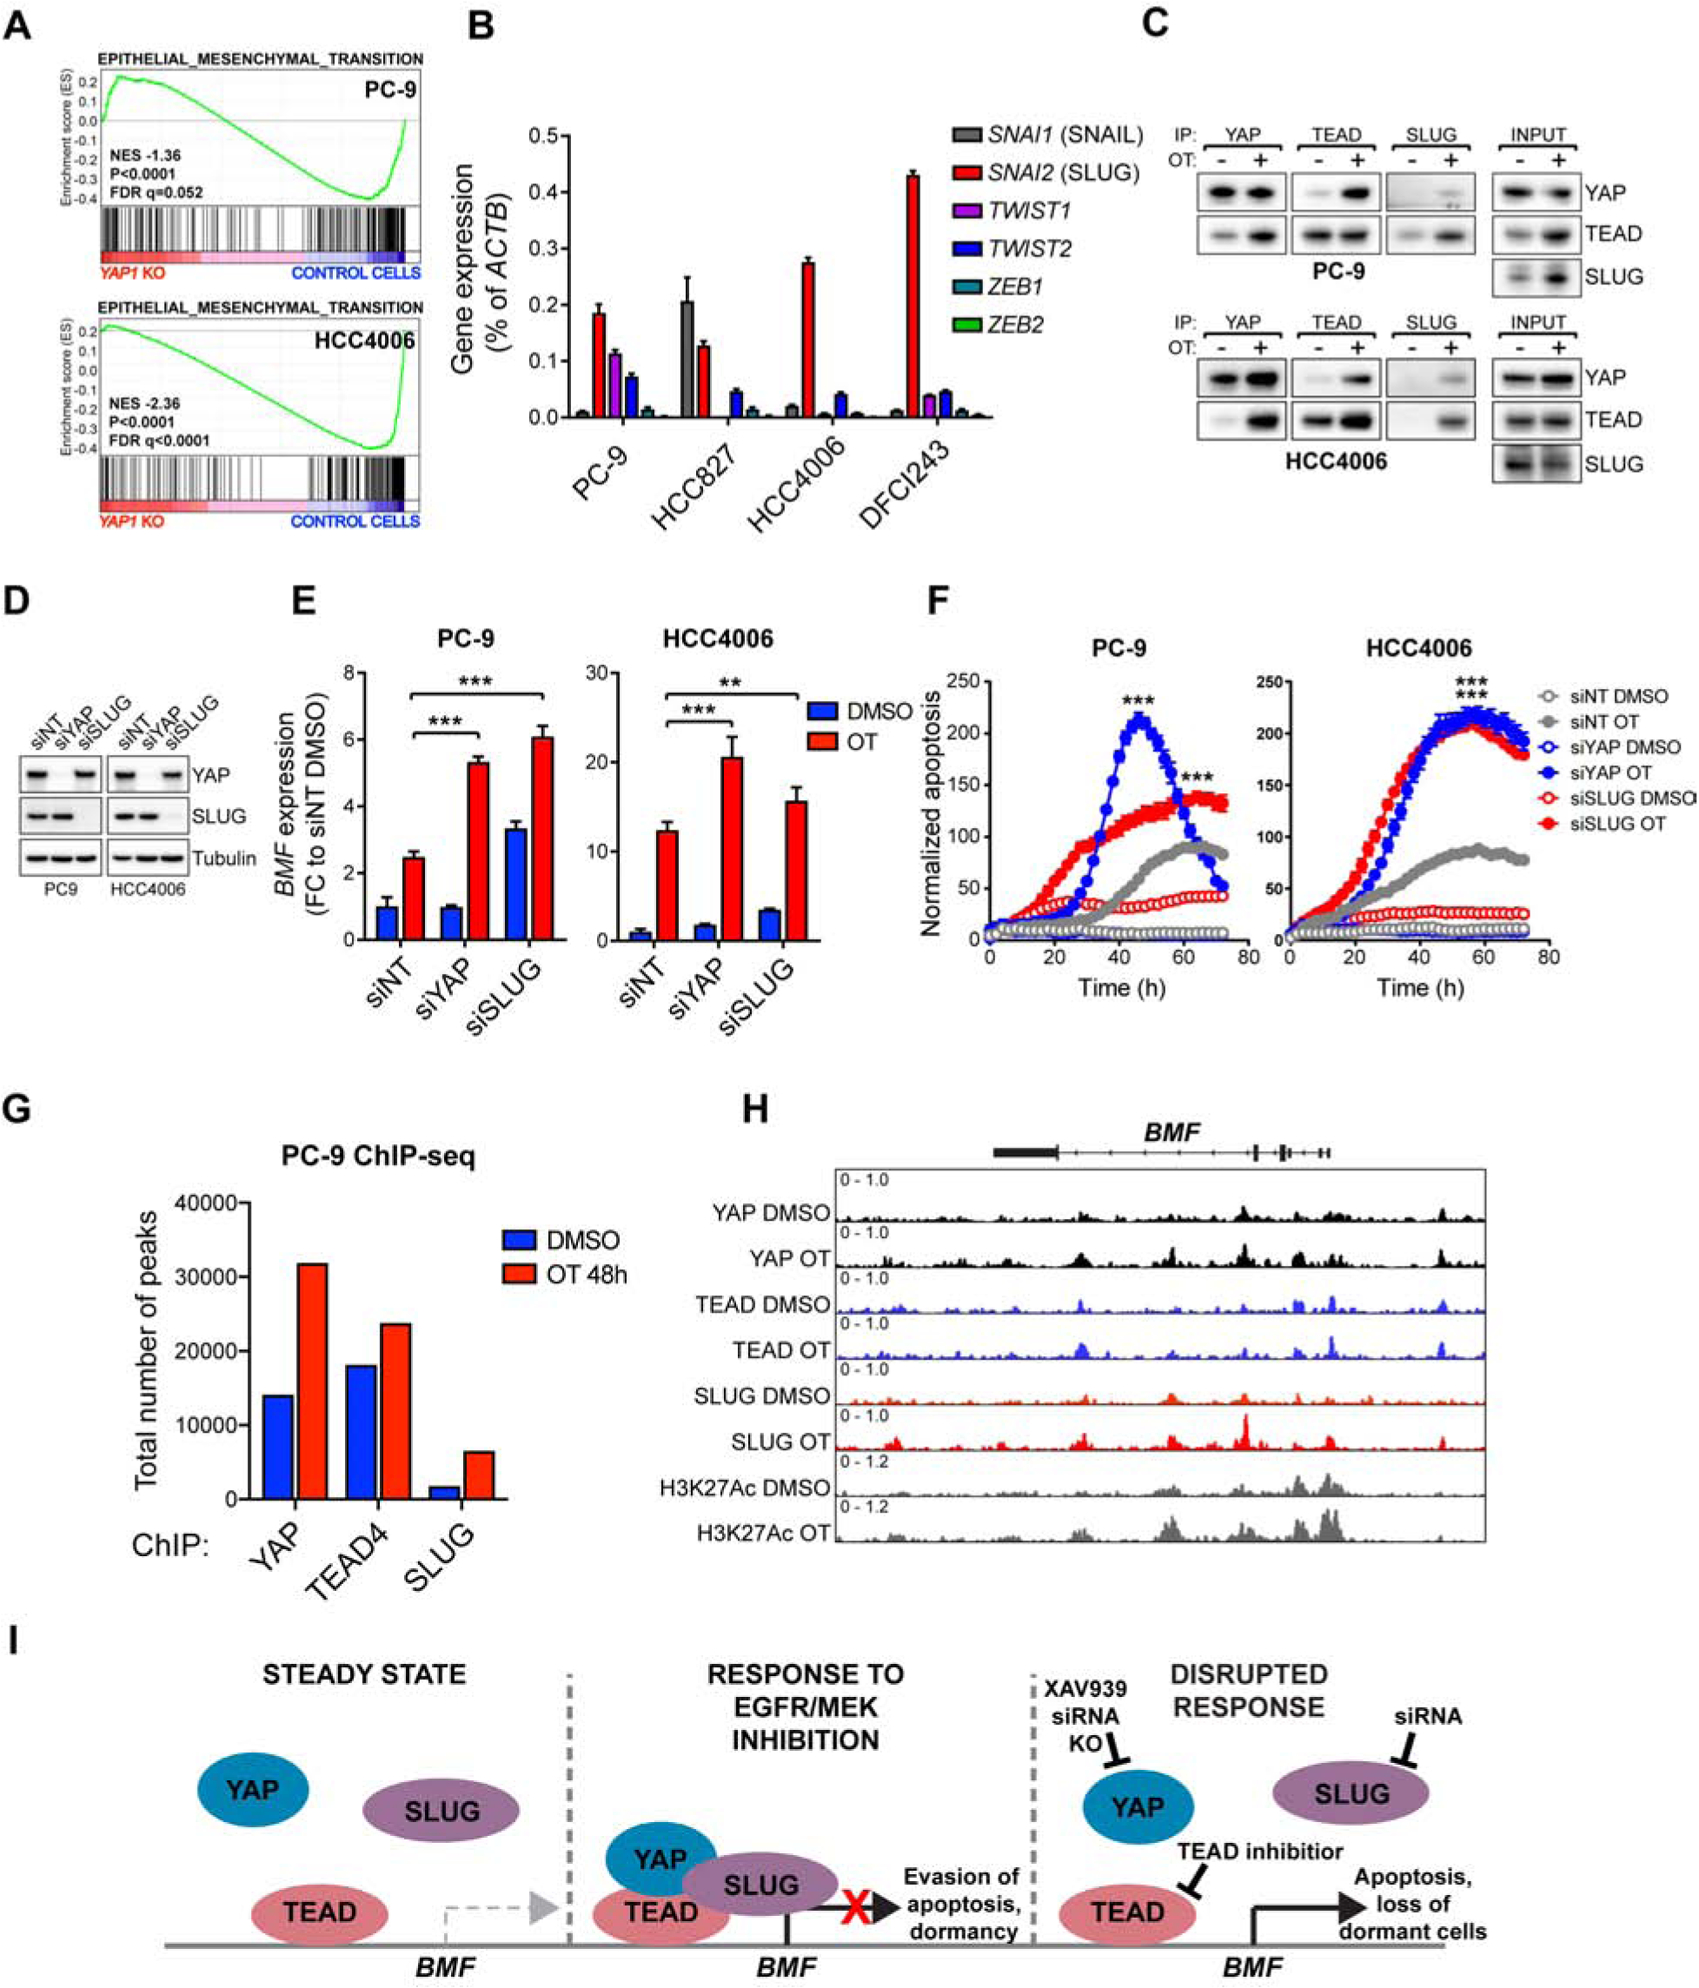
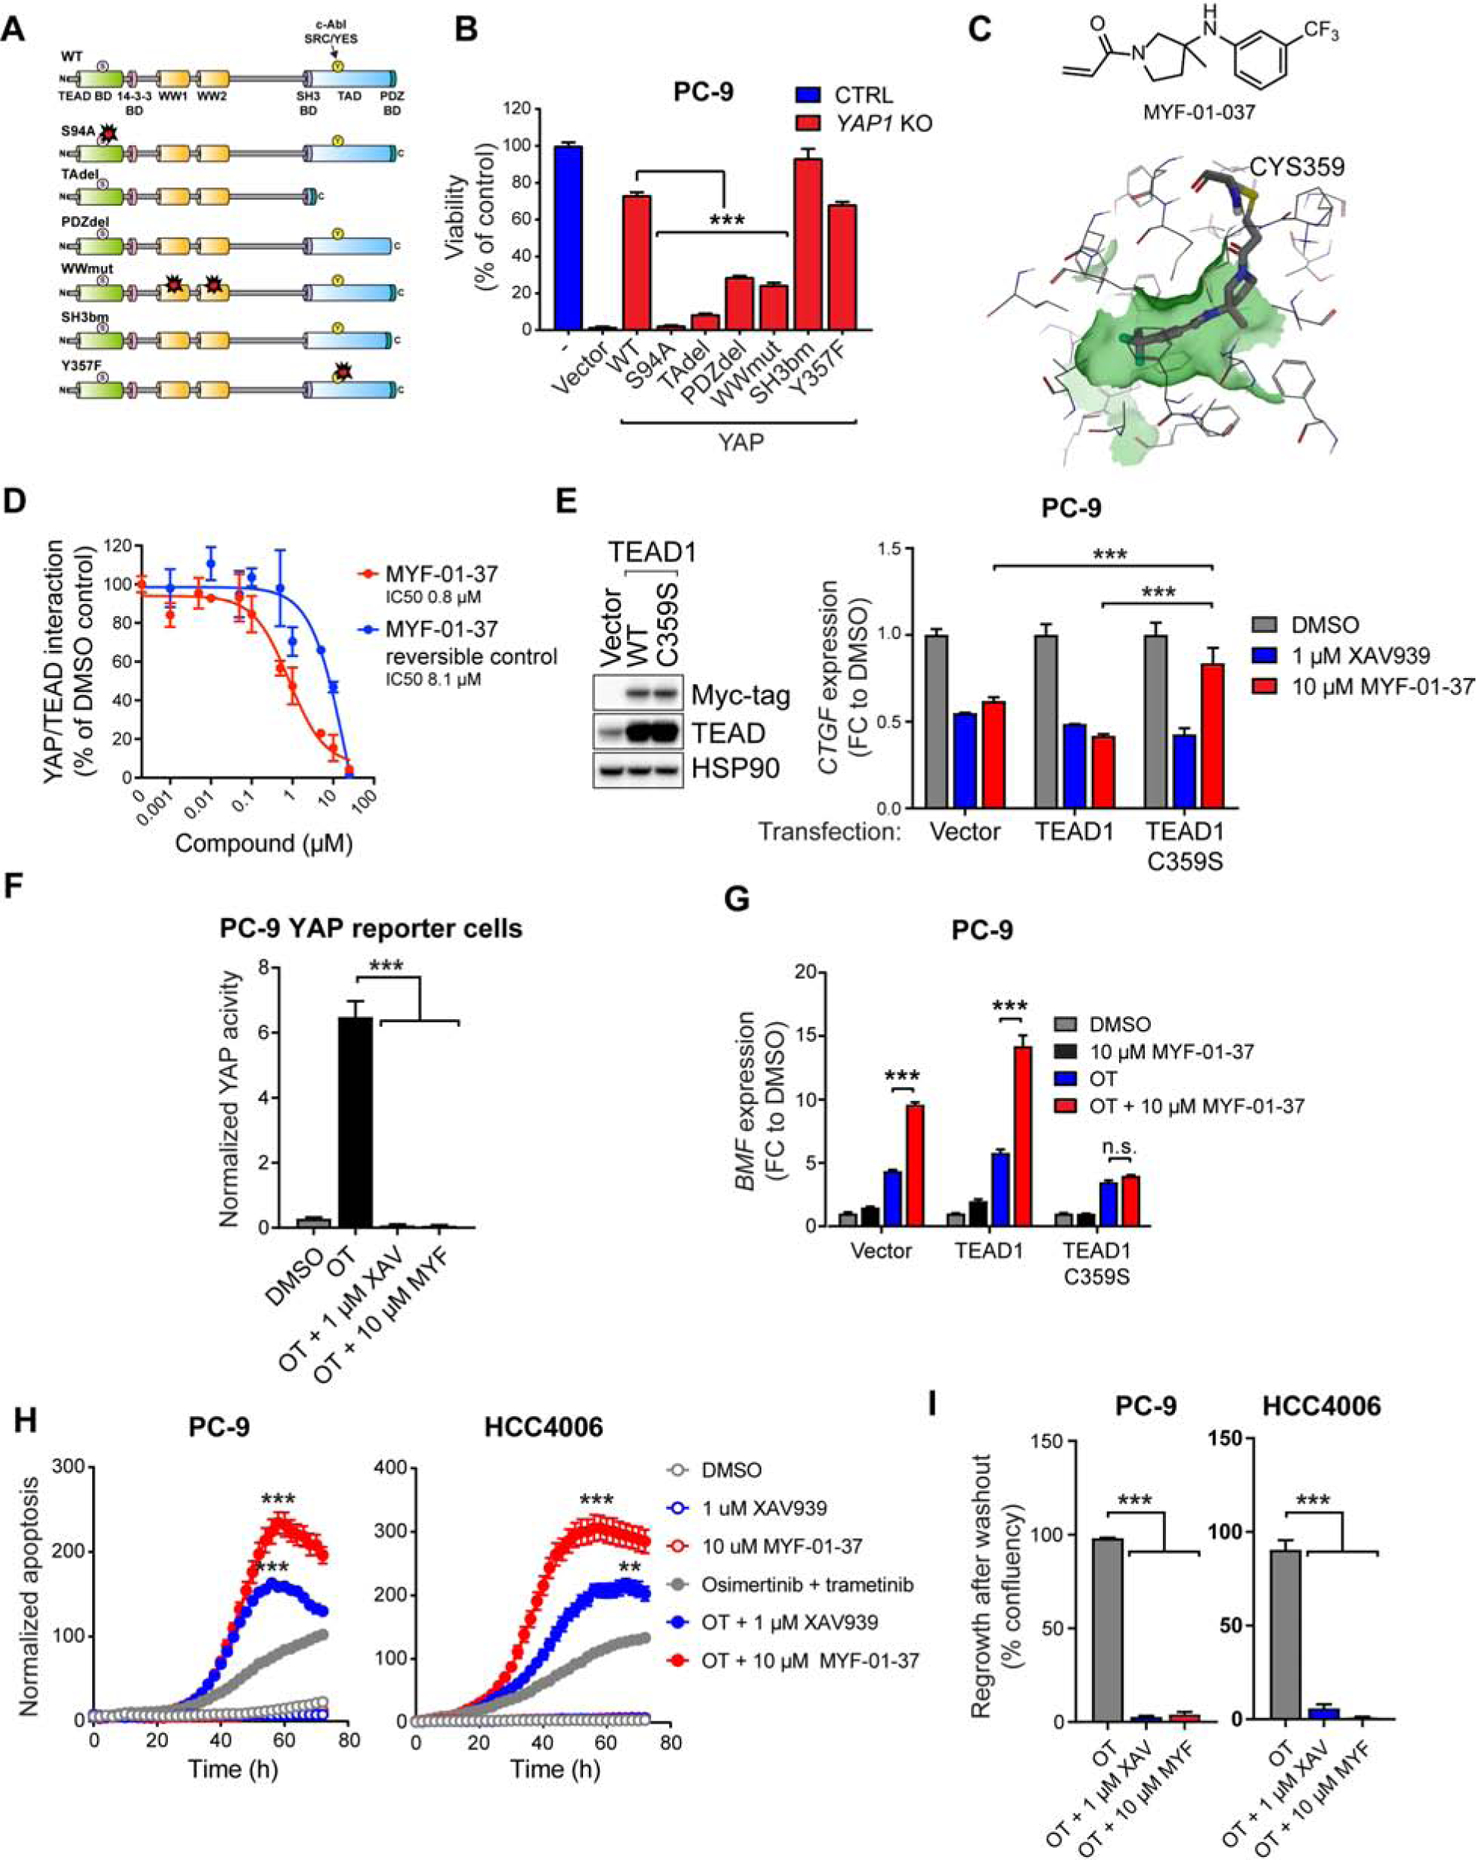
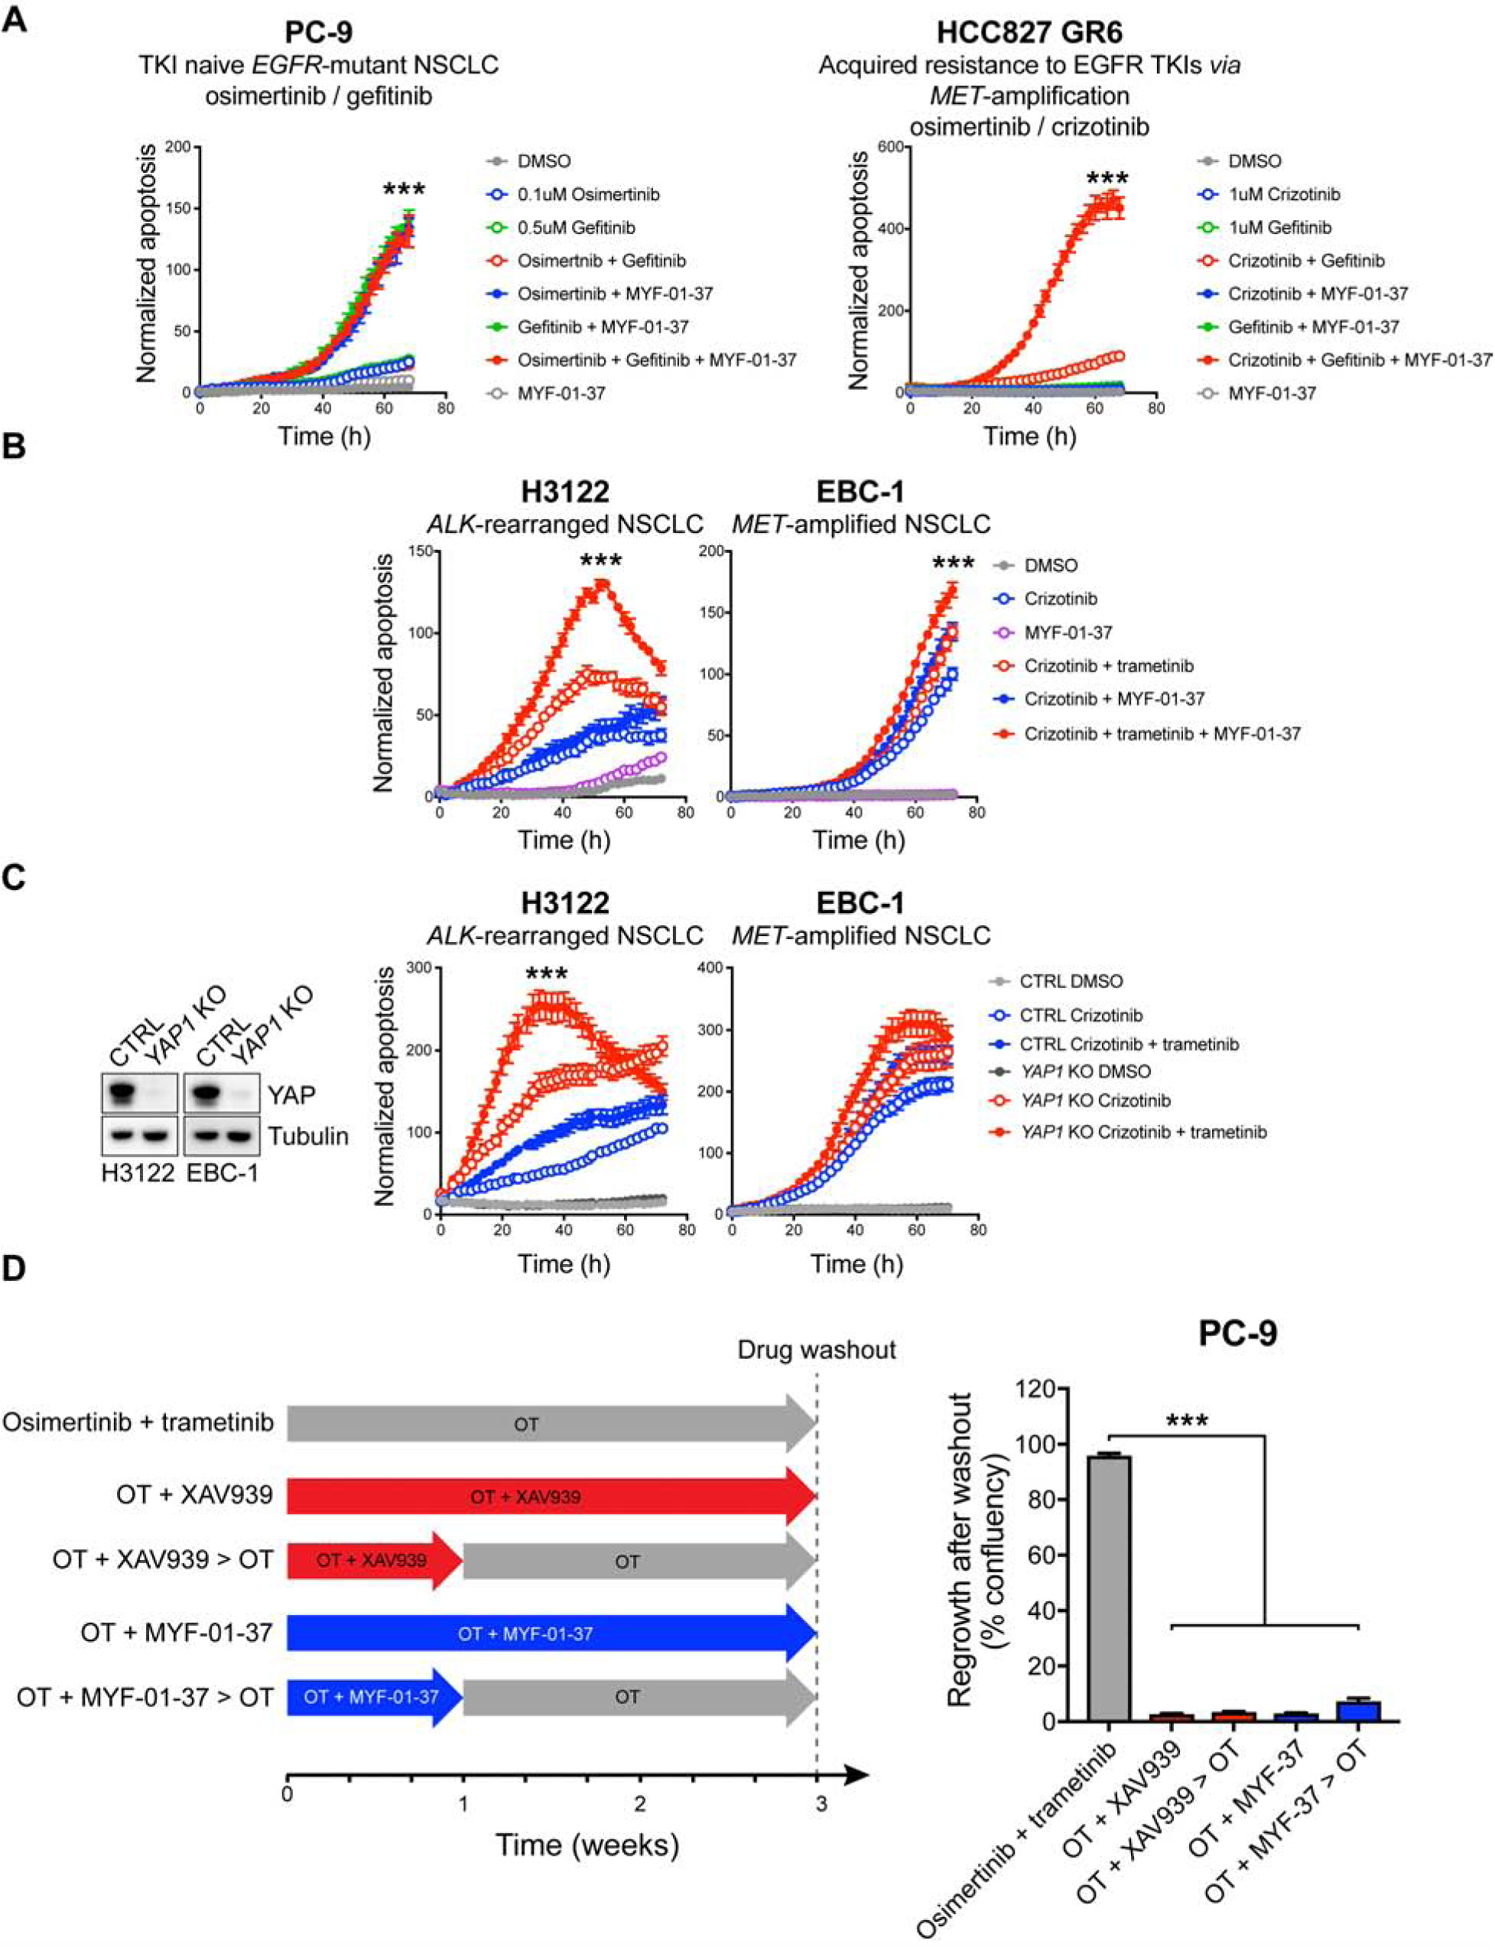
Eradicating tumor dormancy that develops following epidermal growth factor receptor (EGFR) tyrosine kinase inhibitor (TKI) treatment of EGFR-mutant non-small cell lung cancer, is an attractive therapeutic strategy but the mechanisms governing this process are poorly understood. Blockade of ERK1/2 reactivation following EGFR TKI treatment by combined EGFR/MEK inhibition uncovers cells that survive by entering a senescence-like dormant state characterized by high YAP/TEAD activity. YAP/TEAD engage the epithelial-to-mesenchymal transition transcription factor SLUG to directly repress pro-apoptotic BMF, limiting drug-induced apoptosis. Pharmacological co-inhibition of YAP and TEAD, or genetic deletion of YAP1, all deplete dormant cells by enhancing EGFR/MEK inhibition-induced apoptosis. Enhancing the initial efficacy of targeted therapies could ultimately lead to prolonged treatment responses in cancer patients.

Keywords: YAP; dormancy; drug resistance; drug tolerance; epidermal growth factor receptor; lung cancer; senescence.


Conflict of interest statement

Declaration of interests: PAJ has received consulting fees from AstraZeneca, Boehringer-Ingelheim, Pfizer, Roche/Genentech, Merrimack Pharmaceuticals, Chugai Pharmaceuticals, Ariad Pharmaceuticals, Eli Lilly and Company, Araxes Pharama, Ignyta, Novartis, Mirati Therapeutics, Takeda Oncology, Daiichi Sankyo, Biocartis, Voronoi, SFJ Pharmaceuticals and LOXO Oncology; receives post-marketing royalties from DFCI owned intellectual property on EGFR mutations licensed to Lab Corp; has sponsored research agreements with AstraZeneca, Daichi Sankyo, Boehringer Ingelheim, PUMA, Eli Lilly, Astellas Pharmaceuticals and Takeda Oncology; and has stock ownership in Gatekeeper Pharmaceuticals and LOXO Oncology. NSG is a founder, science advisory board member (SAB) and equity holder in Gatekeeper, Syros, Petra, C4, B2S and Soltego. The Gray lab receives or has received research funding from Novartis, Takeda, Astellas, Taiho, Janssen, Kinogen, Voronoi, Her2llc, Deerfield and Sanofi. R.H. has received research grants from Bristol-Myers-Squibb and Novartis. KKW is a founder and equity holder of G1 Therapeutics and he has Consulting/Sponsored Research Agreements with AstraZeneca, Janssen, Pfizer, Array, Novartis, Merck, Takeda, Ono, Targimmune and BMS. CPP has received honoraria from Bio-Rad and AstraZeneca, is a co-founder of Xsphera Biosciences, and is on the scientific advisory board of DropWorks and XSphera Biosciences. PB receives grant funding from Novartis Institute of Biomedical Research for an unrelated project. JAM serves on the SAB of 908 Devices.

Figures

Figure 1.
Figure 1.. Combined EGFR/MEK inhibition promotes a senescence-like dormant state.
(A) Proliferation of PC-9 cells treated with DMSO, 100 nM osimertinib (O) alone or in combination with 30 nM trametinib (T). (B) Images of control cells (at 1 week) or dormant PC-9 cells (at 15 weeks). Scale bar, 200 μm. (C) Cells were treated as in (A) for 6 weeks followed by drug washout. D) Western blot analysis of EGFR downstream signaling following treatment with OT for indicated times or 21 days followed by drug washout (rebound). E) Fraction of barcodes shared among replicates following indicated treatments in barcoded PC-9 cells F) Relative abundance of individual barcodes. Shared and unique indicate barcodes shared by >2 or ≤2 replicates, respectively. (G) GSEA of Hallmark gene sets comparing dormant cells vs. DMSO-treated control cells. Normalized Enrichment Scores (NES) for gene sets with FDR<0.1 in at least two cell lines are shown. (H) Senescence-associated β-galactosidase (SA-β-gal) staining of cells treated as indicated for 10 days. Scale bar, 100 μm. (I) Quantification of (H). (J) GSEA of senescence signature comparing dormant, OT-treated PC-9 cells vs. control cells. (K) Immunofluorescence (IF) staining for H3K9Me3 in control cells or dormant cells treated with OT for 10 days. Scale bar, 20 μm. Mean ± SEM are shown in all plots except (I) where mean ± SD are shown. ANOVA (I) or t-test (K) were used for statistical analyses. ***, P<0.001; **, P<0.01. See also Figure S1, S2, and S3.
Figure 2.
Figure 2.. The establishment of dormancy following EGFR/MEK inhibition is critically dependent on activation of YAP/TEAD.
A) Principal component analysis of ATAC-seq data from cells treated as indicated for two weeks. B) ATAC-seq signal intensities centered on up-regulated (UP) or down-regulated (DOWN) peaks in dormant, OT-treated cells vs. control cells. C) Analysis for enriched transcription factor motifs D) GSEA of YAP/TEAD signature (Zhang et al., 2009) E) Left: ATAC-seq signal intensities centered on upregulated (UP) or down-regulated (DOWN) peaks in OT-treated vs. O-treated cells. Right: Analysis for transcription factor motifs enriched in upregulated peaks. F) QPCR analysis of YAP target gene expression. G) Regrowth of EGFR-mutant NSCLC cells after washout following a 3-week treatment with the indicated drug combinations. H) Western blot analysis of YAP protein levels in YAP1 knock-out (KO) and control (CTRL) cells. I) Proliferation of cells in (H) treated as indicated for 21 days, followed by drug washout. J) Mice bearing CTRL or YAP1 KO cell xenograft tumors were treated with vehicle or OT followed by treatment cessation and follow-up. Data from 6/8 live mice per group are plotted. Right: tumor volumes at time of regrowth, indicated by an arrow. Mean ± SEM are shown in all plots except (F), where mean ± SD are shown. ANOVA was used for statistical analyses in all but (J), where t-test was used. ***, P<0.001; *, P<0.05. See also Figure S4.
Figure 3.
Figure 3.. YAP activation is necessary for cancer cell viability upon combined EGFR/MEK inhibition.
A) YAP activity following indicated treatments in PC-9 cells transduced with a fluorescent YAP/Hippo pathway reporter (PC-9 YAP reporter cells). B) IF staining for YAP nuclear localization following the indicated treatments. C) YAP activity and apoptosis in PC-9 YAP reporter cells treated with OT. D) Analysis of overlap between YAPhigh cells (red) and apoptotic cells (green) after 80h of treatment in PC-9 YAP reporter cells. E) Apoptosis in PC-9 cells treated with the indicated drugs or drug combinations. F) Apoptosis in EGFR-mutant NSCLC cells treated as indicated. Peak apoptosis values over 72h are shown. G) Apoptosis in YAP1 knock-out (KO) or control (CTRL) cells treated as indicated. H) Left: Western blot analysis of YAP protein levels in YAP1 KO cells transduced with wild-type YAP1. Right: cells were treated with OT and analyzed as in (G). Only data from drug-treated cells is shown. I) Proportions of YAPhigh cells in PC-9 YAP reporter cell populations treated as indicated. J) Different means for EGFR-mutant NSCLC cells to avoid apoptosis following EGFR inhibition. Mean ± SEM are shown in all plots except (I), where SD is shown. ANOVA was used for statistical analyses in all but (D), where Fisher’s exact test was used. ***, P<0.001. See also Figure S5.
Figure 4.
Figure 4.. YAP-high, senescence-like dormant state also occurs in vivo.
A) Growth curves of PC-9 xenograft tumors harvested for single-cell RNA-sequencing (scRNA-seq) and immunohistochemistry (IHC). B) FACS sorting scheme used to obtain scRNA-seq samples from the dissociated xenograft tumors. C) YAP, EMT and senescence signature enrichments in single cells from the xenograft tumors. D and E) IHC staining for YAP in the xenograft tumors (E) or in residual tumors from EGFRL858/T790M mice following 2-week treatment with vehicle or O. F) Quantification of (D) and (F). G) Quantification of infiltrating T-cells in the same tumors as in (E) based in CD4/CD8 IHC. H-I) IHC staining for YAP and pERK in WZ4002- or WZ4002/ T-resistant tumors from EGFRL858/T790M mice (H) or in a residual tumor of an EGFR-mutant NSCLC patient following treatment with O/selumetinib for 11 months (I). Kolmogorov-Smirnov Test (C), ANOVA (F when more than two groups, H) or t-test (F when two groups, G, I) were used for statistical analyses. ***, P<0.001; **, P<0.01; n.s., not significant. See also Figure S6.
Figure 5.
Figure 5.. YAP mediates the evasion of apoptosis by repressing the induction of pro-apoptotic BMF.
A) Western blot analysis of EGFR downstream signaling following 24h treatment as indicated. B) RNA-seq samples used in (C). C) Expression of genes regulating apoptosis in OT-treated YAP1 KO cells vs OT-treated CTRL cells. Colors indicate log2 fold change values with p<0.001. D) QPCR analysis of BMF expression in CTRL or YAP1 KO cells treated as indicated for 24h in vitro or 3 days in vivo. E) Schematic representation of the endogenous BMF locus in PC-9 HA-BMF cells. F) Western blot analysis of BMF, BIM, and YAP expression in PC-9 HA-BMF cells transfected with non-targeting (NT) or YAP siRNA and treated as indicated for 24h. G) QPCR analysis of BMF expression in CTRL or YAP1 KO cells transduced as indicated, and following treatment with either DMSO or OT for 24h. H) Peak apoptosis over 72h treatment in PC-9 and HCC4006 cells transfected with NT or BMF siRNA. I) The mechanism of YAP/TEAD-mediated suppression of apoptosis in EGFR-mutant NSCLC cells following EGFR/MEK inhibition. Mean ± SD are shown in all plots except (H), where mean ± SEM is shown. ANOVA was used for statistical analyses. ***, P<0.001; **, P<0.01; n.s., not significant (P>0.05). See also Figure S7.
Figure 6.
Figure 6.. YAP represses BMF induction by engaging EMT transcription factor SLUG.
A) GSEA of EMT signature in YAP1 knock-out (KO) vs control cells treated with OT for 24 hours. B) QPCR analysis of EMT transcription factor expression in untreated EGFR-mutant NSCLC cells. C) Co-immunoprecipitation analysis of the interaction between YAP, TEAD, and SLUG in PC-9 cells following treatment with DMSO or OT for 48h. D) Western blot analysis of YAP and SLUG protein levels in PC-9 or HCC4006 cells transfected with non-targeting (NT), YAP or SLUG siRNA. E) QPCR analysis of BMF expression in cells in (D) following 24h treatment with DMSO or OT. F) Apoptosis in cells in (D) following treatment with DMSO or OT. G) Number of peaks called by MACS2 (FDR<0.01). H) ChIP-seq signal traces in BMF locus. H3K27Ac was used to identify enhancer regions. I) The mechanism by which YAP/TEAD/SLUG complex represses BMF expression upon combined EGFR/MEK inhibition. Mean ± SD (E), or mean ± SEM (F) are shown. ANOVA was used for statistical analyses. ***, P<0.001; **, P<0.01.
Figure 7
Figure 7. Development of novel covalent TEAD inhibitor to target YAP dependency upon combined EGFR/MEK inhibition.
A) YAP1 mutants used in the rescue experiment in (B). B) Viability (Cell Titer Glo) of CTRL cells or PC-9 YAP1 KO cells transduced with YAP1 mutants (A) following 72h treatment with OT. C) Top: the structure of MYF-01–37. Bottom: MYF-01–37 binding to the palmitoylation pocket in TEAD1 based on molecular docking. The cysteine 359 targeted by MYF-01–37 is indicated. D) Effect of MYF-01–37 or the corresponding reversible control on YAP/TEAD interaction measured using Split Gaussia Luciferase Assay. E) Left: Western bot analysis of the expression of myc-tagged TEAD1 in PC-9 cells transduced as indicated. Right: QPCR analysis of CTGF expression after 24h treatment with XAV939 or MYF-01–37 in the transduced PC-9 cells. F) YAP activity in PC-9 YAP reporter cells after 72h treatment with OT or OT in combination with XAV939 (XAV) or MYF-01–37 (MYF). G) QPCR analysis of BMF expression in cells in (E) following 24h treatment as indicated. H) Apoptosis in PC-9 and HCC4006 cells treated as indicated. G) Regrowth of PC-9 and HCC4006 cells after drug washout following a two-week treatment as indicated. Mean ± SEM are shown in all plots except (E), where mean ± SD is shown. ANOVA was used for statistical analyses. ***, P<0.001; **, P<0.01. See also Figure S8.
Figure 8.
Figure 8.. Co-targeting YAP/TEAD with genotype directed therapy.
A–B) Apoptosis in NSCLC cell lines treated as indicated. C) Left: Western blot analysis of YAP expression in control (CTRL) and YAP1 KO H3122 and EBC-1 cells. Right: apoptosis in CTRL and YAP1 KO H3122 and EBC-1 cells treated as indicated. D) PC-9 cells were treated as indicated in the scheme on the left, followed by drug washout. Regrowth of cells was monitored and quantified as in Figure 2G. Mean ± SEM are shown. ANOVA was used for statistical analyses. ***, P<0.001.
Scheme 1:
Scheme 1:. Synthesis of MYF-1–37
aReagents and conditions: (a) Pd(OAc)2, XPhos, NaOtBu, toluene, 100 °C ; (b) HCl/dioxane, MeOH; (c) DIEA, MeCN, 0°C

Comment in

Similar articles

Cited by

References

    1. Aibar S, González-Blas CB, Moerman T, Huynh-Thu VA, Imrichova H, Hulselmans G, Rambow F, Marine JC, Geurts P, Aerts J, et al. (2017). SCENIC: Single-cell regulatory network inference and clustering. Nat. Methods 14, 1083–1086. - PMC - PubMed
    1. Alexander WM, Ficarro SB, Adelmant G, and Marto JA (2017). multiplierz v2.0: A Python-based ecosystem for shared access and analysis of native mass spectrometry data. Proteomics 17, 15–16. - PubMed
    1. Bahcall M, Sim T, Paweletz CP, Patel JD, Alden RS, Kuang Y, Sacher AG, Kim ND, Lydon CA, Awad MM, et al. (2016). Acquired METD1228Vmutation and resistance to MET inhibition in lung cancer. Cancer Discov. 6, 1334–1341. - PMC - PubMed
    1. Bankhead P, Loughrey MB, Fernández JA, Dombrowski Y, McArt DG, Dunne PD, McQuaid S, Gray RT, Murray LJ, Coleman HG, et al. (2017). QuPath: Open source software for digital pathology image analysis. Sci. Rep 7, 1–7. - PMC - PubMed
    1. Beyer TA, Weiss A, Khomchuk Y, Huang K, Ogunjimi AA, Varelas X, and Wrana JL (2013). Switch enhancers interpret TGF-β and hippo signaling to control cell fate in human embryonic stem cells. Cell Rep. 5, 1611–1624. - PubMed

Publication types

MeSH terms