. 2020 Jan 13;37(1):85-103.e9.
doi: 10.1016/j.ccell.2019.12.003.

Myosin II Reactivation and Cytoskeletal Remodeling as a Hallmark and a Vulnerability in Melanoma Therapy Resistance

Affiliations

Myosin II Reactivation and Cytoskeletal Remodeling as a Hallmark and a Vulnerability in Melanoma Therapy Resistance

Jose L Orgaz et al. Cancer Cell. .

Abstract

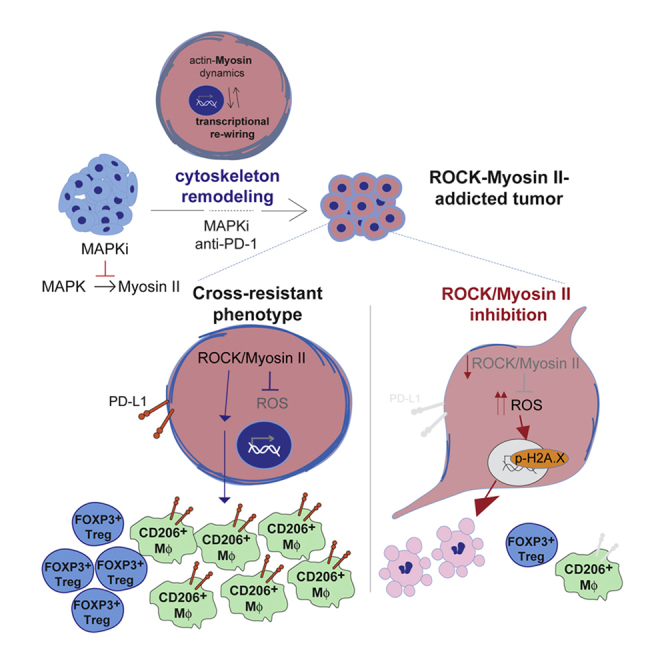
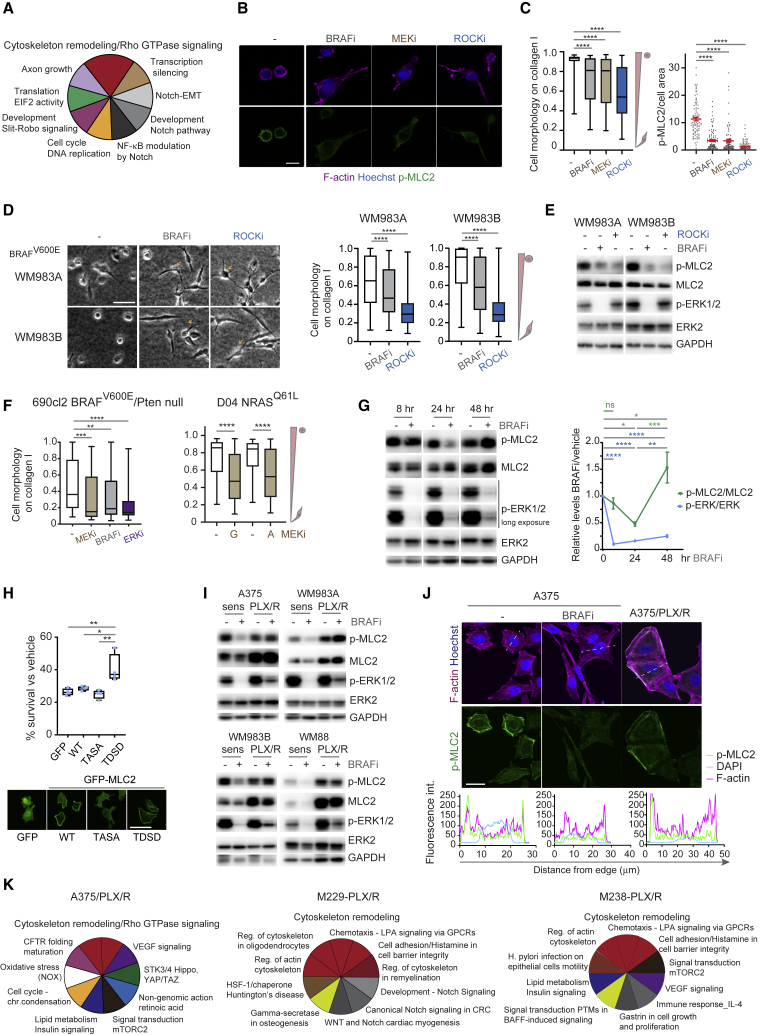
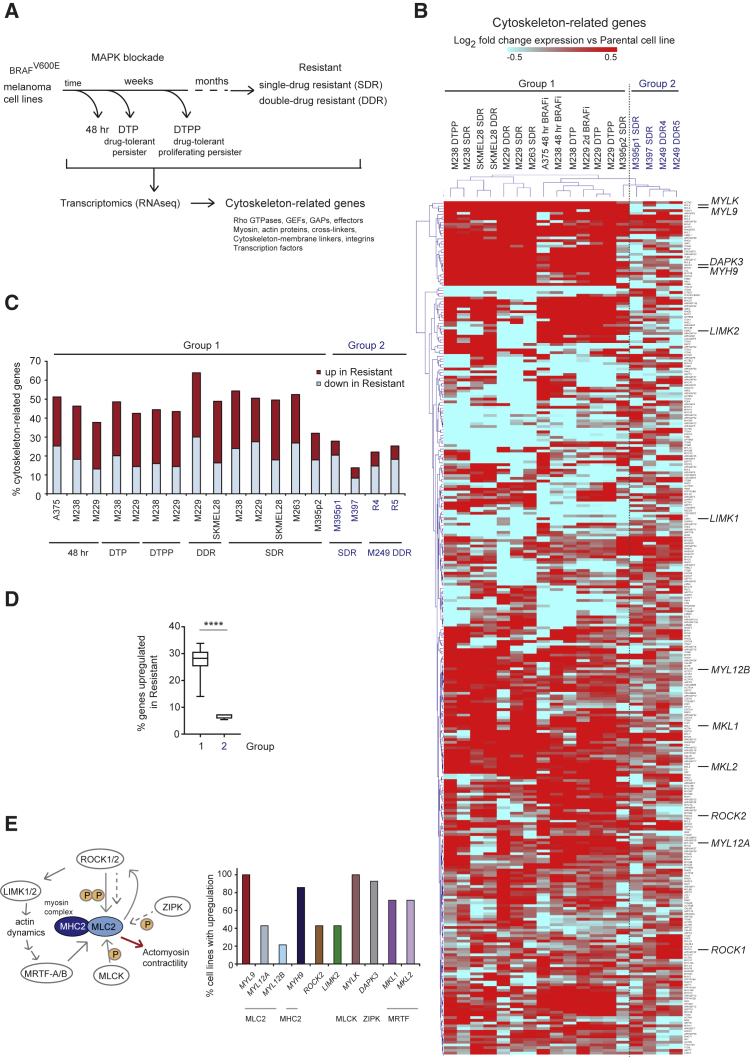
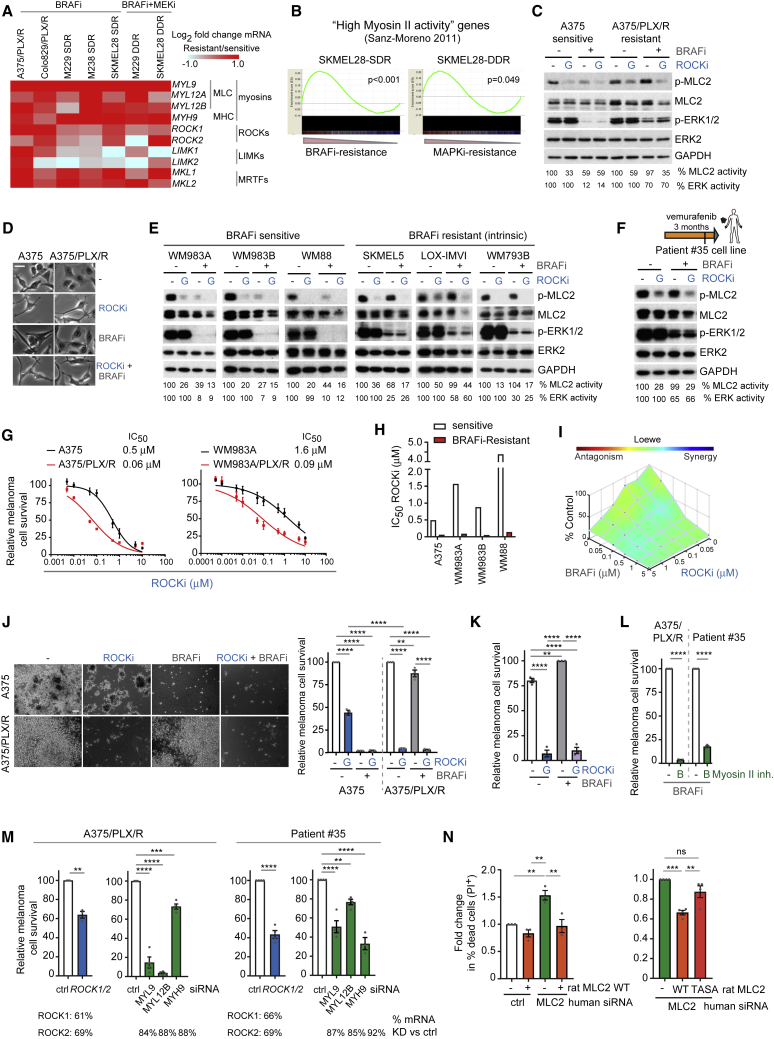
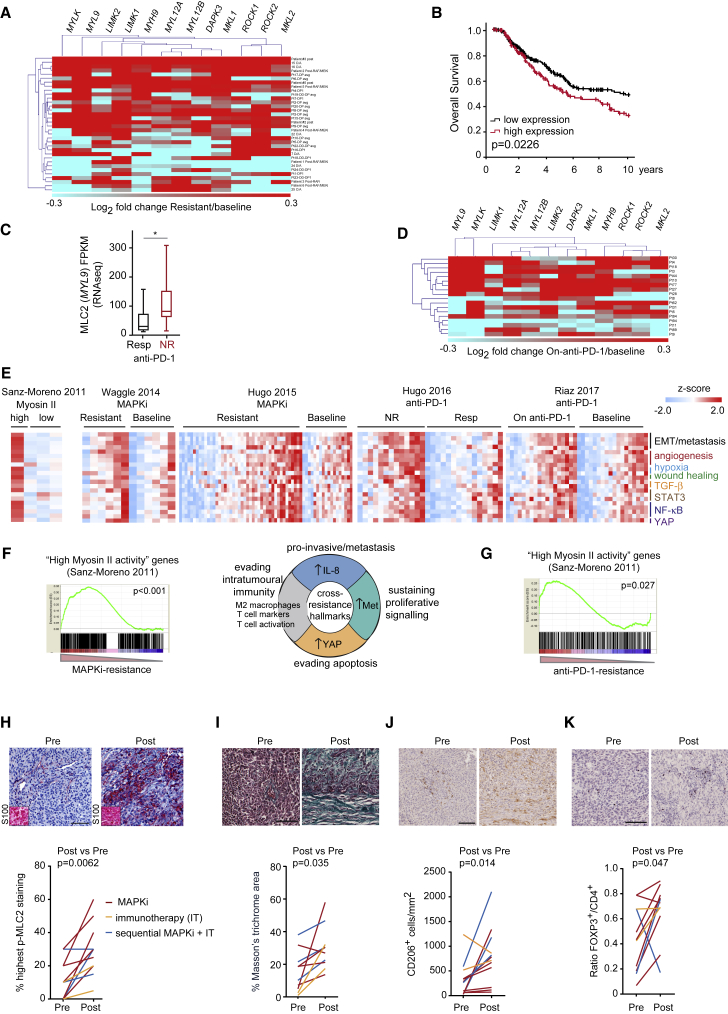
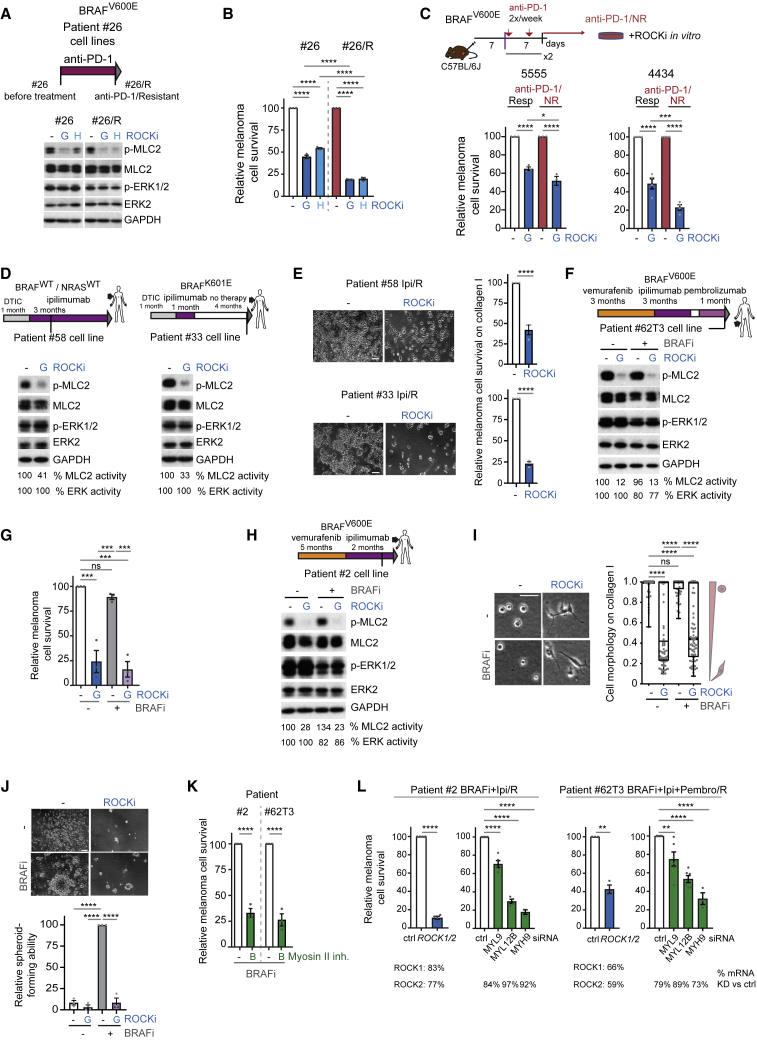
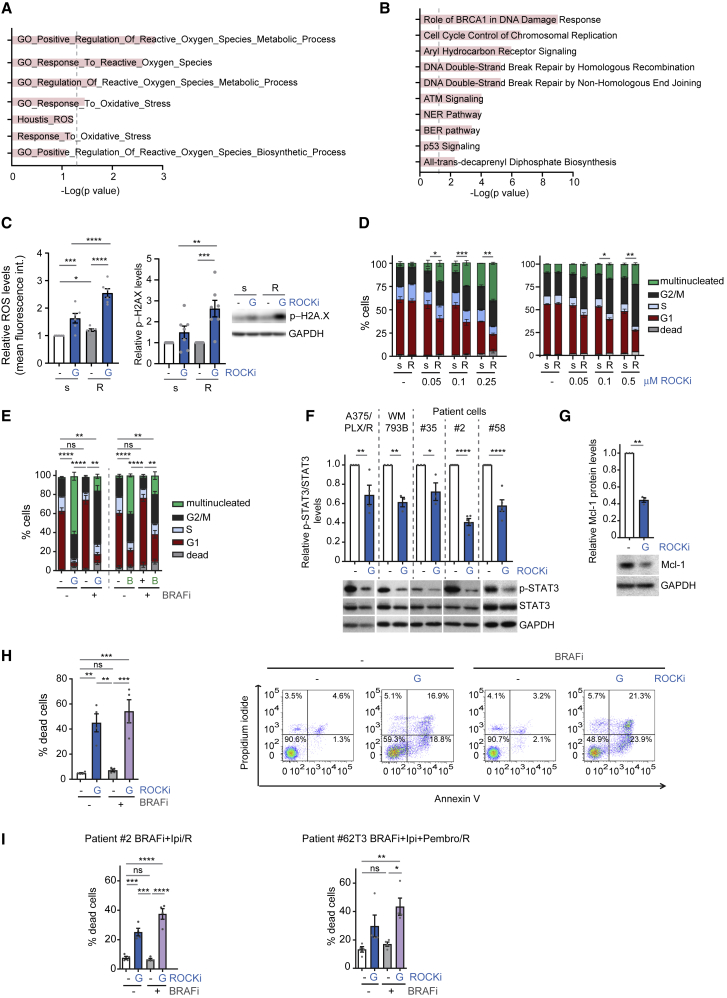
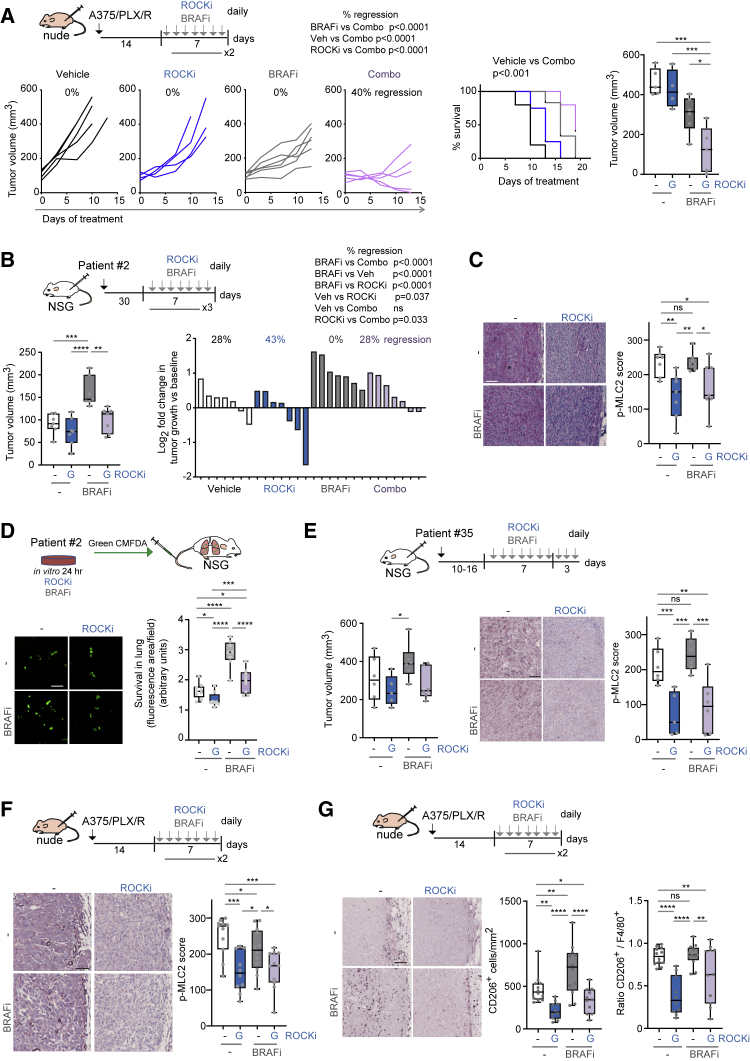
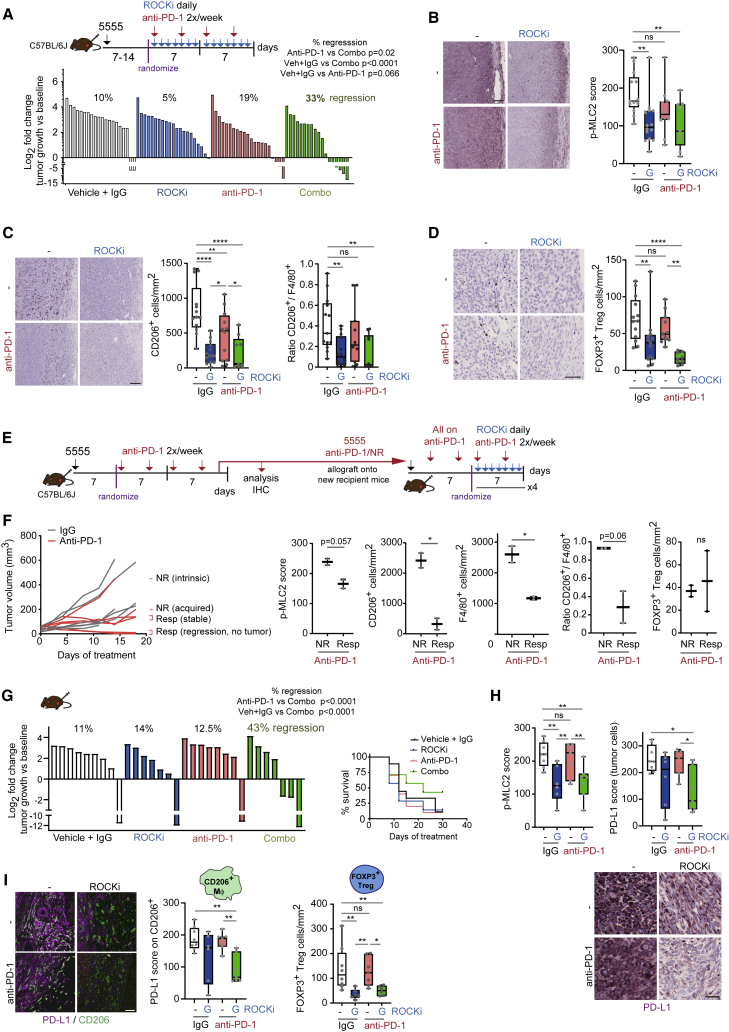
Despite substantial clinical benefit of targeted and immune checkpoint blockade-based therapies in melanoma, resistance inevitably develops. We show cytoskeletal remodeling and changes in expression and activity of ROCK-myosin II pathway during acquisition of resistance to MAPK inhibitors. MAPK regulates myosin II activity, but after initial therapy response, drug-resistant clones restore myosin II activity to increase survival. High ROCK-myosin II activity correlates with aggressiveness, identifying targeted therapy- and immunotherapy-resistant melanomas. Survival of resistant cells is myosin II dependent, regardless of the therapy. ROCK-myosin II ablation specifically kills resistant cells via intrinsic lethal reactive oxygen species and unresolved DNA damage and limits extrinsic myeloid and lymphoid immunosuppression. Efficacy of targeted therapies and immunotherapies can be improved by combination with ROCK inhibitors.

Keywords: MAPK; Rho-kinase; cytoskeletal remodeling; immunotherapy; melanoma therapy resistance; myosin II; phosphoproteomics and transcriptomics; regulatory T cells; transcriptional rewiring; tumor-promoting macrophages.


Conflict of interest statement

The authors declare no competing interests.

Figures

None
Graphical abstract
Figure 1
Figure 1
MAPK Regulates Myosin II Activity in Melanoma (A) The 10 most enriched pathways in A375 cells after MEKi treatment compared with untreated cells from phospho-proteome data. (B) p-MLC2 and F-actin confocal images of A375M2 cells on collagen I after treatment (BRAFi PLX4720, MEKi trametinib, ROCKi GSK269962A). Scale bar, 25 μm. (C) Quantification of cell morphology and p-MLC2 by immunofluorescence from (B). Left, boxplot (n > 200 cells pooled from 3 experiments); right, mean ± SEM (n = 90 cells [dots] pooled from 3 experiments). (D) Images and quantification of cell morphology on collagen I after treatment (BRAFi PLX4720, ROCKi GSK269962A) (n > 346 cells pooled from 2 experiments). Arrows show collapsed phenotype. Scale bar, 100 μm. (E) p-MLC2 and p-ERK1/2 immunoblots from (D). (F) Cell morphology on collagen I after treatment (690cl2, MEKi PD184352, BRAFi PLX4032, ERKi SCH772984, n = 50 cells; D04, MEKi GSK1120212, AZD6244, n = 125–150 cells). (G) p-MLC2 and p-ERK1/2 levels after PLX4720 treatment (n = 5, mean ± SEM). (H) Survival of A375 cells stably overexpressing wild type (WT), constitutively inactive TASA, or constitutively active TDSD MLC2 a after 5-day treatment with 0.1 μM PLX4720 (n = 4). Confocal images of GFP-MLC2. Scale bar, 50 μm. (I) p-MLC2 and p-ERK1/2 immunoblots after PLX4720 treatment. (J) p-MLC2 and F-actin confocal images (BRAFi PLX4720). Scale bar, 25 μm. Representative fluorescence intensity line scans (dashed lines in image) below. (K) The 10 most enriched pathways in BRAFi-resistant A375/PLX/R (Girotti et al., 2013), M229-PLX/R, and M238-PLX/R cells (Titz et al., 2016) compared with parental cell lines from phospho-proteome data. (A–F, I, and J) 24 h treatment. (C, D, F, and H) Boxplots show median (center line); interquartile range (box); min-max (whiskers). p values by Kruskal-Wallis with Dunn's correction (C, D, and F), one-way ANOVA with Tukey's (H) or Benjamini, Krieger, and Yekutieli correction (G), p < 0.05, ∗∗p < 0.01, ∗∗∗∗p < 0.0001. See also Figure S1 and Tables S1 and S2.
Figure 2
Figure 2
ROCK-Myosin II Pathway Is Transcriptionally Rewired during Development of Resistance (A) Cell lines used for gene expression (Obenauf et al., 2015, Song et al., 2017). (B) Heatmap of unsupervised hierarchical clustering of 313 cytoskeleton-related genes in A375 48 h BRAFi (Obenauf et al., 2015); M229-, M238-, SKMEL28-, M395p2-, M395p1-, and M249-derivatives (Song et al., 2017). Fold change expression in resistant versus parental lines is shown. (C) Percentage of upregulated/downregulated (1.5-fold) cytoskeleton-genes versus parental line. (D) Percentage of upregulated genes. Boxplot: median (center line); interquartile range (box); min-max (whiskers). p value by unpaired t test with Welch's correction, ∗∗∗∗p < 0.0001. (E) Left, schematic pathway. Right, percentage of group 1 cell lines with upregulation of indicated genes. See also Table S3.
Figure 3
Figure 3
Survival of Targeted Therapy-Resistant Melanomas Is Dependent on ROCK-Driven Myosin II Activity (A) Fold change in mRNA levels of ROCK-myosin II pathway genes in A375/PLX/R, Colo829/PLX/R by qRT-PCR (n = 3); and from published RNA sequencing data (Song et al., 2017). (B) GSEA comparing high myosin II activity signature (Sanz-Moreno et al., 2011) to resistant cell lines (Song et al., 2017). Nominal p values shown, false discovery rate (FDR) < 0.2. (C) p-MLC2 and p-ERK1/2 immunoblots after 24 h treatment. (D) Images of cells from (C). Scale bar, 50 μm. (E and F) p-MLC2 and p-ERK1/2 immunoblots of sensitive and intrinsically resistant cells (E); and patient no. 35 cells (F) after 24 h treatment (8 h for WM88). Vertical line in diagram (F): cell line establishment. (G) Survival and half maximal inhibitory concentration (IC50) values after a 3-day treatment (n = 3). (H) IC50 values for GSK269962A. (I) Cell survival as synergy graph of A375 cells treated for 3 days (n = 4). (J) Images and quantification of cell survival on collagen I for 9 days (n = 3). Scale bar, 100 μm. (K) Survival of patient no. 35 cells after 10 days (n = 3). (L) Survival after a 5- to 10-day blebbistatin and PLX4720 treatment (n = 3). (M) Survival 8 days after gene depletion by RNAi (n = 3; n = 4 A375/PLX/R myosin genes, patient no. 35 MYL12B, ROCK1/2). mRNA KD (percentage decrease versus control) by RT-PCR shown. (N) Cell death in A375/PLX/R cells 3 days after transient MLC2 KD and rescue with rat MLC2 WT or TASA (n = 3, left graph; n = 4, right graph). (C–K) ROCKi GSK269962A, BRAFi PLX4720. Graphs show mean ± SEM and individual data points (circle). p values by one-way ANOVA with Tukey's (J, K, and N) or Dunnett's correction (M, myosin genes); t test with Welch's correction (L and M, ROCK), ∗∗p < 0.01, ∗∗∗p < 0.001, ∗∗∗∗p < 0.0001; n.s., not significant. See also Figures S2 and S3.
Figure 4
Figure 4
High Myosin II Levels Identify Therapy-Resistant Melanomas in Human Samples (A) Heatmap of fold change in expression of ROCK-myosin II pathway genes in MAPKi-resistant versus baseline patient samples from (Hugo et al., 2015, Kwong et al., 2015, Sun et al., 2014, Wagle et al., 2014). (B) Kaplan-Meier overall survival from The Cancer Genome Atlas according to expression of ROCK-myosin II genes (listed in A) (n = 389 melanoma patients). (C) MYL9 mRNA in Resp (n = 15) and NR (n = 13) anti-PD-1 patients from (Hugo et al., 2016). Boxplot: median (center line); interquartile range (box); min-max (whiskers). (D) Heatmap of fold change in expression of ROCK-myosin II genes in on-anti-PD-1 versus baseline patient samples (Riaz et al., 2017). (E) Heatmaps show ssGSEA of cross-resistance gene signatures (NR, non-responder; Resp, responder). (F and G) GSEA comparing “high myosin II activity” signature (Sanz-Moreno et al., 2011) to a subset of MAPKi-resistant patient samples from (Hugo et al., 2015) (F) or anti-PD-1/NR samples (Hugo et al., 2016) (G). Chart pie in (F) with cross-resistance hallmarks from (Hugo et al., 2015). Nominal p values shown, FDR < 0.001 (F) and 0.145 (G). (H–K) Images (patient no. 17) and quantification in 12 paired samples before and after therapies (including those in Figures S4E and S4F) of: p-MLC2 (% cells with highest score), melanoma marker S100 (inset) (H); Masson's trichrome staining (percentage stained area/section) (I); CD206+ cells (J); FOXP3+ cells (K). Scale bars, 100 μm. p values by Mann-Whitney test (C, H–K). See also Figure S4 and Tables S4, S5, and S6.
Figure 5
Figure 5
ROCK-Driven Myosin II Activity in Immunotherapy-Resistant Melanoma (A) Top, schematic of cell lines. Bottom, p-MLC2 immunoblots after treatment: n = 7 (G); n = 3 (H). (B) Survival of patient no. 26 cells treated for 10 days (n = 4). (C) Top, schematic of experiment. Bottom, survival of 4434 and 5555 anti-PD-1/non-responder (NR) lines versus responder (Resp) after a 3-day treatment (n = 3, 5555; n = 4, 4434). (D) p-MLC2 and p-ERK1/2 immunoblots of patient no. 58 (n = 4) and no. 33 (n = 3) cells after treatment. (E) Images and quantification of cell survival on collagen I for 7 days (n = 3). (F) p-MLC2 and p-ERK1/2 immunoblots of patient no. 62T3 cells after treatment (n = 3). (G) Survival of patient no. 62T3 cells after a 10-day treatment (n = 3). (H) p-MLC2 and p-ERK1/2 immunoblots of patient no. 2 cells after treatment (n = 5). (I) Cell morphology of patient no. 2 cells on collagen I after treatment. n = 70 cells (dots) from 2 experiments. Scale bar, 50 μm. (J) Survival of patient no. 2 cells as spheroid-forming ability on collagen I for 16 days (n = 3); Scale bar, 100 μm. (K) Survival after a 10-day blebbistatin treatment (n = 3). (L) Survival 8 days after gene depletion by RNAi (n = 3; n = 4 patient no. 2 MYL12B-ROCK1/2, no. 62T3 MYL9; n = 5 no. 62T3 MYL12B). Average percentage mRNA KD (percentage decrease versus control) by qRT-PCR is shown. Vertical line in (D, F, and H): cell line establishment. (A–J) ROCKi GSK269962A, H1152; (F–K) BRAFi PLX4720. (A, D, F, H, and I) 24 h treatment. Graphs show mean ± SEM and individual data points (circle) except boxplot in I (median, center line; interquartile range, box; min-max, whiskers). p values by one-way ANOVA with Tukey's (B, C, G, and J) or Dunnett's correction (L, myosin genes); Kruskal-Wallis with Dunn's correction (I), t test with Welch's correction (E, K, and L, ROCK); ∗∗p < 0.01, ∗∗∗p < 0.001, ∗∗∗∗p < 0.0001; n.s., not significant. See also Figure S5.
Figure 6
Figure 6
ROCK-Myosin II Inhibition Induces Lethal ROS, DNA Damage, and Cell-Cycle Arrest (A) GSEA of ROS/oxidative stress-related gene signatures in MAPKi-resistant versus sensitive cell lines (group 1) from (Song et al., 2017). Dashed line indicates statistical significance. (B) The 10 most enriched canonical pathways in downregulated genes in MAPKi-resistant cell lines (group 1) from (Song et al., 2017). (C) Left, ROS levels in A375 (s) and A375/PLX/R (R) cells after treatment (n = 6). Right, quantification of p-H2A.X immunoblots (n = 7). (D and E) Cell-cycle analysis after treatment (n = 3–4). Sensitive (s)-resistant (R) pairs (D, left A375; right WM983A). A375/PLX/R (E); G, GSK269962A; B, blebbistatin. (F) p-STAT3 levels after treatment (n = 3 patient no. 35, WM793B; n = 4 A375/PLX/R; n = 5 patients no. 2 and 58). (G) Mcl-1 levels of A375/PLX/R cells after treatment (n = 3). (H and I) Percentage of dead cells by annexin V/PI staining of A375/PLX/R (H), patient no. 2 and no. 62T3 (I) cells after a 3-day treatment (n = 4 A375/PLX/R; n = 5 patient no. 2; n = 4 patient no. 62T3). (C, D, and F–I) ROCKi GSK269962A; (E, H, and I) BRAFi PLX4720. (C–G) 24 h treatment. (C and F–I) Mean ± SEM and individual data points (circle). Asterisks in (D and E) are statistical significance in multinucleated cells. p values by one-way ANOVA with Tukey's (D–F, H, and I) or Benjamini, Krieger, and Yekutieli correction (C); unpaired t test with Welch's correction (G), p < 0.05, ∗∗p < 0.01, ∗∗∗p < 0.001, ∗∗∗∗p < 0.0001; n.s., not significant. See also Figure S6.
Figure 7
Figure 7
Combining ROCK Inhibitors with BRAF Inhibitors In Vivo (A) Top, schematic of experiment. Left, growth of A375/PLX/R xenografts in nude mice after treatment. Middle, Kaplan-Meier survival plot. Right, tumor volume at endpoint (n = 4–6 mice/group). (B) Left, volume of patient no. 2 xenografts in NSG mice after a 21-day treatment (n = 7 mice/group). Right, tumor growth at endpoint versus baseline. (C) p-MLC2 staining in patient no. 2 xenografts. Scale bar, 100 μm. (D) Survival of patient no. 2 cells in the mouse lung 24 h post-injection (n = 8–9 mice from 2 experiments). Scale bar, 100 μm. (E) Left, volume of patient no. 35 xenografts in NSG mice after a 10-day treatment (n = 6 mice/group). Right, p-MLC2 staining. Scale bar, 100 μm. (F and G) Images and quantification of p-MLC2 (F), CD206+ (G) in A375/PLX/R xenografts from (A). Scale bars, 100 μm. Ratio of CD206+/F4/80+ shown. (F and G) Pooled data from 2 experiments. (A–G) ROCKi GSK269962A, BRAFi PLX4720. Boxplots show median (center line); interquartile range (box); min-max (whiskers); and individual mice (circles). p values by ANOVA with Tukey's: (A) right graph, (B) left graph; Benjamini, Krieger, and Yekutieli (C, D, F, G, and E, right) or Dunnett's correction (E, left), Mantel-Cox (A, survival plot), chi-square test: percentage regressions in (A, left) and (B, right). p < 0.05, ∗∗p < 0.01, ∗∗∗p < 0.001, ∗∗∗∗p < 0.0001; n.s., not significant. See also Figure S7.
Figure 8
Figure 8
ROCK-Myosin II Inhibition Improves Efficacy of Immune Checkpoint Inhibitors (A) Top, schematic of treatment. Bottom, growth of 5555 allografts in C57BL/6J mice after treatment. Pooled data from 3 experiments (n = 6–8 mice/group/experiment). (B–D) Images and quantification of p-MLC2 (B), CD206+ (C), and FOXP3+ (D) cells in 5555 tumors at endpoint (pooled data from 2 experiments). Ratio CD206+/F4/80+ shown. Scale bars, 100 μm (p-MLC2, CD206) and 50 μm (FOXP3). (E) Schematic of experiment. (F) Left, growth of 5555 allografts after treatment. Right, quantification of p-MLC2, CD206+, F4/80+, and ratio CD206+/F4/80+ in anti-PD-1/NR or Resp tumors. (G) Left, growth of 5555 anti-PD-1/NR allografts in new recipient mice after treatment (n = 7-8 mice/group). Right, survival plot. (H) Images and quantification of p-MLC2 and PD-L1 on tumor cells in tumors from (G). Scale bars, 25 μm. (I) Left, images and quantification of PD-L1 on CD206+ cells in tumors from (G). Images show merged pseudo-colors for each staining. Scale bar, 50 μm. Right, quantification of FOXP3+ Tregs in tumors from (G). (A–D and G–I) ROCKi GSK269962A. Boxplots show median (center line); interquartile range (box); min-max (whiskers); and individual mice (circles). p values by ANOVA with Benjamini, Krieger, and Yekutieli correction (B–D and H–I), t test (F), chi-square test: percentage regressions in (A) and (G). p < 0.05, ∗∗p < 0.01, ∗∗∗p < 0.001, ∗∗∗∗p < 0.0001; n.s., not significant. See also Figure S8.

References

    1. Alexander S., Friedl P. Cancer invasion and resistance: interconnected processes of disease progression and therapy failure. Trends Mol. Med. 2012;18:13–26. - PubMed
    1. Almeida F.V., Douglass S.M., Fane M.E., Weeraratna A.T. Bad company: microenvironmentally mediated resistance to targeted therapy in melanoma. Pigment Cell Melanoma Res. 2019;32:237–247. - PMC - PubMed
    1. Arozarena I., Sanchez-Laorden B., Packer L., Hidalgo-Carcedo C., Hayward R., Viros A., Sahai E., Marais R. Oncogenic BRAF induces melanoma cell invasion by downregulating the cGMP-specific phosphodiesterase PDE5A. Cancer Cell. 2011;19:45–57. - PubMed
    1. Baenke F., Chaneton B., Smith M., Van Den Broek N., Hogan K., Tang H., Viros A., Martin M., Galbraith L., Girotti M.R. Resistance to BRAF inhibitors induces glutamine dependency in melanoma cells. Mol. Oncol. 2015;10:73–84. - PMC - PubMed
    1. Balch C.M., Gershenwald J.E., Soong S.J., Thompson J.F., Atkins M.B., Byrd D.R., Buzaid A.C., Cochran A.J., Coit D.G., Ding S. Final version of 2009 AJCC melanoma staging and classification. J. Clin. Oncol. 2009;27:6199–6206. - PMC - PubMed

Publication types

MeSH terms