. 2020 Apr 1:209:116538.
doi: 10.1016/j.neuroimage.2020.116538. Epub 2020 Jan 11.

Dissociated neuronal phase- and amplitude-coupling patterns in the human brain

Affiliations

Dissociated neuronal phase- and amplitude-coupling patterns in the human brain

Marcus Siems et al. Neuroimage. .

Abstract

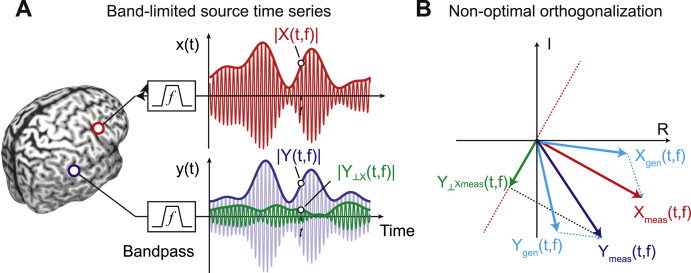
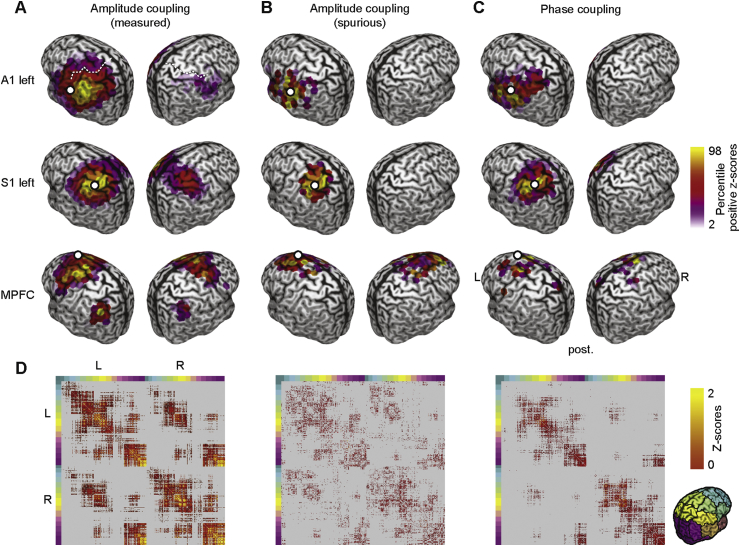
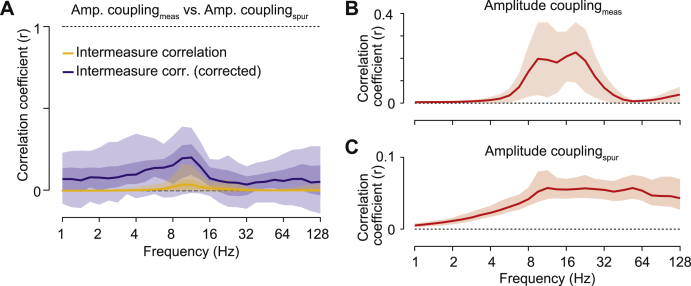
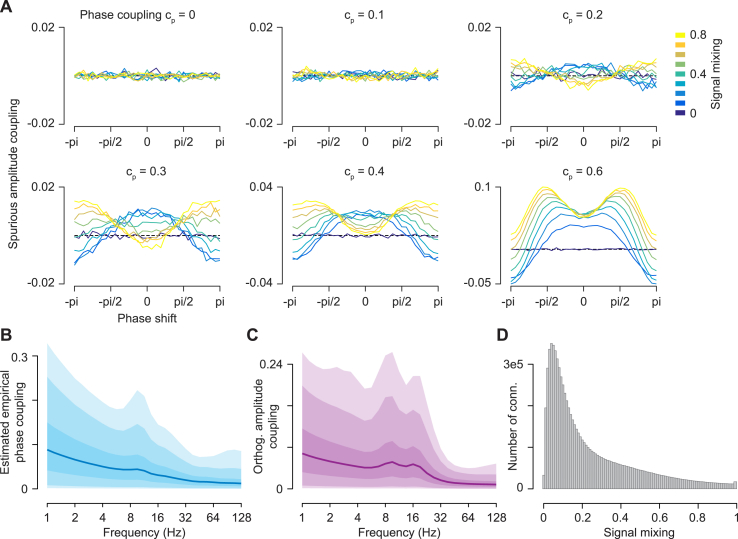
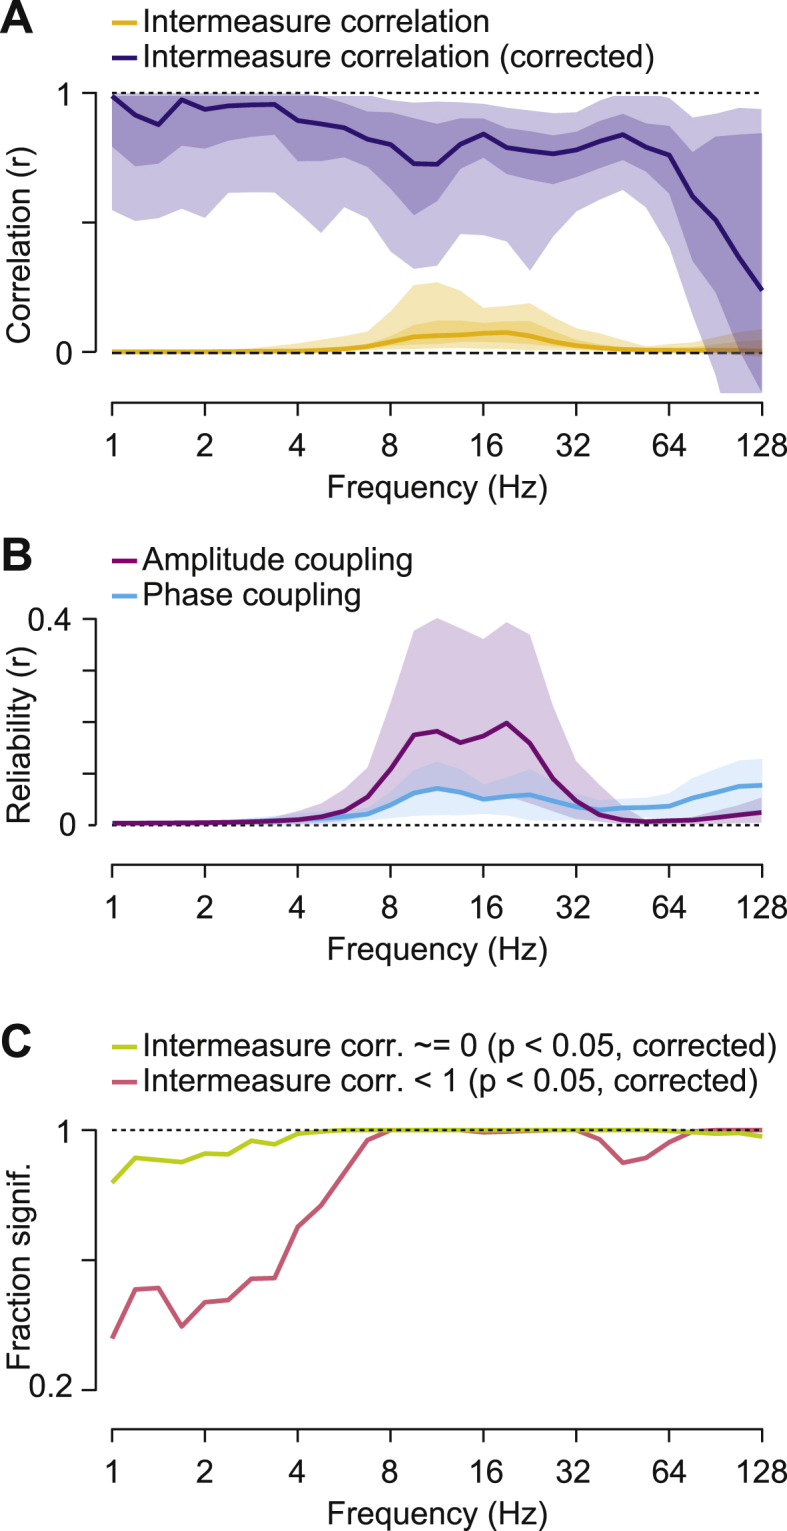
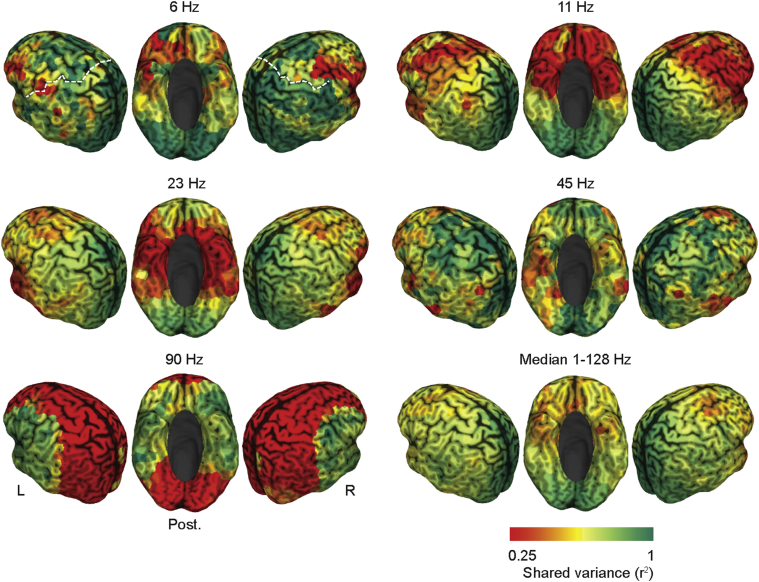
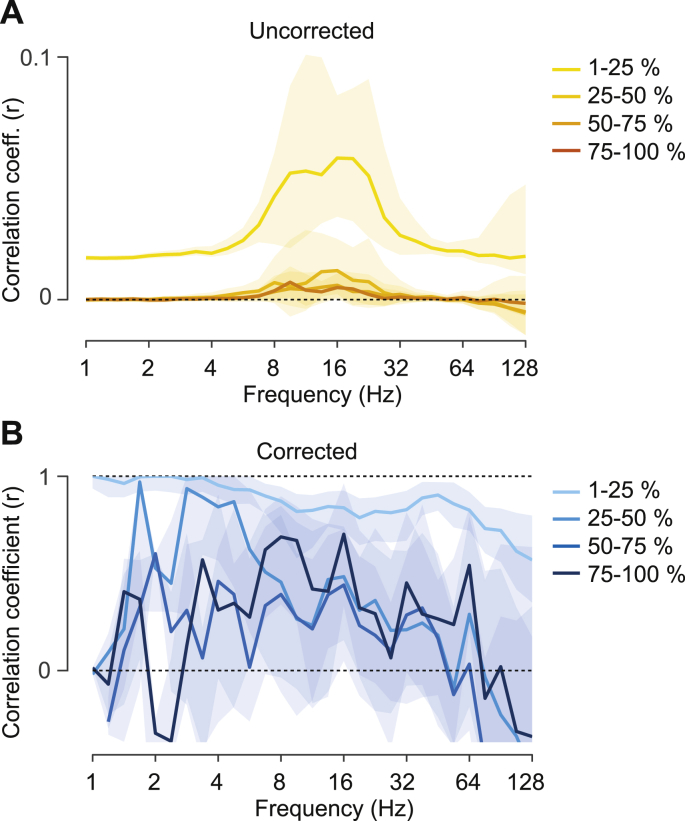
Coupling of neuronal oscillations may reflect and facilitate the communication between neuronal populations. Two primary neuronal coupling modes have been described: phase-coupling and amplitude-coupling. Theoretically, both coupling modes are independent, but so far, their neuronal relationship remains unclear. Here, we combined MEG, source-reconstruction and simulations to systematically compare cortical amplitude-coupling and phase-coupling patterns in the human brain. Importantly, we took into account a critical bias of amplitude-coupling measures due to phase-coupling. We found differences between both coupling modes across a broad frequency range and most of the cortex. Furthermore, by combining empirical measurements and simulations we ruled out that these results were caused by methodological biases, but instead reflected genuine neuronal amplitude coupling. Our results show that cortical phase- and amplitude-coupling patterns are non-redundant, which may reflect at least partly distinct neuronal mechanisms. Furthermore, our findings highlight and clarify the compound nature of amplitude coupling measures.

Keywords: Amplitude-coupling; Attenuation correction; Functional connectivity; Human connectome project; MEG; Neuronal oscillations; Phase-coupling; Synchrony.


Figures

Fig. 1
Fig. 1
Principle of signal leakage reduction for amplitude relations (A) Illustration of band-limited time series from two sources X (red, upper panel) and Y (blue, middle panel) with their envelopes (thick lines). The green thick line resembles the envelope of signal Y orthogonalized on signal X. (B) illustrates how the orthogonalization can induce specious amplitude coupling in the presence of phase coupling and signal leakage. We orthogonalize the measures signal Ymeas onto the measured signal Xmeas. In the presence of signals leakage, both measured signals reflect a mix of the genuine signals Xgen and Ygen. For non-zero phase coupling between Xgen and Ygen, Xmeas is rotated away from Xgen. This causes sub-optimal signal orthogonalization and spurious amplitude coupling.
Fig. 2
Fig. 2
Seed based analysis for early sensory and higher order cortices at 16Hz Seed-based correlation structure (z-scores) of the left auditory (left A1, top row), left somatosensory (left S1, middle row), and the medial prefrontal cortex (MPFC, bottom row) for measured amplitude-coupling (A), spurious amplitude-coupling due to phase-coupling (B) and measured phase coupling (C). Coupling z-scores are tested against zero and statistically masked (p ​< ​0.05, FDR corrected). Color scale ranges from the 2nd to the 98th percentile of significant values, scaled within each panel. White dots indicate seed regions. The white dashed line in the top left panel highlights the central sulcus (see 4.3 for exact seed coordinates). (D) Full cortico-cortical connectivity at 16Hz. Seed-wise coupling z-scores are tested against zero and statistically masked (p ​< ​0.05, FDR corrected). Gray areas indicate non-significant connections. Colored marginals and the inset on the bottom right indicate the ordering of cortical seeds.
Fig. 3
Fig. 3
Correlation between measured and spurious amplitude-coupling patterns (A) Frequency resolved correlation between measured and spurious amplitude-coupling patterns. Lines indicate median attenuation corrected (blue) and uncorrected (yellow) correlation. Shaded areas indicate the 5–95% and 25–75% inter-percentile range across cortical space. (B) Reliability, i.e. correlation, of measured amplitude-coupling patterns between subjects. (C) Reliability of spurious amplitude-coupling patterns between subjects. Shaded areas indicate the 5– 95% interquantile range.
Fig. 4
Fig. 4
Systematic simulation of spurious amplitude coupling and empirical parameters (A) Simulation of spurious amplitude coupling as function of phase coupling (panels), phase shift between signals (-pi to pi) and signal mixing (colored lines). (B) Distribution of the estimated empirical phase coupling (C) Distribution of the measured amplitude coupling (D) Distribution of empirical signal mixing. All shaded areas indicate the 1–99%, 5–95% and 25–75% interquantile ranges.
Fig. 5
Fig. 5
Correlation between amplitude- and phase coupling patterns (A) Spectrally resolved distribution of the correlation between corrected amplitude- and phase coupling patterns. The lines show the median of the uncorrected (yellow) and attenuation corrected (blue) correlations. The shaded areas indicate the 5–95% and 25–75% interquantile range across cortical space. (B) Between-subject reliability of corrected amplitude coupling (purple) and phase coupling (cyan) as a function of frequency. Shaded areas indicate the 5–95% interquantile range across cortical space. (C) Spectrally resolved fraction of patterns that show an attenuation corrected correlation significantly different from 0 (green line) or smaller than 1 (red line) (p ​< ​0.05, FDR-corrected).
Fig. 6
Fig. 6
Cortical distribution of the correlation between amplitude- and phase coupling patternsCortical distribution of the shared variance (r2) between corrected amplitude- and phase coupling patterns for 6 ​Hz, 11 ​Hz, 23 ​Hz, 45 ​Hz and 90 ​Hz. The bottom right panel shows the median across all assessed frequencies (1–128Hz). Red areas indicate differences whereas green areas indicate similarity between coupling modes. The white dashed line (top left panel) indicates the central sulcus.
Fig. 7
Fig. 7
Correlation between amplitude- and phase coupling patterns as a function of connection distanceSpectrally resolved correlation between corrected amplitude- and phase coupling patterns for different regimes (quartiles) of Euclidean distance between the cortical seeds of each connection. (A) Shows the uncorrected and (B) the attenuation corrected correlation between corrected amplitude coupling and phase coupling patterns. Shaded areas indicate the 25–75% interquartile range over space.

Similar articles

Cited by

References

    1. Akam T., Kullmann D.M. Oscillatory multiplexing of population codes for selective communication in the mammalian brain. Nat. Rev. Neurosci. 2014;15:111–122. - PMC - PubMed
    1. Benjamini Y., Hochberg Y. Controlling the false discovery rate: a practical and powerful approach to multiple testing. J. R. Stat. Soc. Ser. B Methodol. 1995;57:289–300.
    1. Bergholm F., Adler J., Parmryd I. Analysis of bias in the apparent correlation coefficient between image pairs corrupted by severe noise. J. Math. Imaging Vis. 2010;37:204–219.
    1. Bosman C.A., Schoffelen J.-M., Brunet N., Oostenveld R., Bastos A.M., Womelsdorf T., Rubehn B., Stieglitz T., De Weerd P., Fries P. Attentional stimulus selection through selective synchronization between monkey visual areas. Neuron. 2012;75:875–888. - PMC - PubMed
    1. Brookes M.J., O’Neill G.C., Hall E.L., Woolrich M.W., Baker A., Palazzo Corner S., Robson S.E., Morris P.G., Barnes G.R. Measuring temporal, spectral and spatial changes in electrophysiological brain network connectivity. Neuroimage. 2014;91:282–299. - PubMed

Publication types