. 2020 Jan 7;12(1):145.
doi: 10.3390/cancers12010145.

The Aryl Hydrocarbon Receptor Is Expressed in Thyroid Carcinoma and Appears to Mediate Epithelial-Mesenchymal-Transition

Affiliations

The Aryl Hydrocarbon Receptor Is Expressed in Thyroid Carcinoma and Appears to Mediate Epithelial-Mesenchymal-Transition

Sonia Moretti et al. Cancers (Basel). .

Abstract

Aryl hydrocarbon receptor (AhR) is expected to promote initiation, progression and invasion of cancer cells regulating proliferation, differentiation, gene expression, inflammation, cell motility and migration. Furthermore, an immunosuppressant function of AhR has been recognized. This study evaluated AhR expression and its role in thyroid cancer progression. AhR expression was assessed by qPCR in 107 thyroid cancer samples (90 PTCs, 11 MTCs, 6 ATCs), and by immunohistochemistry in 41 PTCs. To estimate receptor activation, the expression of target genes CYP1A1 and CYP1B1 was measured. AhR functional effects were evaluated in kynurenine-stimulated FTC-133 and BcPap cell lines by analyzing the expression of genes involved in EMT and cell motility. AhR mRNA expression resulted significantly higher in all the analyzed thyroid cancer samples compared to normal thyroid and a statistically significant correlation with CYP1B1 was detected. Kynurenine-stimulated FTC-133 and BcPap showed the activation of a specific AhR-driven EMT program characterized by E-cadherin decrease and SLUG, N-cadherin and fibronectin increase, resulting in boost of cell motility and invasion. This study confirmed the importance of the IDO1-Kyn-AhR pathway in thyroid cancer tumorigenesis, suggesting an AhR pivotal role in mediating an immunosuppressive microenvironment and favoring the acquisition of a mesenchymal phenotype that could promote invasiveness and metastasis.

Keywords: AhR; EMT; SLUG; cell migration and invasiveness; thyroid cancer.


Conflict of interest statement

The authors declare no conflict of interest.

Figures

Figure 1
Figure 1
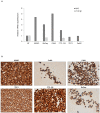
AhR expression in thyroid cancer samples. (A) After total RNA extraction from thyroid cancer samples and cDNA synthesis, AhR mRNA expression was evaluated by qPCR. The data are presented as medians of Relative Quantification (RQ) obtained normalizing the acquired data with those of the normal thyroid sample, and p values were calculated using the one-sample t test. In all 107 analyzed samples, AhR expression results higher compared with normal thyroid (median difference PTCs: 24.90 (range 4.034–77.56, p ≤ 0.0001), MTCs: 8.55 (range 3.29–18.97, p ≤ 0.0001), ATCs: 9.02 (range 2.89–12.20, p ≤ 0.0001). The yellow boxes depict the values in the second and third quartiles. The black segment inside the boxes indicates the median. The vertical bars outside the boxes indicate the ranges. The horizontal red line refers to normal thyroid (NT). (B) AhR expression was evaluated by IHC on tissue sections of 41 PTC cases with a primary monoclonal anti-human AhR antibody. AhR immunostaining showed an increased expression of the receptor in the cancerous epithelial cells of the PTCs with 3 different staining patterns: high expression (left top panel, 200×), low expression (right top panel, 100×), and heterogeneous expression (bottom panels, 40× and 400×).
Figure 2
Figure 2
AhR expression in thyroid samples of transgenic mice. AhR expression was evaluated by IHC on tissue sections of 20 tissues (14 thyroid cancers, 4 normal thyroids and 2 lymph node metastases) with a primary monoclonal anti- mouse AhR antibody. (A) High expression of AhR in a thyroid cancer from a TetOn-BRAF-P53 mouse (200×). (B) Heterogeneous AhR expression in a thyroid tumor from a BRAF-Lox/TPO-Cre mouse (100×). Arrow: infiltrative cells with higher AhR staining. (C) AhR negative staining in a thyroid derived from a Tg-rtTA/tetO-BRAFV600E mouse not treated with dox to induce BRAFV600E expression (200×). (D) AhR positive staining in a thyroid derived from a Tg-rtTA/tetO-BRAFV600E mouse treated for 7 days with dox to induce BRAFV600E expression (200×).
Figure 3
Figure 3
AhR expression in thyroid cancer cell lines. (A) After total RNA extraction from thyroid cancer cell lines and cDNA synthesis, AhR and CYP1B1 mRNA expressions were evaluated by qPCR. The data are presented as means of RQ obtained normalizing the acquired data with those of the normal thyroid sample. Only FTC-133 and BcPap cell lines showed detectable CYP1B1 mRNA, although lower than normal thyroid. (B) AhR expression was evaluated by ICC on cell pellets using a primary monoclonal anti-human AhR antibody. Immunostaining showed that AhR was localized prevalently in the cytoplasm in all the cell lines except for FTC-133 where a simultaneous cytoplasmic and nuclear staining was detected. Magnification: 400×.
Figure 4
Figure 4
Kynurenine induces CYP1B1 expression in thyroid cancer cell lines. FTC-133 (A) and BcPap cells (B) were incubated for the indicated times with kynurenine (100 µM) in the presence or absence of the AhR inhibitor CH223191 (10 µM) and harvested for total RNA extraction and cDNA synthesis. CYP1B1 mRNA expression levels were assayed by qPCR. The data are presented as means of arbitrary units. All experiments were repeated three times and the more representative results are depicted. DMSO: Dimethyl sulfoxide treated cells; Kyn: kynurenine treated cells; CH: CH223191 treated cells. p values were calculated applying the unpaired Student’s t test. *, p < 0.05.
Figure 5
Figure 5
Effects of kynurenine on immune regulatory genes IDO1 and AhR. FTC-133 and BcPap cells were incubated for the indicated times with kynurenine (100 µM) in the presence or absence of the AhR inhibitor CH223191 (10 µM) and harvested for total RNA extraction and cDNA synthesis. IDO1 and AhR mRNA expression levels were assayed by qPCR. The data are presented as means of arbitrary units. All experiments were repeated three times and the more representative results are depicted. p values were calculated applying the unpaired Student’s t test. DMSO: Dimethyl sulfoxide treated cells; Kyn: kynurenine treated cells; CH: CH223191 treated cells. (A) IDO1 expression in FTC-133 cells; (B) AhR expression in FTC-133 cells; (C) IDO1 expression in BcPap cells; (D) AhR expression in BcPap cells. * Differences between kynurenine-treated cells and untreated cells, p < 0.05. ** Differences between cells treated with CH223191 alone or in combination with kynurenine and respective controls, p < 0.05.
Figure 6
Figure 6
Kynurenine induces SLUG expression. FTC-133 (A) and BcPap (B) cells were incubated for the indicated times with kynurenine (100 µM) in the presence or absence of the AhR inhibitor CH223191 (10 µM) and harvested for total RNA extraction and cDNA synthesis. SLUG mRNA expression levels were assayed by qPCR. The data are presented as means of arbitrary units. All experiments were repeated three times and the more representative results are depicted. DMSO: Dimethyl sulfoxide treated cells; Kyn: kynurenine treated cells; CH: CH223191 treated cells. p values were calculated applying the unpaired Student’s t test. *, p < 0.05.
Figure 7
Figure 7
Effects of kynurenine on IDO1, AhR and SLUG protein levels. FTC-133 and BcPap cells were incubated for the indicated times with kynurenine (100 µM) in the presence or absence of the AhR inhibitor CH223191 (10 µM) and harvested for protein extraction. Expression of IDO1, AhR, SLUG and tubulin were assayed by immunoblot. All the experiments were repeated twice, and the more representative results are depicted. The bands of the shown experiment were analyzed by densitometry and normalized with tubulin. DMSO: Dimethyl sulfoxide treated cells; Kyn: kynurenine treated cells; CH: CH223191 treated cells.
Figure 8
Figure 8
Effect of kynurenine on EMT markers in FTC-133. FTC-133 cells were incubated for the indicated times with kynurenine (100 µM) and harvested for total RNA extraction and cDNA synthesis. E-cadherin (A), N-cadherin (B), and fibronectin-1 (C) mRNA expression levels were assayed by qPCR. The data are presented as means of arbitrary units. All experiments were repeated three times and the more representative results are depicted. Kyn: kynurenine treated cells. p values were calculated applying the unpaired Student’s t test. *, p < 0.05.
Figure 9
Figure 9
Effect of kynurenine on EMT markers in BcPap. BcPap cells were incubated for the indicated times with kynurenine (100 µM) and harvested for total RNA extraction and cDNA synthesis. N-cadherin (A) and fibronectin-1 (B) mRNA expression levels were assayed by qPCR. The data are presented as means of arbitrary units. All experiments were repeated three times and the more representative results are depicted. Kyn: kynurenine treated cells. p values were calculated applying the unpaired Student’s t test. *, p < 0.05.
Figure 10
Figure 10
Kynurenine induced OCT4 gene. FTC-133 (A) and BcPap (B) cells were incubated for the indicated times with kynurenine (100 µM) and harvested for total RNA extraction and cDNA synthesis. OCT4 mRNA expression levels were assayed by qPCR. The data are presented as means of arbitrary units. All experiments were repeated three times, and the more representative results are depicted. Kyn: kynurenine treated cells. p values were calculated applying the unpaired Student’s t test. *, p < 0.05.
Figure 11
Figure 11
Wound healing assay. FTC-133 and BcPap cells were seeded in 96 well plates and, at confluence, stoppers were removed, and cells treated with kynurenine (100 µM) and/or CH223191 (10 µM). Images were acquired and the free cells area was measured with ImageJ software. The data are presented as means of percentage of wound closure obtained normalizing the free cells area of each sample with the free cells area of untreated cells. Data of three independent experiments, in which each samples was repeated six times, were collected. Kyn: kynurenine treated cells; CH: CH223191 treated cells. (A) FTC-133 cell; (B) BcPap cell. p values were calculated applying the one sample Student’s t test. *, p < 0.05.
Figure 12
Figure 12
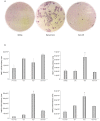
Kynurenine-induced AhR activation in tumor invasiveness. (A) Boyden chamber assay. FTC-133 and BcPap cells were seeded in a transwell in serum free medium. The bottom wells were filled with 10% FBS medium. Treatments were added to both chambers and renewed every 8 h. After 48 h, cells were fixed, stained with crystal violet and images were acquired using an optical microscope. Three independent experiments were performed and a representative one was shown. (B) FTC-133 and BcPAP cells were incubated for the indicated times with kynurenine (100 µM) in the presence or absence of the AhR inhibitor CH223191 (10 µM) and harvested for total RNA extraction and cDNA synthesis. MMP1 and MMP2 mRNA expression levels were assayed by qPCR. The data are presented as means of arbitrary units. All experiments were repeated three times and the more representative results are depicted. Kyn: kynurenine treated cells; CH: CH223191 treated cells. p values were calculated applying the unpaired Student’s t test. *, p < 0.05.

References

    1. Knutson J.C., Poland A. Response of murine epidermis to 2,3,7,8-tetrachlorodibenzo-p-dioxin: Interaction of the ah and hr loci. Cell. 1982;30:225–234. doi: 10.1016/0092-8674(82)90028-9. - DOI - PubMed
    1. Hahn M.E., Karchner S.I., Shapiro M.A., Perera S.A. Molecular evolution of two vertebrate aryl hydrocarbon (dioxin) receptors (AHR1 and AHR2) and the PAS family. Proc. Natl. Acad. Sci. USA. 1997;94:13743–13748. doi: 10.1073/pnas.94.25.13743. - DOI - PMC - PubMed
    1. Gutiérrez-Vázquez C., Quintana F.J. Regulation of the Immune Response by the Aryl Hydrocarbon Receptor. Immunity. 2018;48:19–33. doi: 10.1016/j.immuni.2017.12.012. - DOI - PMC - PubMed
    1. Xue P., Fu J., Zhou Y. The Aryl Hydrocarbon Receptor and Tumor Immunity. Front. Immunol. 2018;9:286. doi: 10.3389/fimmu.2018.00286. - DOI - PMC - PubMed
    1. Murray I.A., Patterson A.D., Perdew G.H. Aryl hydrocarbon receptor ligands in cancer: Friend and foe. Nat. Rev. Cancer. 2014;14:801–814. doi: 10.1038/nrc3846. - DOI - PMC - PubMed