. 2020 Jan 8;10(1):35.
doi: 10.3390/brainsci10010035.

Expression and Localization of Kv1.1 and Kv3.1b Potassium Channels in the Cochlear Nucleus and Inferior Colliculus after Long-Term Auditory Deafferentation

Affiliations

Expression and Localization of Kv1.1 and Kv3.1b Potassium Channels in the Cochlear Nucleus and Inferior Colliculus after Long-Term Auditory Deafferentation

Clara M Poveda et al. Brain Sci. .

Abstract

Deafness affects the expression and distribution of voltage-dependent potassium channels (Kvs) of central auditory neurons in the short-term, i.e., hours to days, but the consequences in the expression of Kvs after long-term deafness remain unknown. We tested expression and distribution of Kv1.1 and Kv3.1b, key for auditory processing, in the rat cochlear nucleus (CN), and in the inferior colliculus (IC), at 1, 15 and 90 days after mechanical lesion of the cochlea, using a combination of qRT-PCR and Western blot in the whole CN, along with semi-quantitative immunocytochemistry in the AVCN, where the role of both Kvs in excitability control for accurate auditory timing signal processing is well established. Neither Kv1.1/Kv3.1b mRNA or protein expression changed significantly in the CN between 1 and 15 days after deafness. At 90 days post-lesion, however, mRNA and protein expression for both Kvs increased, suggesting that expression regulation of Kv1.1 and Kv3.1b is part of cellular mechanisms for long-term adaptation to auditory input deprivation in the CN. Consistent with these findings, immunocytochemical localization showed increased labeling intensity for both Kvs in the AVCN at day 90 after cochlear lesion, further supporting that up-regulation of Kv1.1 and Kv3.1b in neurons of this CN division, over a long term after auditory deprivation, may be required to adapt intrinsic excitability to altered input. Contrary to findings in the CN, in the IC, expression levels of Kv1.1 and Kv3.1b did not undergo major changes after cochlear lesion. In particular, there was no evidence of long-term up-regulation of neither Kv1.1 or Kv3.1b, supporting that such post-lesion adaptive mechanism may not be needed in the IC. This suggests that post-lesion plastic adaptations to auditory input deprivation are not stereotypical along the auditory pathway.

Keywords: auditory; hearing loss; ion channels; plasticity; post-lesion plasticity.


Conflict of interest statement

This research was conducted in the absence of any commercial or financial interests that may be construed as a potential conflict of interest. The funders had no role in the design of the study; in the collection, analyses, or interpretation of data; in the writing of the manuscript, or in the decision to publish the results.

Figures
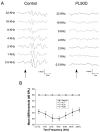
Figure 1
Figure 1
Hearing loss after the cochlear lesion. (A) Representative ABR recordings, spanning 0.5–32 kHz, from a control rat and a rat surviving 90 days after bilateral cochlear lesion. Arrows represent the beginning of stimuli. There are no recordable activity waves at any tested frequency at the highest intensity stimulus of 80 dB SPL 0.5 kHz to 32 kHz, see materials and methods). (B) ABR thresholds right before the cochlear lesion (pre-op) and 1 day (PL1), 15 days (PL15) and 90 days (PL90) after the lesion. The flat line indicates undetectable thresholds from day 1 after the lesion onwards at 80 dB SPL, the highest sound intensity used.
Figure 2
Figure 2
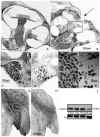
SGN loss after cochlear lesion. Nissl staining of the cochlea from a control rat (A) and at 90 days after cochlear lesion (B). The arrow indicates the site of lesion. (C,D) SGN cell bodies from the box insets shown in A and B respectively. A large decrease in SGN cell bodies is clearly visible in D. Details of SGN loss with time after lesion are given for this deafness model in the Results section and in (16). (E,F) High-magnification detail of normal SGN cell bodies (E) and (F) at 90 days post-lesion. Black arrows in F point to nuclear or cytoplasmic condensations in SGN bodies, a sign of neuronal degeneration. (G,H) Calretinin immunostaining on coronal sections of the AVCN, showing diminished fiber density at 90 days post-lesion (H) compared to controls (G). (I) Representative Western blot of the CN, showing diminished calretinin levels at 90 days after the cochlear lesion. Tubulin (Tub) was used as loading control. See the Results section for further details.
Figure 3
Figure 3
Kv1.1 and Kv3.1b gene and protein expression increase at long-term after cochlear lesion in the CN. (A) Kv1.1 and Kv3.1b mRNA levels at different time points after cochlear lesion analyzed by qRT-PCR. The bar chart shows mRNA levels relative to controls. (B) Kv1.1 and Kv3.1b protein expression levels detected by Western blot. Each image shows protein immunoreaction for each Kv in the CN. The figure shows one representative image from four independent experiments. Tubulin was used as loading control. The bar chart represents quantification of signal intensities. Data are normalized to signal intensity for day 0. Data are expressed as mean ± S.D. Asterisks show statistically significant differences (* p < 0.05; ** p < 0.01), using one-way ANOVA, with Tamhane (qRT-PCR: Kv1.1, F3,8 = 14.512, p < 0.01; Kv3.1b, F3,8 = 18.498, p < 0.001) and Tukey (Western blot: Kv1.1, F3,8 = 4.462 p = 0.04; Kv3.1b, F3,8 = 4.425, p = 0.04;) post-hoc tests.
Figure 4
Figure 4
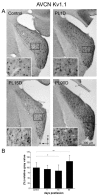
Kv1.1 immunoreactivity levels increase significantly in the AVCN at long-term after cochlear lesion. (A) Low-magnification photomicrographs of coronal sections of AVCN. The dotted contour (small dots) in A, outlines an example of the region of interest in the AVCN where thresholding segmentation was carried out for quantification of immunoreactivity. Equivalent regions were selected in all sections sampled. Insets (squares outlined with larger dots in A and B) show high-magnification details of the image. Photographs are representative of five animals. Calibration bars apply to all panels in the figure. (B) Quantitative analysis of relative gray value averages at each post-lesion time for Kv1.1 in the AVCN. Whereas a slight but significant decrease in Kv1.1 labeling intensity at 15 days was observed, Kv1.1 intensity increased significantly at 90 days after cochlear lesion. Data are expressed as mean ± S.D. Asterisks show statistically significant differences (* p < 0.05; ** p < 0.01) as determined by one-way ANOVA (F(3,187) = 19.109; p < 0.001), Tukey post-hoc test.
Figure 5
Figure 5
Kv3.1b immunoreactivity levels increase significantly in the AVCN at long-term after cochlear lesion. (A) Low-magnification photomicrographs of coronal sections of AVCN. The dotted contour (small dots) in A, outlines an example of the region of interest in the AVCN where thresholding segmentation was carried out for quantification of immunoreactivity. Equivalent regions were selected in all sections sampled. Insets (squares outlined with larger dots in A and B) show high-magnification details of the image. Photographs are representative of five animals. Calibration bars apply to all panels in the figure. (B) Quantitative analysis of relative gray values average at each post-lesion time for Kv1.1 in the AVCN. Data are expressed as mean ± S.D. Asterisks show statistically significant differences (** p < 0.01) as determined by one-way ANOVA (F(3,191) = 25.015; p < 0.001), Scheffe and Tukey post-hoc tests.
Figure 6
Figure 6
Kv1.1 and Kv3.1b gene and protein levels undergo little or no changes in the IC after cochlear lesion. (A) Kv1.1 and Kv3.1b mRNA levels at different time points after the lesion analyzed by qRT-PCR. The bar chart shows mRNA levels relative to controls. (B) Kv1.1 and Kv3.1b protein expression detected by Western blot. Each image shows protein immunoreaction for each Kv in the IC. The figure shows one representative image from four independent experiments. Tubulin (Tub) was used as loading control. The bar chart represents quantification of signal intensities. Data are normalized to signal intensity for day 0. Data are expressed as mean ± S.D. Asterisks show statistically significant differences (* p < 0.05) determined by one-way ANOVA both in qRT-PCR (Kv1.1: F(3,8) = 4.157, p = 0.047; Kv3.1b: F(3,8) = 2.123, p = 0.176) and Western blot (Kv1.1: F3,8 = 2.042, p = 0.187; Kv3.1b: F3,8 = 0.613, p = 0.613), using Tamhane (Kv1.1 and KV3.1b in Western blot) and Scheffe and Tukey (Kv3.1b in qRT-PCR) post-hoc tests.
Figure 7
Figure 7
Kv1.1 immunoreactivity levels do not change significantly in the ICc after cochlear lesion. (A) Low-magnification photomicrographs of coronal sections of IC. The dotted contour in A (small dots), shows an example of the region of interest, the ICc, where thresholding segmentation was carried out for quantitative immunocytochemistry. Equivalent regions where selected in all sampled sections of the IC. Insets (outlined with large dots in A and B) show high-magnification details of the image. Photographs are representative of five animals. Calibration bars apply to all panels in the figure. (B) Quantification of relative gray value averages at each post-lesion time for Kv1.1 in the ICc. Data are expressed as mean ± S.D. Differences are not statistically significant as determined by one-way ANOVA (F(3,33) = 3.557; p = 0.058), Scheffe and Tukey post-hoc tests.
Figure 8
Figure 8
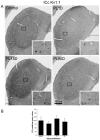
Kv3.1b immunoreactivity levels do not change significantly in the ICc after cochlear lesion. (A) Low-magnification photomicrographs of coronal sections of IC. The dotted contour in A (small dots), shows an example of the region of interest, the ICc, where thresholding segmentation was carried out for quantitative immunocytochemistry. Equivalent regions where selected in all sampled sections of the IC. Insets (outlined with large dots in A and B) show high-magnification details. Photographs are representative of five animals. Calibration bars apply to all panels in the figure. (B) Quantitative analysis of relative gray values averages at each post-lesion time for Kv3.1b in the ICc. Data are expressed as mean ± S.D. Differences are not statistically significant as determined by one-way ANOVA (F(3,37) = 2.218; p = 0.102), Scheffe and Tukey post- hoc tests.

References

    1. Caminos E., Vale C., Lujan R., Martinez-Galan J.R., Juiz J.M. Developmental regulation and adult maintenance of potassium channel proteins (Kv 1.1 and Kv 1.2) in the cochlear nucleus of the rat. Brain Res. 2005;1056:118–131. doi: 10.1016/j.brainres.2005.07.031. - DOI - PubMed
    1. Grigg J.J., Brew H.M., Tempel B.L. Differential expression of voltage-gated potassium channel genes in auditory nuclei of the mouse brainstem. Hear. Res. 2000;140:77–90. doi: 10.1016/S0378-5955(99)00187-2. - DOI - PubMed
    1. Li W., Kaczmarek L.K., Perney T.M. Localization of two high-threshold potassium channel subunits in the rat central auditory system. J. Comp. Neurol. 2001;437:196–218. doi: 10.1002/cne.1279. - DOI - PubMed
    1. Perney T.M., Kaczmarek L.K. Localization of a high threshold potassium channel in the rat cochlear nucleus. J. Comp. Neurol. 1997;386:178–202. doi: 10.1002/(SICI)1096-9861(19970922)386:2<178::AID-CNE2>3.0.CO;2-Z. - DOI - PubMed
    1. Rosenberger M.H., Fremouw T., Casseday J.H., Covey E. Expression of the Kv1.1 ion channel subunit in the auditory brainstem of the big brown bat, Eptesicus fuscus. J. Comp. Neurol. 2003;462:101–120. doi: 10.1002/cne.10713. - DOI - PubMed

LinkOut - more resources