. 2020 Jan 9;9(1):160.
doi: 10.3390/cells9010160.

STIM Protein-NMDA2 Receptor Interaction Decreases NMDA-Dependent Calcium Levels in Cortical Neurons

Affiliations

STIM Protein-NMDA2 Receptor Interaction Decreases NMDA-Dependent Calcium Levels in Cortical Neurons

Joanna Gruszczynska-Biegala et al. Cells. .

Abstract

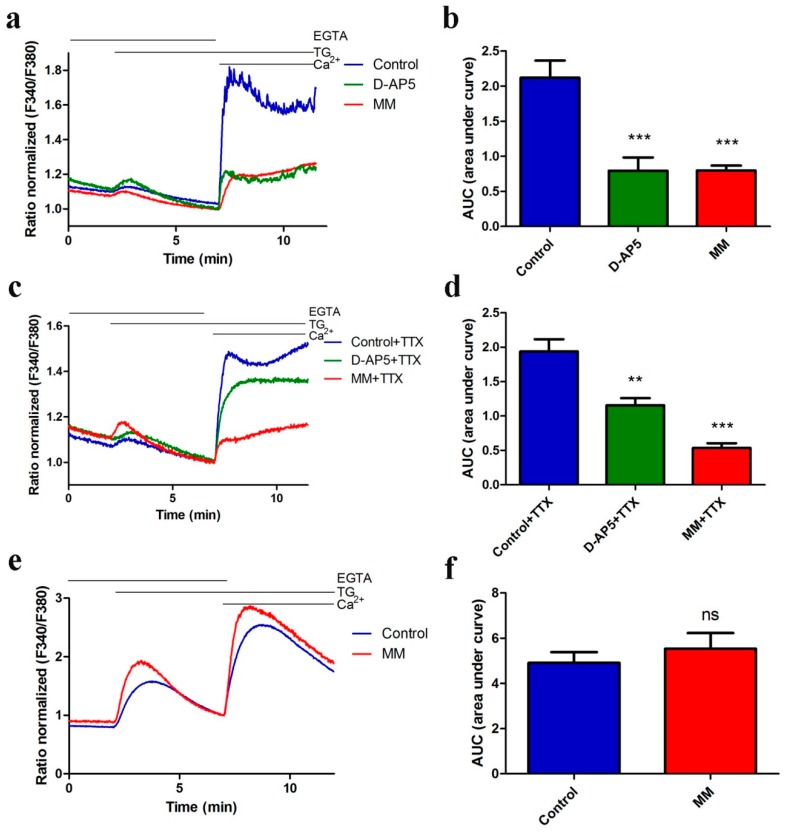
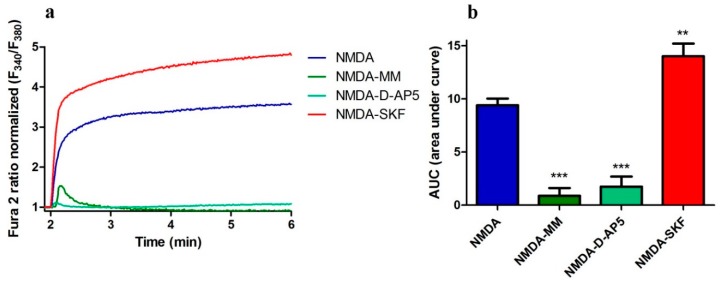
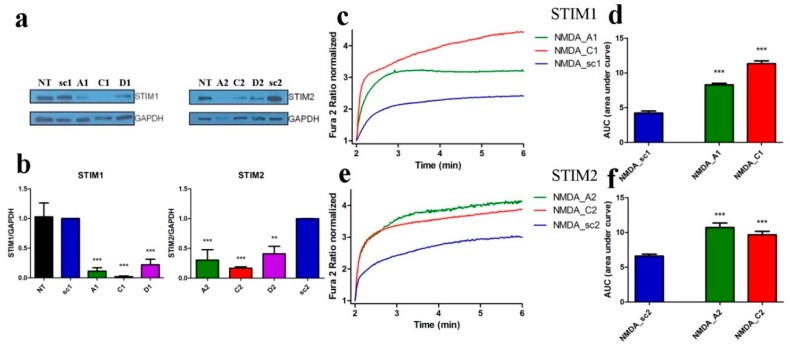
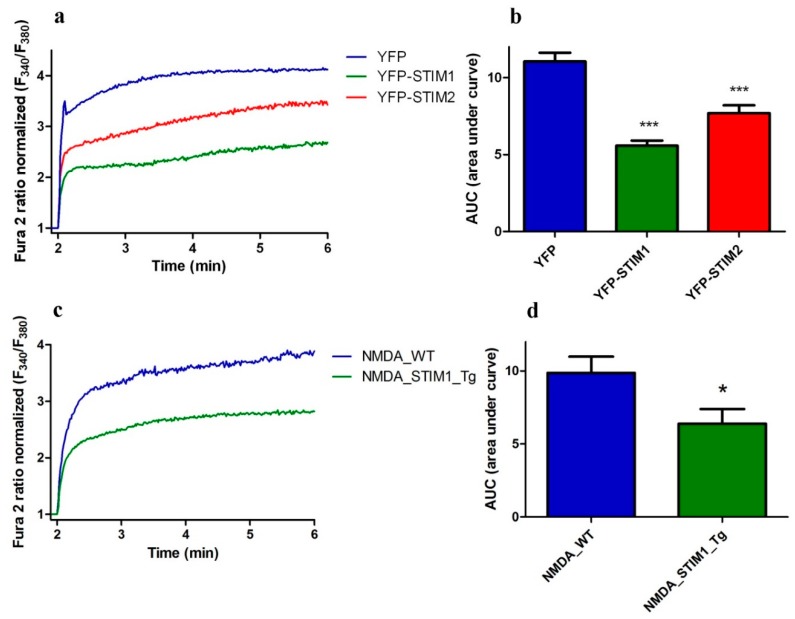
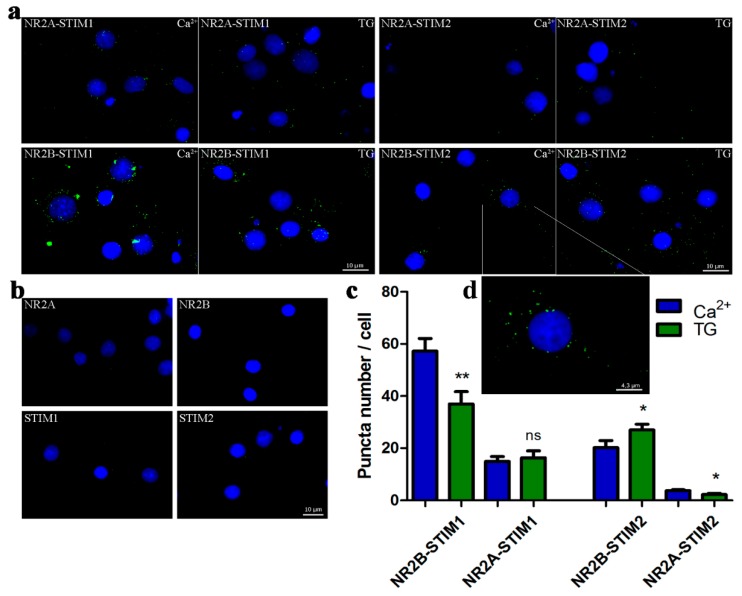
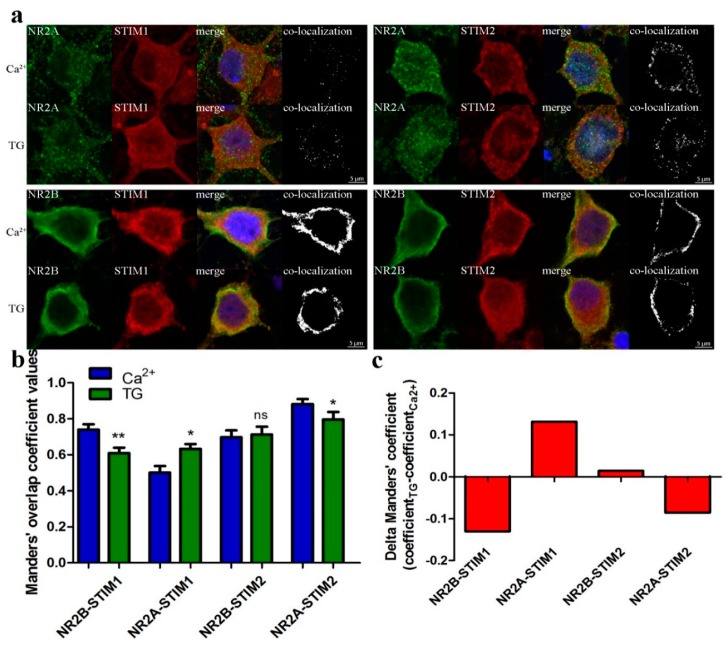
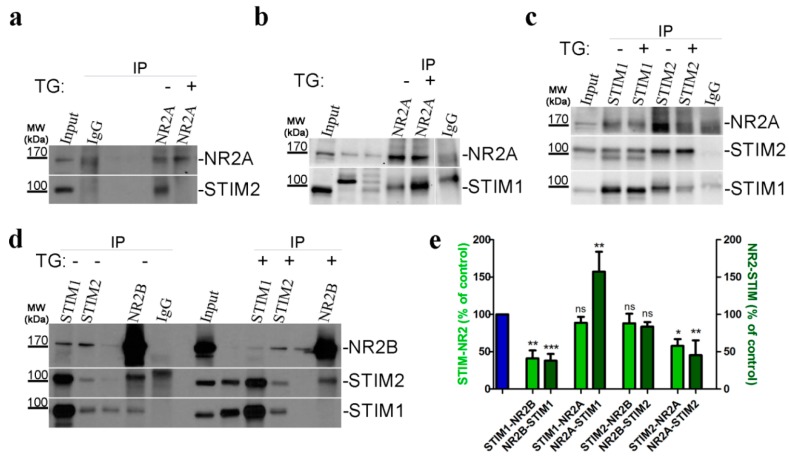
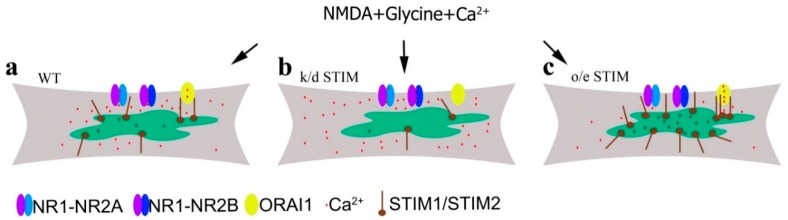
Neuronal Store-Operated Ca2+ Entry (nSOCE) plays an essential role in refilling endoplasmic reticulum Ca2+ stores and is critical for Ca2+-dependent neuronal processes. SOCE sensors, STIM1 and STIM2, can activate Orai, TRP channels and AMPA receptors, and inhibit voltage-gated channels in the plasma membrane. However, the link between STIM, SOCE, and NMDA receptors, another key cellular entry point for Ca2+ contributing to synaptic plasticity and excitotoxicity, remains unclear. Using Ca2+ imaging, we demonstrated that thapsigargin-induced nSOCE was inhibited in rat cortical neurons following NMDAR inhibitors. Blocking nSOCE by its inhibitor SKF96365 enhanced NMDA-driven [Ca2+]i. Modulating STIM protein level through overexpression or shRNA inhibited or activated NMDA-evoked [Ca2+]i, respectively. Using proximity ligation assays, immunofluorescence, and co-immunoprecipitation methods, we discovered that thapsigargin-dependent effects required interactions between STIMs and the NMDAR2 subunits. Since STIMs modulate NMDAR-mediated Ca2+ levels, we propose targeting this mechanism as a novel therapeutic strategy against neuropathological conditions that feature NMDA-induced Ca2+ overload as a diagnostic criterion.

Keywords: Ca2+ homeostasis; NMDA receptor; STIM proteins; endoplasmic reticulum (ER); neuronal store-operated calcium entry (nSOCE); neurons; organellar Ca2+; plasma membrane (PM).


Conflict of interest statement

The authors declare no conflict of interest and that the research was conducted in the absence of any commercial or financial relationships that could be construed as a potential conflict of interest.

Figures

Figure 1
Figure 1
NMDAR antagonists block TG-induced SOCE in rat cortical neurons but not HeLa cells. Average traces of intracellular Ca2+ (F340/F380) levels obtained by ratiometric Fura-2AM analysis of neurons in the absence (a) or presence of 1 µM TTX (c), or in HeLa cells (e) treated with 50 µM D-AP5 (green line) or 50 µM MM (red line) and untreated cells (blue line). Measurements were started in a medium with 0.5 mM EGTA, which was then replaced by a medium with 0.5 mM EGTA and either 2 µM TG + 50 µM D-AP5 or 2 µM TG + 50 µM MM. Finally, 2 mM CaCl2 was added to the medium to trigger nSOCE with either 50 µM D-AP5 or 50 µM MM. F340/F380 values just before the addition of Ca2+ were normalized to the same values (1). (ad) The data represent n = 28 (Control), n = 12 (D-AP5), n = 20 (MM), n = 15 (Control + TTX), n = 19 (D-AP5 + TTX) and n = 18 (MM + TTX) independent experiments that were conducted on five different primary cultures, corresponding to 1160, 513, 780, 336, 390, and 710 analyzed cells that responded to KCl-induced membrane depolarization, respectively. (ef) The data represents 17 independent measurements conducted in four different experiments corresponding to 1333 for control and 1315 for MM treated cells, respectively. (b,d,f) Summary data of panels (a,c,e) presented as the area under the curve (AUC) showing Ca2+ influx, which was calculated from the moment immediately before adding Ca2+ from minutes 7 to 11; ns (not significant), ** p < 0.01, *** p < 0.001 significantly different compared with the control (Mann-Whitney U test). Data are expressed as the Delta Ratio (±SEM).
Figure 2
Figure 2
SKF96365 increases NMDA-induced Ca2+ levels. (a) Analysis of the [Ca2+]i induced by NMDA (100 μM) and glycine (10 μM) in the presence of 5 μM nimodipine, 30 μM CNQX, and 50 μM MM; 50 μM D-AP5 or 30 μM SKF96365 (SKF) based on ratiometric measurements with Fura2-AM. F340/F380 values just before adding the NMDAR agonist were normalized to the same values (1). The data represent n independent experiments that were conducted on four different primary cultures corresponding to 516 (NMDA, n = 13), 305 (NMDA-MM, n = 10), 245 (NMDA-DAP, n = 10) and 624 (NMDA-SKF, n = 19) analyzed cells. (b) Summary of data from (a) shown as area under the curve (AUC), which was calculated from the moment immediately before the addition of NMDA. ** p < 0.01; *** p < 0.001 significantly different compared with NMDA (ANOVA followed by Tukey’s Multiple Comparison Test).
Figure 3
Figure 3
shSTIM1 and shSTIM2 increase NMDA-induced Ca2+ responses. (a) Western blot analysis of STIM1 and STIM2 protein levels using anti-STIM1 and anti-STIM2 antibodies in cortical neurons transduced with lentiviruses expressing different shRNA sequences directed against RNA for STIM1 (A1, C1, or D1), for STIM2 (A2, C2, or D2) or the control sequence shRNA (sc1, sc2). GAPDH served as reference. (b) Results of quantitative WB analysis of cell lysates obtained from neurons transduced as in (a). Each column shows the mean ± SEM of three independent transductions. Statistical analysis performed by ANOVA, followed by Tukey’s Multiple Comparison Test. NT, non-transduced control, ** p < 0.01; *** p < 0.001. (cf) NMDAR agonists-induced [Ca2+]i responses increased when expression of STIM1 (c,d) and STIM2 (e,f) is silenced by shA and shC compared to neurons transduced with shsc control plasmid. F340/F380 values just before adding NMDAR agonists normalized to the same values (1). Data represent m number of analyzed cells in n independent experiments that were conducted on three different primary cultures (NMDA_sc1, m = 89, n = 5), (NMDA_A1, m = 98, n = 5), (NMDA_C1, m = 96, n = 7), (NMDA_sc2, m = 104, n = 6), (NMDA_A2, m = 60, n = 7), and (NMDA_C2, m = 92, n = 9). (d,f) Summary of graphs (c,e) shown as an area under the curve (AUC). *** p < 0.001 significantly different compared with NMDA_sc (ANOVA followed by Tukey’s Multiple Comparison Test).
Figure 4
Figure 4
Neurons with overexpressed STIM1 and STIM2 exhibit lower NMDA-induced [Ca2+]i. (a) Analysis of NMDA and glycine-induced [Ca2+]i in the presence of nimodipine and CNQX based on ratiometric measurements with Fura2-AM in neurons overexpressing YFP-STIM1, YFP-STIM2, or YFP. F340/F380 values immediately prior to adding the NMDAR agonist were normalized to the same values (1). Data represent n independent experiments that were conducted on h different primary cultures corresponding to 71 (YFP, n = 11, h = 4), 104 (YFP-STIM1, n = 16, h = 6) and 81 (YFP-STIM2, n = 16, h = 6) analyzed cells. (b) Summary of data from (a) shown as an AUC. *** p < 0.001 significantly different compared with YFP (ANOVA followed by Tukey’s Multiple Comparison Test). (c) Analysis of [Ca2+]i induced by NMDA and glycine in the presence of nimodipine and CNQX based on ratiometric measurements with Fura2-AM in neurons from Tg(STIM1)Ibd (Tg) or control (wild type, WT) mice. F340/F380 values immediately prior to adding the NMDAR agonist were normalized to the same values (1). The data represent n independent experiments that were conducted on four different primary cultures, corresponding to 196 (NMDA_WT, n = 20) and 183 (NMDA_STIM1_Tg, n = 17) analyzed cells. (d) Summary of data from (c) shown as AUC. * p < 0.05 significantly different compared with NMDA_WT (Mann–Whitney U test).
Figure 5
Figure 5
The interaction between endogenous STIM1/STIM2 and NR2A/NR2B occurs in situ. (a) Proximity ligation assay between STIM1 and NR2B, STIM1 and NR2A, STIM2 and NR2B, and STIM2 and NR2A before and after store depletion by TG/EGTA observed by fluorescent microscopy. Neurons were also counter-stained with the nuclear marker Hoechst dye (blue). The PLA signal, recognized as a fluorescent green dot, shows the close proximity of STIM and NR2 antigens. (b) No signals were observed when one of the primary antibodies was omitted (either anti-NR2A or NR2B or STIM1 or STIM2) that demonstrates the specificity of the detection assay and used antibodies. Scale bar, 10 µm for each panel. (c) Quantification of the complexes detected by PLA. Bars represent averages from 15–30 (n) images taken in three independent experiments, corresponding to 42–64 cells ± SEM. The quantification of PLA signals was performed using ImageJ software to analyse neurons. * p < 0.05; ** p < 0.01; ns, not significant compared with the control (Mann–Whitney U test). (d) The picture shows the higher magnification of one neuron from (a) to better visualize the PLA signals and their localization in the cell.
Figure 6
Figure 6
Endogenous STIMs co-localize with NMDAR2. (a) Representative confocal images of Ca2+ or TG/EGTA-treated neurons fixed and stained with anti-NR2A or NR2B antibody (shown in green, 1st panels), with anti-STIM1 or anti-STIM2 (shown in red, 2nd panels) and with anti-MAP2 to identify neurons for analysis (not shown for clarity). (Blue) Nuclei were stained with Hoechst. The 3rd columns show the merged images of green, red and blue channels. Co-localization of NR subunits with STIM is shown in the 4th columns (white). All images are taken from a single slice from the middle of the cell. Scale bar, 5 µm for each panel. (b,c) Results of co-localization analysis of NRs with STIMs in soma of neurons treated as in (a). Bar graph depicting the quantification of the average value of STIM with NR co-localization coefficient according to Manders (b) or the difference between this coefficient value 10 min after TG treatment and before store depletion (in the presence of 2 mM Ca2+) (c). * p < 0.05; ** p < 0.01; ns, not significant compared with the control (Mann-Whitney U test). Bars represent the average of cultures from three animals; 35–55 cells per each condition (Ca2+ or TG/EGTA).
Figure 7
Figure 7
Endogenous STIMs co-immunoprecipitate with NMDAR2. (ad) Representative WBs from Co-IP experiments investigating the interaction between endogenous STIM1, STIM2 and NR2A, NR2B subunits, demonstrating a change in the interaction upon SOCE activation by TG (TG; +) compared with control neurons treated with 2 mM Ca2+ (TG; −). Neuronal lysates (Input) and eluted fractions (immunoprecipitates; IP) were separated on 10% sodium dodecyl sulfate gels, analyzed by WB and stained with the corresponding antibody anti-STIM1, STIM2, NR2A, and NR2B (as indicated on the right) as described in “Methods and Materials” section. Anti-IgG antibody was used as a negative control. WB analysis of 40 µg of cell lysate inputs is shown. Molecular weights of the markers run on the same gel are indicated on the left (in kDa). (b,d) Unlabeled bands are irrelevant to this experiment. Unspecific IgG band is visible. (c) The middle panel shows the WB stained with STIM2 protein after stripping the membrane blotted with anti-STIM1 antibody, indicated with double bands here. (e) Pooled data shows a significant change in interaction between STIM proteins and NMDAR subunits after TG treatment. Histogram represents the quantification of STIM-NR (light-green columns) or NR-STIM (dark-green columns) association in neurons incubated in TG compared to neurons incubated in 2 mM Ca2+ (blue column). Bands of co-immunoprecipitates were analyzed densitometrically and normalized to the level of the loading control (i.e., bands obtained after WB with the antibody used for immunoprecipitation). The results are expressed as a percentage of control (i.e., protein association in 2 mM Ca2+). Bar graphs are mean ± SEM of at least three independent experiments. * p < 0.05; ** p < 0.01; *** p < 0.001 significantly different compared with control; ns, not significant compared with the control (Mann–Whitney U test).
Figure 8
Figure 8
Proposed mechanism of changes in intracellular Ca2+ level induced by NMDA in the presence of glycine (without Mg2+) under the influence of different STIM protein expression. (a) In wild-type neurons with normal STIM protein expression, Ca2+ influx occurs via NMDAR and Orai channels. (b) After STIM knockdown (k/d), Ca2+ influx through the Orai channel is blocked and [Ca2+]i is increased due to Ca2+ influx via NMDAR and Ca2+ retention in the cytosol and its failure to enter the ER. (c) Overexpressing STIM (o/e) inhibits NMDA-induced Ca2+ influx into the cytosol and increases Ca2+ storage in the ER.

References

    1. Berridge M.J., Lipp P., Bootman M.D. The versatility and universality of calcium signalling. Nat. Rev. Mol. Cell Biol. 2000;1:11–21. doi: 10.1038/35036035. - DOI - PubMed
    1. Sammels E., Parys J.B., Missiaen L., De Smedt H., Bultynck G. Intracellular Ca2+ storage in health and disease: A dynamic equilibrium. Cell Calcium. 2010;47:297–314. doi: 10.1016/j.ceca.2010.02.001. - DOI - PubMed
    1. Putney J.W. A model for receptor-regulated calcium entry. Cell Calcium. 1986;7:1–12. doi: 10.1016/0143-4160(86)90026-6. - DOI - PubMed
    1. Liou J., Kim M.L., Heo W.D., Jones J.T., Myers J.W., Ferrell J.E., Jr., Meyer T. STIM is a Ca2+ sensor essential for Ca2+-store-depletion-triggered Ca2+ influx. Curr. Biol. 2005;15:1235–1241. doi: 10.1016/j.cub.2005.05.055. - DOI - PMC - PubMed
    1. Roos J., DiGregorio P.J., Yeromin A.V., Ohlsen K., Lioudyno M., Zhang S., Safrina O., Kozak J.A., Wagner S.L., Cahalan M.D., et al. STIM1, an essential and conserved component of store-operated Ca2+ channel function. J. Cell Biol. 2005;169:435–445. doi: 10.1083/jcb.200502019. - DOI - PMC - PubMed

Publication types

MeSH terms

LinkOut - more resources