

Transcription Factor CaSBP12 Negatively Regulates Salt Stress Tolerance in Pepper (Capsicum annuum L.)
- PMID: 31936712
- PMCID: PMC7013666
- DOI: 10.3390/ijms21020444
Transcription Factor CaSBP12 Negatively Regulates Salt Stress Tolerance in Pepper (Capsicum annuum L.)
Abstract
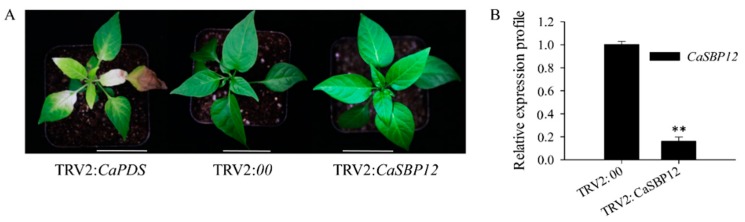
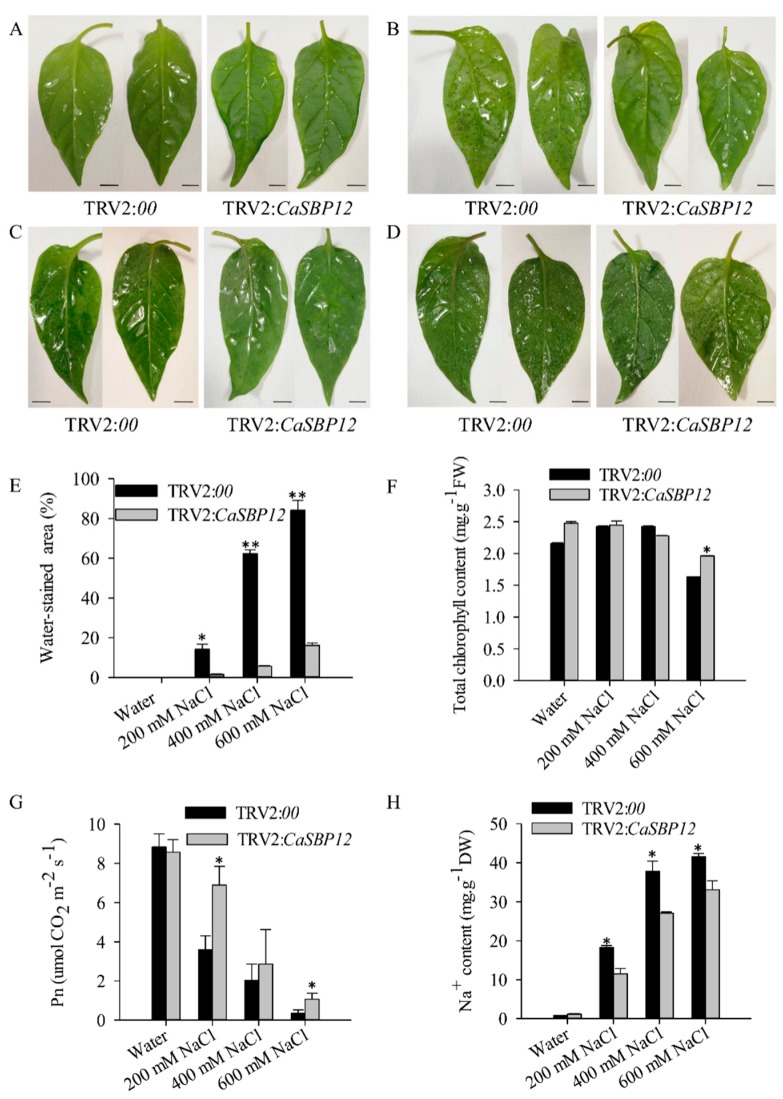
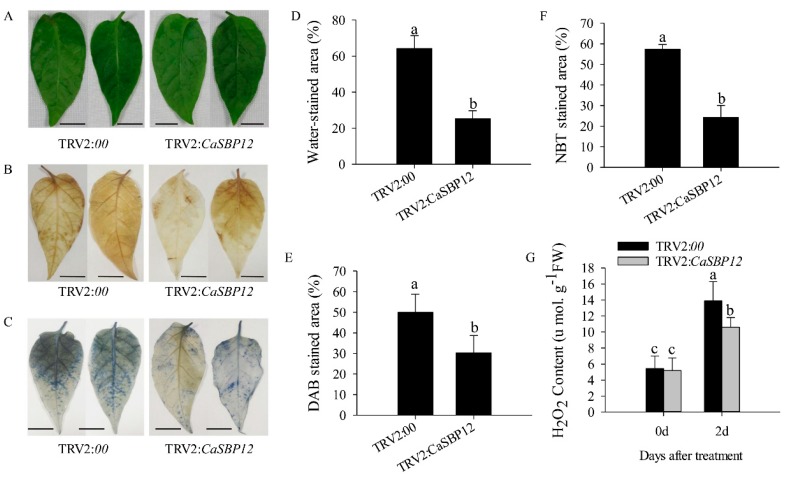
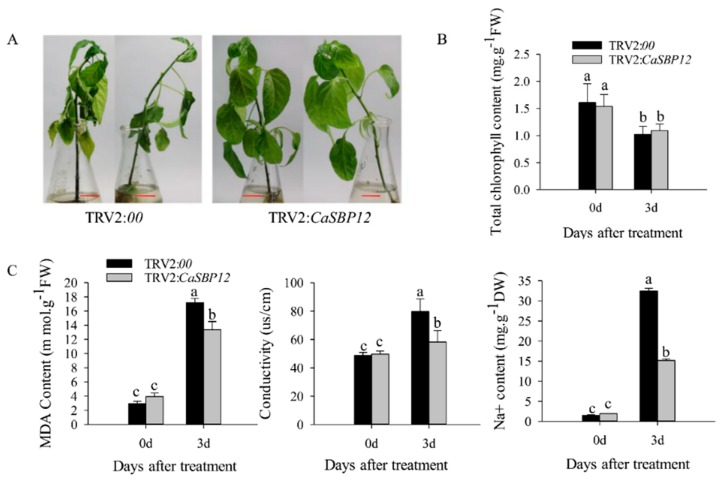
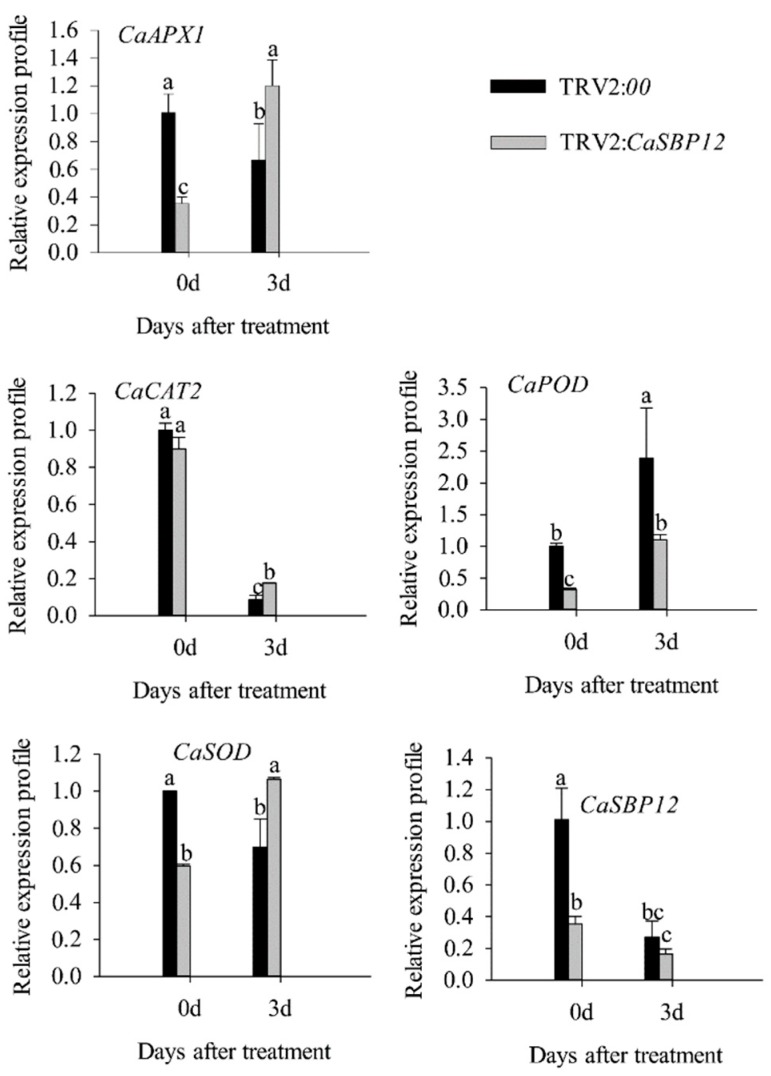
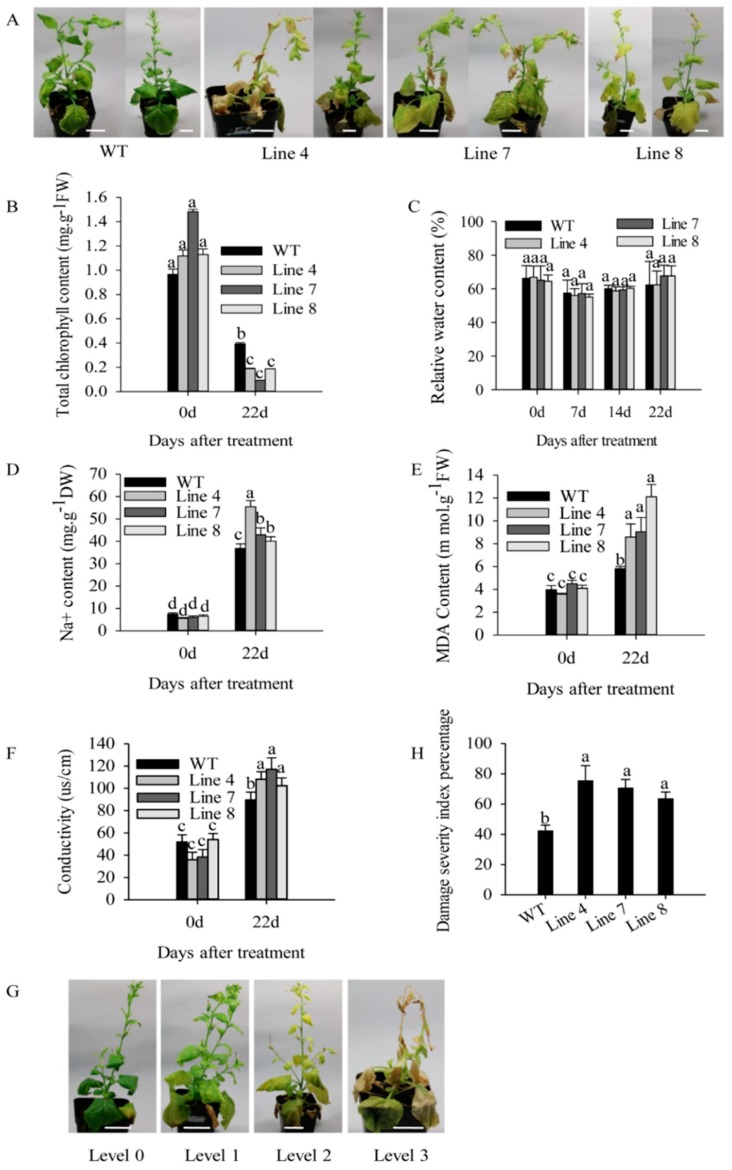
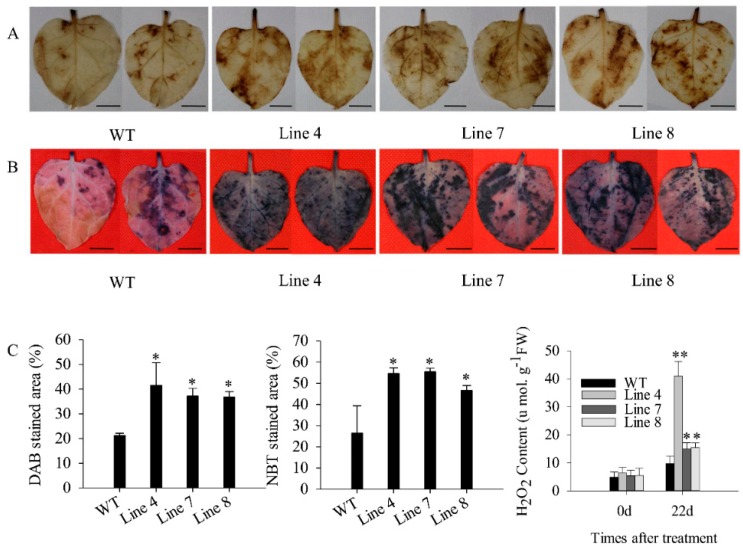
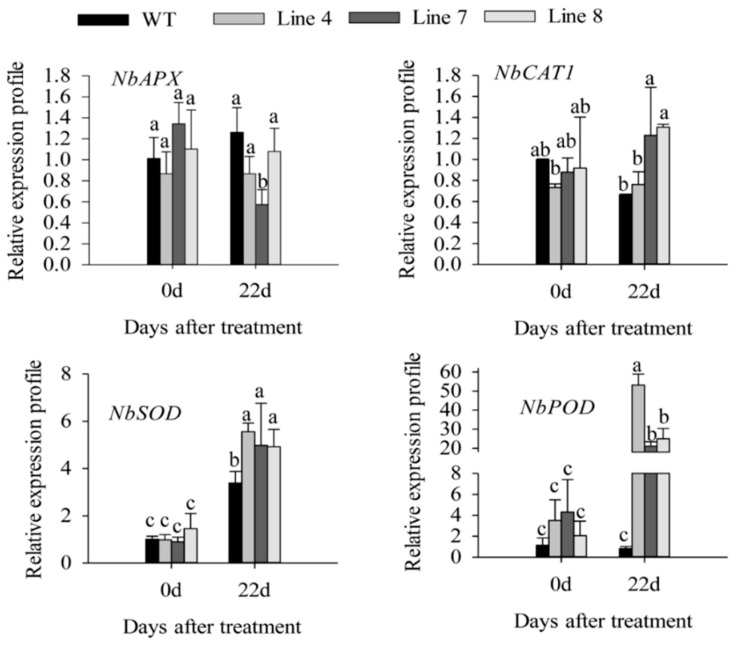
SBP-box (Squamosa-promoter binding protein) genes are a type of plant-specific transcription factor and play important roles in plant growth, signal transduction, and stress response. However, little is known about the role of pepper SBP-box transcription factor genes in response to abiotic stress. Here, one of the pepper SBP-box gene, CaSBP12, was selected and isolated from pepper genome database in our previous study. The CaSBP12 gene was induced under salt stress. Silencing the CaSBP12 gene enhanced pepper plant tolerance to salt stress. The accumulation of reactive oxygen species (ROS) of the detached leaves of CaSBP12-silenced plants was significantly lower than that of control plants. Besides, the Na+, malondialdehyde content, and conductivity were significantly increased in control plants than that in the CaSBP12-silenced plants. In addition, the CaSBP12 over-expressed Nicotiana benthamiana plants were more susceptible to salt stress with higher damage severity index percentage and accumulation of ROS as compared to the wild-type. These results indicated that CaSBP12 negatively regulates salt stress tolerance in pepper may relate to ROS signaling cascades.
Keywords: CaSBP12; Nicotiana benthamiana; pepper; reactive oxygen species; salt stress.
Conflict of interest statement
The authors declare that they have no conflict of interest.
Figures
Similar articles
-
A Novel Transcription Factor CaSBP12 Gene Negatively Regulates the Defense Response against Phytophthora capsici in Pepper (Capsicum annuum L.).Int J Mol Sci. 2018 Dec 22;20(1):48. doi: 10.3390/ijms20010048. Int J Mol Sci. 2018. PMID: 30583543 Free PMC article.
-
Pepper (Capsicum annuum L.) AP2/ERF transcription factor, CaERF2 enhances salt stress tolerance through ROS scavenging.Theor Appl Genet. 2025 Feb 3;138(2):44. doi: 10.1007/s00122-025-04823-0. Theor Appl Genet. 2025. PMID: 39899078
-
CaDHN3, a Pepper (Capsicum annuum L.) Dehydrin Gene Enhances the Tolerance against Salt and Drought Stresses by Reducing ROS Accumulation.Int J Mol Sci. 2021 Mar 22;22(6):3205. doi: 10.3390/ijms22063205. Int J Mol Sci. 2021. PMID: 33809823 Free PMC article.
-
[Advances of salt stress-responsive transcription factors in plants].Sheng Wu Gong Cheng Xue Bao. 2022 Jan 25;38(1):50-65. doi: 10.13345/j.cjb.210135. Sheng Wu Gong Cheng Xue Bao. 2022. PMID: 35142118 Review. Chinese.
-
Advances in salt tolerance molecular mechanism in tobacco plants.Hereditas. 2020 Feb 24;157(1):5. doi: 10.1186/s41065-020-00118-0. Hereditas. 2020. PMID: 32093781 Free PMC article. Review.
Cited by
-
Integration of mRNA and miRNA Analysis Reveals the Post-Transcriptional Regulation of Salt Stress Response in Hemerocallis fulva.Int J Mol Sci. 2023 Apr 14;24(8):7290. doi: 10.3390/ijms24087290. Int J Mol Sci. 2023. PMID: 37108448 Free PMC article.
-
Review of the Mechanisms by Which Transcription Factors and Exogenous Substances Regulate ROS Metabolism under Abiotic Stress.Antioxidants (Basel). 2022 Oct 25;11(11):2106. doi: 10.3390/antiox11112106. Antioxidants (Basel). 2022. PMID: 36358478 Free PMC article. Review.
-
Strategies to develop climate-resilient chili peppers: transcription factor optimization through genome editing.Planta. 2025 Jun 17;262(2):30. doi: 10.1007/s00425-025-04747-5. Planta. 2025. PMID: 40526281 Free PMC article. Review.
-
Expression analysis of miRNAs and their putative target genes confirm a preponderant role of transcription factors in the early response of oil palm plants to salinity stress.BMC Plant Biol. 2021 Nov 8;21(1):518. doi: 10.1186/s12870-021-03296-9. BMC Plant Biol. 2021. PMID: 34749653 Free PMC article.
-
Physiological and Genetic Aspects of Resistance to Abiotic Stresses in Capsicum Species.Plants (Basel). 2024 Oct 28;13(21):3013. doi: 10.3390/plants13213013. Plants (Basel). 2024. PMID: 39519932 Free PMC article. Review.
References
-
- Feng X.H., Zhang H.X., Ali M., Gai W.X., Cheng G.X., Yu Q.H., Yang S.B., Li X.X., Gong Z.H. A small heat shock protein CaHsp25.9 positively regulates heat, salt, and drought stress tolerance in pepper (Capsicum annuum L.) Plant Physiol. Biochem. 2019;142:151–162. doi: 10.1016/j.plaphy.2019.07.001. - DOI - PubMed
-
- Ngoc T., Le N., Thia H., Sao D., Nguyen M., Tuan V. Overexpression of NbWRKY79 enhances salt stress tolerance in Nicotiana benthamiana. Acta Physiol. Plant. 2017;39:121.
MeSH terms
Substances
Grants and funding
LinkOut - more resources
Full Text Sources
