. 2020 Jan 10;12(1):173.
doi: 10.3390/cancers12010173.

HB-EGF-EGFR Signaling in Bone Marrow Endothelial Cells Mediates Angiogenesis Associated with Multiple Myeloma

Affiliations

HB-EGF-EGFR Signaling in Bone Marrow Endothelial Cells Mediates Angiogenesis Associated with Multiple Myeloma

Luigia Rao et al. Cancers (Basel). .

Abstract

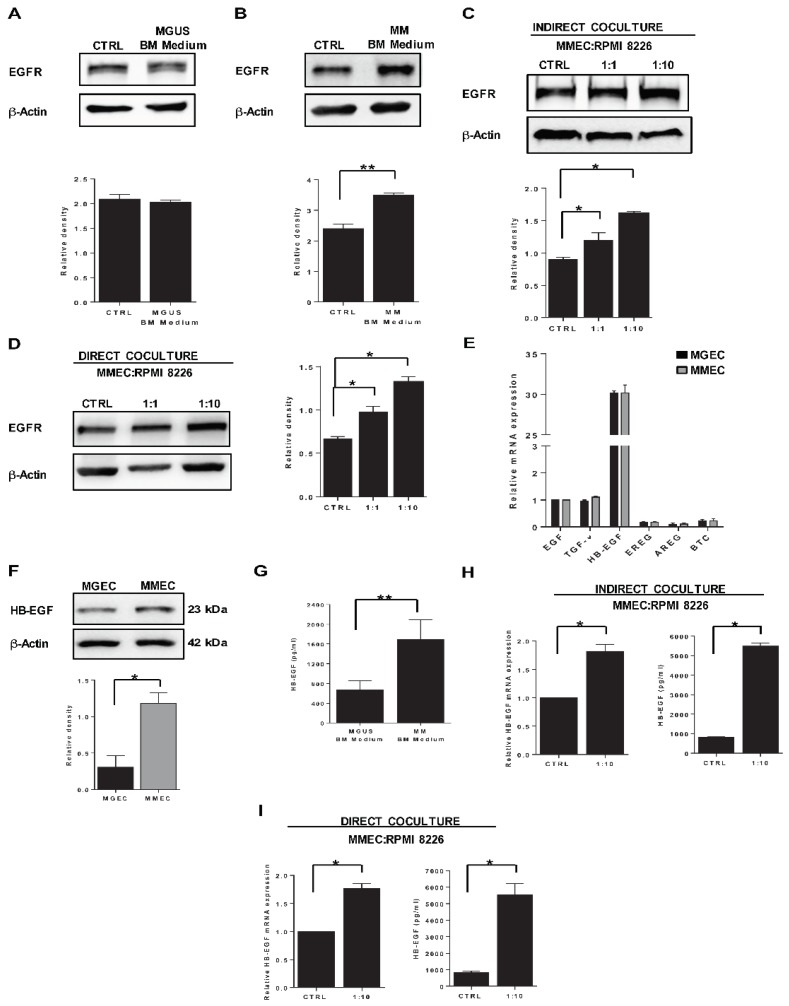
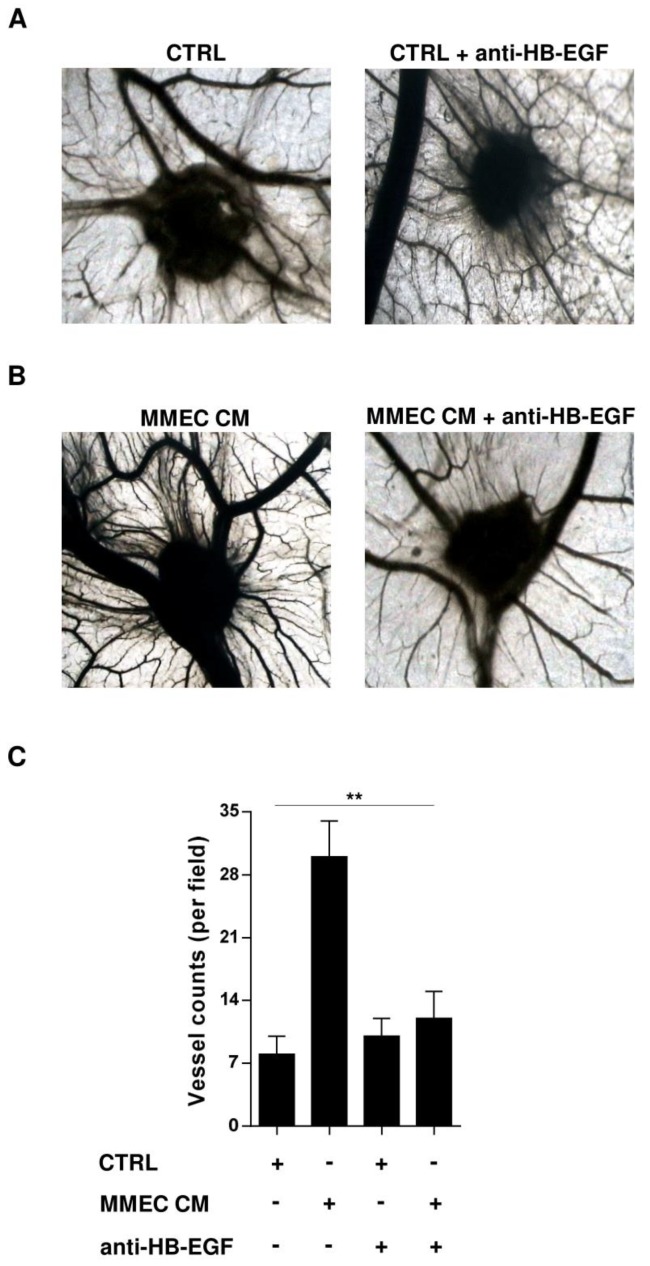
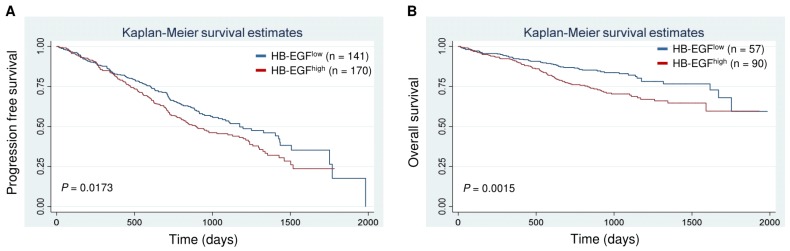
Epidermal growth factor receptor (EGFR) and its ligand heparin-binding EGF-like growth factor (HB-EGF) sustain endothelial cell proliferation and angiogenesis in solid tumors, but little is known about the role of HB-EGF-EGFR signaling in bone marrow angiogenesis and multiple myeloma (MM) progression. We found that bone marrow endothelial cells from patients with MM express high levels of EGFR and HB-EGF, compared with cells from patients with monoclonal gammopathy of undetermined significance, and that overexpressed HB-EGF stimulates EGFR expression in an autocrine loop. We also found that levels of EGFR and HB-EGF parallel MM plasma cell number, and that HB-EGF is a potent inducer of angiogenesis in vitro and in vivo. Moreover, blockade of HB-EGF-EGFR signaling, by an anti-HB-EGF neutralizing antibody or the EGFR inhibitor erlotinib, limited the angiogenic potential of bone marrow endothelial cells and hampered tumor growth in an MM xenograft mouse model. These results identify HB-EGF-EGFR signaling as a potential target of anti-angiogenic therapy, and encourage the clinical investigation of EGFR inhibitors in combination with conventional cytotoxic drugs as a new therapeutic strategy for MM.

Keywords: EGFR; HB-EGF; bone marrow angiogenesis; endothelial cells; multiple myeloma.


Conflict of interest statement

The authors declare no potential conflicts of interest.

Figures

Figure 1
Figure 1
EGFR expression is higher in bone marrow endothelial cells from MM than MGUS patients. (A) Relative mRNA levels of epidermal growth factor receptor (EGFR) in endothelial cells from MGUS and MM patients (MGEC and MMEC, respectively), determined by real time-PCR. Samples from six MGUS and six MM patients were tested in triplicate. Data are expressed as mean and SD. (B) Western blot of EGFR (using a rabbit anti-human antibody) and β-actin in whole cell lysates of MGEC and MMEC (left) and results of densitometric analysis, with EGFR values normalized first to β-actin and then to MGEC values (right). Samples from eight MGUS and eight MM patients were tested in triplicate. Values are expressed as mean and SD. (C) Immunofluorescence staining of EGFR (using a rabbit anti-human antibody; red) on cultured MGEC and MMEC (left) and quantification analysis (right). DAPI (blue) was used to stain nuclei. Control experiments without the primary antibody (omitted) showed no background staining. Representative photomicrographs of four independent experiments are shown. Original magnification 400×. Scale bar, 25 μm. The quantification of the immunofluorescence was performed by ImageJ software. (D) Immunohistochemical detection of EGFR (pink) on CD31-positive cells (brown) in bone marrow vessel walls from MGUS and MM patients. The images were analyzed by two independent pathologists in a blind fashion. Representative photomicrographs of four independent experiments are shown. Original magnification 400×. Scale bar, 25 μm. ** p < 0.01 and *** p < 0.001, Mann–Whitney U test.
Figure 2
Figure 2
Bone marrow microenvironment influences EGFR and HB-EGF expression in MMEC. Western blots of EGFR and ≥β-actin in MMEC and results of densitometric analyses of EGFR normalized to β-actin. (A,B) MMEC were maintained for 24 h in normal culture medium (CTRL) or culture medium conditioned by bone marrow mononuclear cells (BMMC) from (A) MGUS patients (MGUS BM medium) or (B) MM patients (MM BM medium). (C,D) MMEC were grown for 24 h, alone (CTRL) or in coculture with RPMI 8226 cells at 1:1 and 1:10 cell ratios, separated (C) or not (D) by Transwell inserts. All charts report data from six patients. Each sample was tested in triplicate with similar results. (E) Basal relative mRNA levels of six EGFR ligands in MGEC and MMEC, determined by real-time PCR. Values were normalized to that of EGF. Samples from six MGUS and six MM patients were tested in triplicate. (F) Western blots of HB-EGF and β-actin in MGEC and MMEC, and results of densitometry analysis of HB-EGF, normalized to β-actin. Samples from six MGUS and six MM patients were tested in triplicate. (G) ELISA determination of HB-EGF in conditioned culture medium from BMMC of 12 MGUS and 12 MM patients. (H,I) Relative HB-EGF mRNA levels (left) and ELISA determinations of soluble HB-EGF in conditioned medium (right) of MMEC cultured for 24 h, alone (CTRL) or in coculture with RPMI 8226 cells, indirectly (H) or directly (I). Samples from six patients were tested in triplicate. Values are expressed as mean and SD, * p < 0.05 and ** p < 0.01, Mann–Whitney U test.
Figure 3
Figure 3
HB-EGF stimulates in vitro MMEC migration and angiogenesis in a dose-dependent manner. (AD) Wound-healing assay. (A) Photomicrographs of MMEC in serum-free medium with increasing concentrations of soluble recombinant HB-EGF, 12 h after confluent monolayers were wounded by scraping with MMEC in serum-free medium with increasing concentrations of soluble recombinant HB-EGF. (B) Counts of migrating cells in each wound of (A), for six independent experiments. (C) MMEC were wounded and treated with serum-free medium alone or with 0.5 µg/mL neutralizing anti-HB-EGF antibody. (D) Counts of migrating cells in each wound of (C), for six independent experiments. (EH) Matrigel angiogenesis assay. (E) Photomicrographs of MMEC, 3 h after seeding on Matrigel in serum-free medium with increasing concentrations of HB-EGF. Images are representative of experiments using cells from six patients. (F) Quantification of angiogenic behavior in (E) by topological analysis. (G) MMEC were seeded on Matrigel in the absence (CTRL) or presence of 0.5 µg/mL anti-HB-EGF antibody and photographed 12 h later. Images are representative of experiments on samples from six patients. (H) Quantification of angiogenic behavior in (G) by topological analysis. Original magnification, 200×. Scale bar, 50 μm. Data are mean and SD of six independent experiments. * p < 0.05 and ** p < 0.01, Mann–Whitney U test.
Figure 4
Figure 4
HB-EGF stimulates MM-associated angiogenesis in vivo. (A,B) Representative photographs taken in ovo of the chorioallantoic membrane assay on day 12. (A) Gelatin sponges soaked with serum-free medium, alone (left, CTRL) or with 0.5 µg/mL anti-HB-EGF antibody (right). (B) Gelatin sponges soaked with MMEC-conditioned serum-free medium (left, MMEC CM) or with MMEC-conditioned serum-free medium containing 0.5 µg/mL HB-EGF antibody (right). Original magnification 50×. (C) Quantification of newly formed vessels. Results are mean and SD of three technical replicates. ** p < 0.01, Mann–Whitney U test.
Figure 5
Figure 5
Erlotinib restrains the in vitro angiogenic potential of MMEC. (A,B) Wound-healing assay. (A) Photomicrographs of MMEC in serum-free medium without (CTRL) or with 10 µM erlotinib, 24 h after wounding. (B) Counts of migrating cells in each wound of (A). (C,D) Angiogenesis assay. (C) Photomicrographs of MMEC, 12 h after seeding on Matrigel without (CTRL) or with 10 µM erlotinib. (D) Quantification of angiogenic behavior in (E) by topological analysis. (E) Western blot of MMEC transfected with no nucleotides (CTRL), 50 nM control, non-targeting siRNA, or 50 nM EGFR siRNA for 48 h, and densitometric analysis of EGFR normalized to β-actin. (F) Photomicrographs of MMEC transfected with EGFR siRNA or control non-targeting siRNA seeded on Matrigel for 12 h. Images are representative of six experiments. (G) Quantification of angiogenic behavior in (F) by topological analysis. Data are mean and SD of six independent experiments. * p < 0.05 and ** p < 0.01, Mann–Whitney U test.
Figure 6
Figure 6
Erlotinib halts in vivo angiogenesis and suppresses tumor growth in an MM xenograft mice model. Non-obese diabetic mice with severe combined immunodeficiency (NOD/SCID) bearing RPMI 8226 xenografts were treated intraperitoneally with 50 mg/kg erlotinib (n = 10) or vehicle (n = 10). (A) Representative images of mice and excised tumors. (B) Change in tumor volume over time. (C) Estimated weights of excised tumors on day 40. Data are expressed as median, interquartile range (box), and range (whiskers). (D,E) Tumor sections stained for the microvessel density marker CD31 and quantification of positively stained murine endothelial cells. (F,G) Tumor sections stained for the proliferative marker Ki-67 and quantification of positively stained nuclei. Immunohistochemical images were analyzed by two independent pathologists in a blind fashion. Immunohistochemical quantifications are the average of five slides for each tumor and five fields per slide. * p < 0.05, ** p < 0.01, *** p < 0.001, Mann–Whitney U test.
Figure 7
Figure 7
HB-EGF expression predicts survival in MM patients. Kaplan–Meier survival curves for cases in the lowest vs. highest quintiles of HB-EGF expression among 647 patients of the MMRF cohort (https://research.themmrf.org). Patients with higher HB-EGF expression have shorter progression-free survival (A) and overall survival (B) Log-rank test.

Similar articles

Cited by

References

    1. Wieduwilt M.J., Moasser M.M. The epidermal growth factor receptor family: Biology driving targeted therapeutics. Cell Mol. Life Sci. 2008;65:1566–1584. doi: 10.1007/s00018-008-7440-8. - DOI - PMC - PubMed
    1. Ellis L.M. Epidermal growth factor receptor in tumor angiogenesis. Hematol. Oncol. Clin. N. Am. 2004;18:1007–1021. doi: 10.1016/j.hoc.2004.06.002. - DOI - PubMed
    1. Normanno N., De Luca A., Bianco C., Strizzi L., Mancino M., Maiello M.R., Carotenuto A., De Feo G., Caponigro F., Salomon D.S. Epidermal growth factor receptor (EGFR) signaling in cancer. Gene. 2006;366:2–16. doi: 10.1016/j.gene.2005.10.018. - DOI - PubMed
    1. Sigismund S., Avanzato D., Lanzetti L. Emerging functions of the EGFR in cancer. Mol. Oncol. 2018;12:3–20. doi: 10.1002/1878-0261.12155. - DOI - PMC - PubMed
    1. Sasaki T., Hiroki K., Yamashita Y. The role of epidermal growth factor receptor in cancer metastasis and microenvironment. BioMed Res. Int. 2013;2013:546318. doi: 10.1155/2013/546318. - DOI - PMC - PubMed