. 2020 Jan 10;9(1):174.
doi: 10.3390/cells9010174.

Modulating Tumor-Associated Macrophage Polarization by Synthetic and Natural PPARγ Ligands as a Potential Target in Breast Cancer

Affiliations

Modulating Tumor-Associated Macrophage Polarization by Synthetic and Natural PPARγ Ligands as a Potential Target in Breast Cancer

Giulia Gionfriddo et al. Cells. .

Abstract

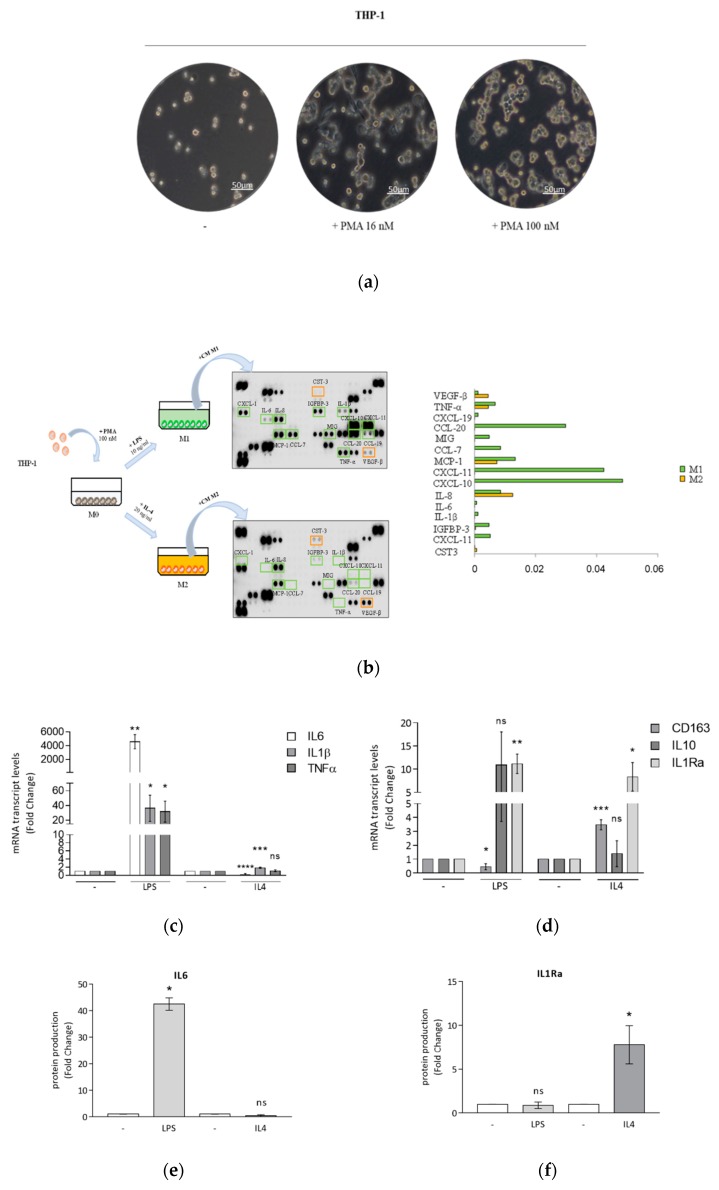
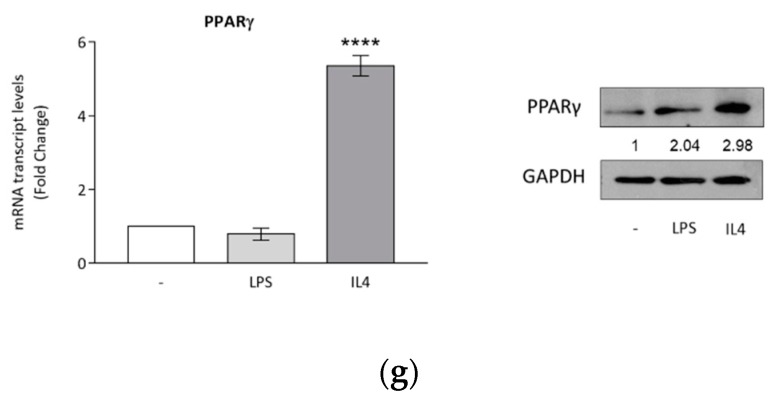
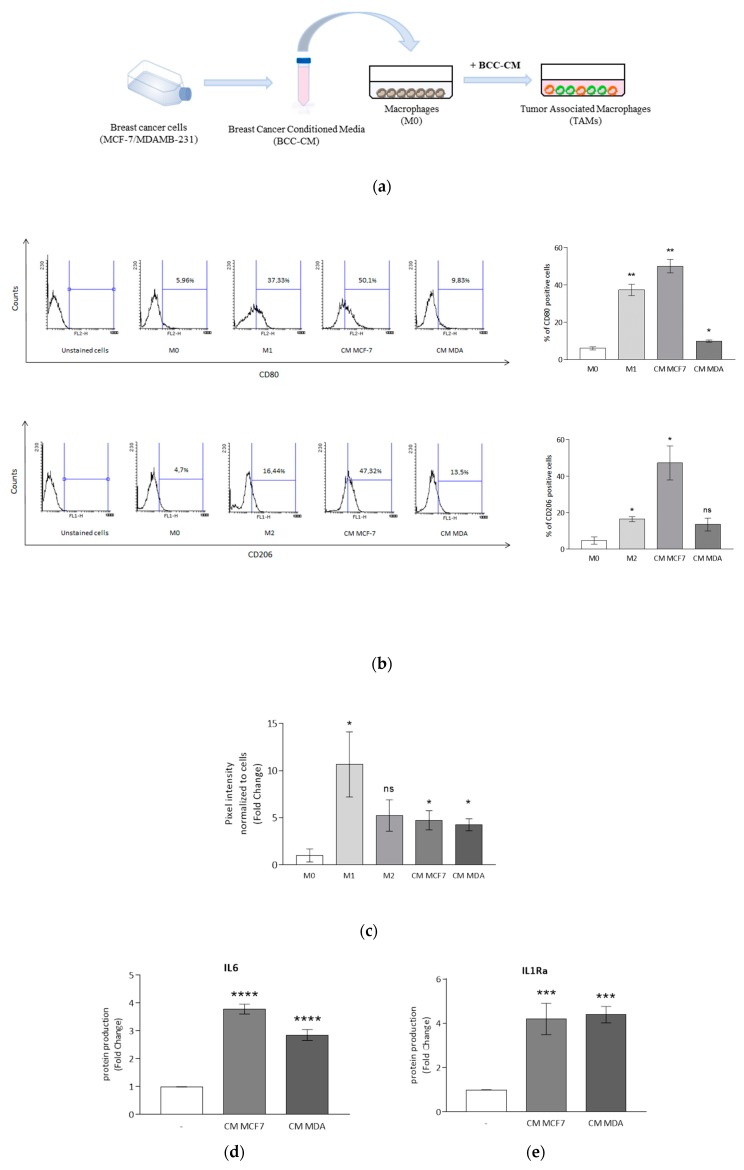
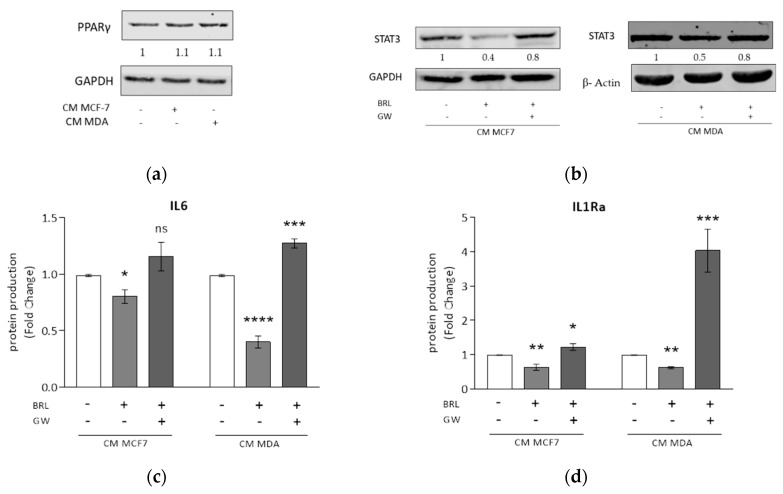
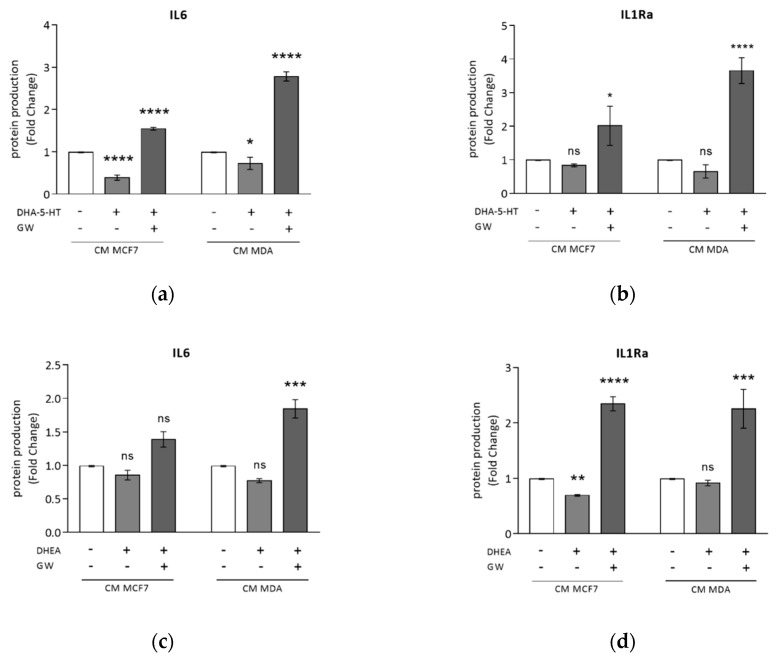
Activation of peroxisome proliferator-activated receptor gamma (PPARγ) elicits anti-proliferative effects on different tumor cells, including those derived from breast cancer. PPARγ is also expressed in several cells of the breast tumor microenvironment, among which tumor associated macrophages (TAMs) play a pivotal role in tumor progression and metastasis. We explored the ability of synthetic and natural PPARγ ligands to modulate TAM polarization. The ligands included rosiglitazone (BRL-49653), and two docosahexaenoic acid (DHA) conjugates, N-docosahexaenoyl ethanolamine (DHEA) and N-docosahexaenoyl serotonin (DHA-5-HT). Human THP-1 monocytic cells were differentiated into M0, M1 and M2 macrophages that were characterized by qRT-PCR, ELISA and western blotting. A TAM-like phenotypic state was generated by adding two different breast cancer cell conditioned media (BCC-CM) to the cultures. Macrophages exposed to BCC-CM concomitantly exhibited M1 and M2 phenotypes. Interestingly, rosiglitazone, DHEA and DHA-5-HT attenuated cytokine secretion by TAMs, and this effect was reversed by the PPARγ antagonist GW9662. Given the key role played by PPARγ in the crosstalk between cancer cells and TAMs in tumor progression, its activation via endogenous or synthetic ligands may lead to novel strategies that target both epithelial neoplastic cells and the tumor microenvironment.

Keywords: breast tumor microenvironment; docosahexaenoyl ethanolamine (DHEA); docosahexaenoyl serotonin (DHA-5-HT); n-3 polyunsaturated fatty acids; peroxisome proliferator-activated receptor gamma; rosiglitazone; tumor associated macrophages.


Conflict of interest statement

The authors declare no conflict of interest.

Figures

Figure 1
Figure 1
Differentiation and polarization of THP-1 monocytes. (a) Representative bright field images by optical microscopy of morphological changes in THP-1 monocytes (-) differentiated into mature macrophages M0 in the presence of 16 nM or 100 nM PMA for 24 h. The scale bar represents 50 μm. (b) Macrophages derived from the stimulation with PMA 100 nM (M0), after replacement of PMA-containing medium with fresh medium (without PMA) for 1 day, were treated with LPS 10 ng/mL or IL4 20 ng/mL for 24 h to obtain M1 and M2 macrophages, respectively. Human cytokine arrays were used for the detection of secreted proteins in conditioned media derived from M1 and M2 macrophages after 24 h of polarization. Raw numerical densitometry data were extracted and the background subtracted. Results were shown as mean pixel density. Real-time RT-PCR of M1 markers IL6, IL1β, TNFα (c) and M2 markers CD163, IL10 and IL1Ra (d) in M0 macrophages (-) treated with LPS 10 ng/mL for 6 h or IL4 20 ng/mL for 72 h. Each sample was normalized on its RPS27A mRNA content. ELISA analyses of IL6 (e) and IL1Ra (f) proteins were performed in conditioned media of polarized macrophages. Values represent means ± SDs of three different experiments, each performed with duplicate samples. Results are expressed as fold changes compared to M0 macrophages (-). (g) Real-time RT-PCR and immunoblotting of PPARγ in M0 macrophages (-) treated with LPS 10 ng/mL or IL4 20 ng/mL for 24 h. Each sample was normalized on its 18S RNA content. Glyceraldehyde-3-phosphate dehydrogenase (GAPDH) was used as a loading control. Numbers below the blots represent the average fold change between PPARγ and GAPDH protein expression versus M0 macrophages. Results are expressed as fold changes compared to M0 macrophages, * p < 0.05, ** p < 0.005, *** p < 0.0005, **** p < 0.0001, ns = not significant.
Figure 1
Figure 1
Differentiation and polarization of THP-1 monocytes. (a) Representative bright field images by optical microscopy of morphological changes in THP-1 monocytes (-) differentiated into mature macrophages M0 in the presence of 16 nM or 100 nM PMA for 24 h. The scale bar represents 50 μm. (b) Macrophages derived from the stimulation with PMA 100 nM (M0), after replacement of PMA-containing medium with fresh medium (without PMA) for 1 day, were treated with LPS 10 ng/mL or IL4 20 ng/mL for 24 h to obtain M1 and M2 macrophages, respectively. Human cytokine arrays were used for the detection of secreted proteins in conditioned media derived from M1 and M2 macrophages after 24 h of polarization. Raw numerical densitometry data were extracted and the background subtracted. Results were shown as mean pixel density. Real-time RT-PCR of M1 markers IL6, IL1β, TNFα (c) and M2 markers CD163, IL10 and IL1Ra (d) in M0 macrophages (-) treated with LPS 10 ng/mL for 6 h or IL4 20 ng/mL for 72 h. Each sample was normalized on its RPS27A mRNA content. ELISA analyses of IL6 (e) and IL1Ra (f) proteins were performed in conditioned media of polarized macrophages. Values represent means ± SDs of three different experiments, each performed with duplicate samples. Results are expressed as fold changes compared to M0 macrophages (-). (g) Real-time RT-PCR and immunoblotting of PPARγ in M0 macrophages (-) treated with LPS 10 ng/mL or IL4 20 ng/mL for 24 h. Each sample was normalized on its 18S RNA content. Glyceraldehyde-3-phosphate dehydrogenase (GAPDH) was used as a loading control. Numbers below the blots represent the average fold change between PPARγ and GAPDH protein expression versus M0 macrophages. Results are expressed as fold changes compared to M0 macrophages, * p < 0.05, ** p < 0.005, *** p < 0.0005, **** p < 0.0001, ns = not significant.
Figure 2
Figure 2
Macrophage polarization induced by breast cancer cells. (a) Conditioned media from breast cancer cells (BCC-CM) incubated in serum-free medium for 48 h were collected and added to M0 macrophages for 72 h to obtain tumor-associated macrophages (TAMs). (b) Flow cytometry analyses of M1 marker CD80 and M2 marker CD206 in M0, M1 and M2 macrophages and in M0 cells incubated with CM MCF7 or CM MDA for 72 h. The bars represent the percentages of positive cells. * p < 0.05, ** p < 0.005 versus M0 macrophages. (c) Phagocytic activity of M0, M1 and M2 macrophages and M0 cells incubated with CM MCF7 or CM MDA for 72 h following incubation with latex beads conjugated with FITC-IgG for 2 h. Pixel intensity of FITC labeled beads was normalized to number of cells and results are expressed as fold change respect to M0. ELISA analyses of IL6 (d) and IL1Ra (e) in M0 macrophages (-) incubated with CM MCF7 or CM MDA for 72 h. Values represent means ± SDs of three different experiments, each performed with duplicate samples. The results are expressed as fold change with respect to differentiated cells. * p < 0.05, ** p < 0.005, *** p < 0.0005, **** p < 0.0001, ns = not significant.
Figure 3
Figure 3
Rosiglitazone antagonizes macrophage cytokine secretion induced by conditioned media derived from MCF7 and MDA-MB-231 breast cancer cells. (a) Immunoblotting of PPARγ in M0 macrophages (-) incubated with CM MCF7 or CM MDA for 72 h. Glyceraldehyde-3-phosphate dehydrogenase (GAPDH) was used as loading control. The blot is representative of three independent experiments, while the numbers below the blots represent the average fold change between PPARγ and GAPDH protein expression with respect to M0 macrophages. (b) Immunoblotting of STAT3 in M0 macrophages incubated with CM MCF7 or CM MDA and treated with rosiglitazone (BRL) 10 μM alone or in combination with GW9662 (GW) 10 μM for 72 h. GAPDH or β-actin was used as the loading control. Each blot is representative of three independent experiments, while the numbers below the blots represent the average fold change between STAT3 and GAPDH or β-actin protein expression with respect to vehicle-treated cells. ELISA analyses of IL6 (c) and IL1Ra (d) proteins in M0 macrophages incubated with CM MCF7 or CM MDA, and treated with BRL 10 μM alone or in combination with GW 10 μM for 72 h. Data are expressed as means ± SDs of three independent experiments, each performed with duplicate samples. The results are expressed as fold changes with respect to vehicle-treated cells (-). * p < 0.05, ** p < 0.005, *** p < 0.0005, **** p < 0.0001, ns = not significant.
Figure 4
Figure 4
DHA-5-HT and DHEA counteract TAM cytokine secretion induced by MCF7 and MDA-MB-231 breast cancer cell conditioned media. ELISA analyses of IL6 (a,c) and IL1Ra (b,d) in M0 macrophages incubated with CM MCF7 or CM MDA, and treated with DHA-5-HT 1 μM (a,b), DHEA 5 μM (c and d) or a combination with GW9662 (GW) (a–d) for 72 h. Data are expressed as means ± SDs. Each experiment was performed three times with duplicate samples. The results are expressed as fold changes with respect to vehicle-treated cells (-).* p < 0.05, ** p < 0.005, *** p < 0.0005, **** p < 0.0001, ns = not significant.

Similar articles

Cited by

References

    1. Bray F., Ferlay J., Soerjomataram I., Siegel R.L., Torre L.A., Jemal A. Global Cancer Statistics 2018: GLOBOCAN Estimates of Incidence and Mortality Worldwide for 36 Cancers in 185 Countries. CA Cancer J. Clin. 2018;68:394–424. doi: 10.3322/caac.21492. - DOI - PubMed
    1. Vogelstein B., Kinzler K.W. Cancer genes and the pathways they control. Nature Med. 2004;10:789–799. doi: 10.1038/nm1087. - DOI - PubMed
    1. Ting A.H., McGarvey K.M., Baylin S.B. The cancer epigenome—Components and functional correlates. Genes Dev. 2006;20:3215–3231. doi: 10.1101/gad.1464906. - DOI - PubMed
    1. Woutersen R.A., Appel M.J., van Garderen-Hoetmer A., Wijnands M.V. Dietary fat and carcinogenesis. Mutat. Res. 1999;443:111–127. doi: 10.1016/S1383-5742(99)00014-9. - DOI - PubMed
    1. Willett W.C. Diet and cancer: One view at the start of the millennium. Cancer Epidemiol. Biomark. Prev. 2001;10:3–8. - PubMed

Publication types

MeSH terms