. 2020 Jan 10;8(1):21.
doi: 10.3390/vaccines8010021.

Synthetic DNA Vaccines Adjuvanted with pIL-33 Drive Liver-Localized T Cells and Provide Protection from Plasmodium Challenge in a Mouse Model

Affiliations

Synthetic DNA Vaccines Adjuvanted with pIL-33 Drive Liver-Localized T Cells and Provide Protection from Plasmodium Challenge in a Mouse Model

Sophia M Reeder et al. Vaccines (Basel). .

Abstract

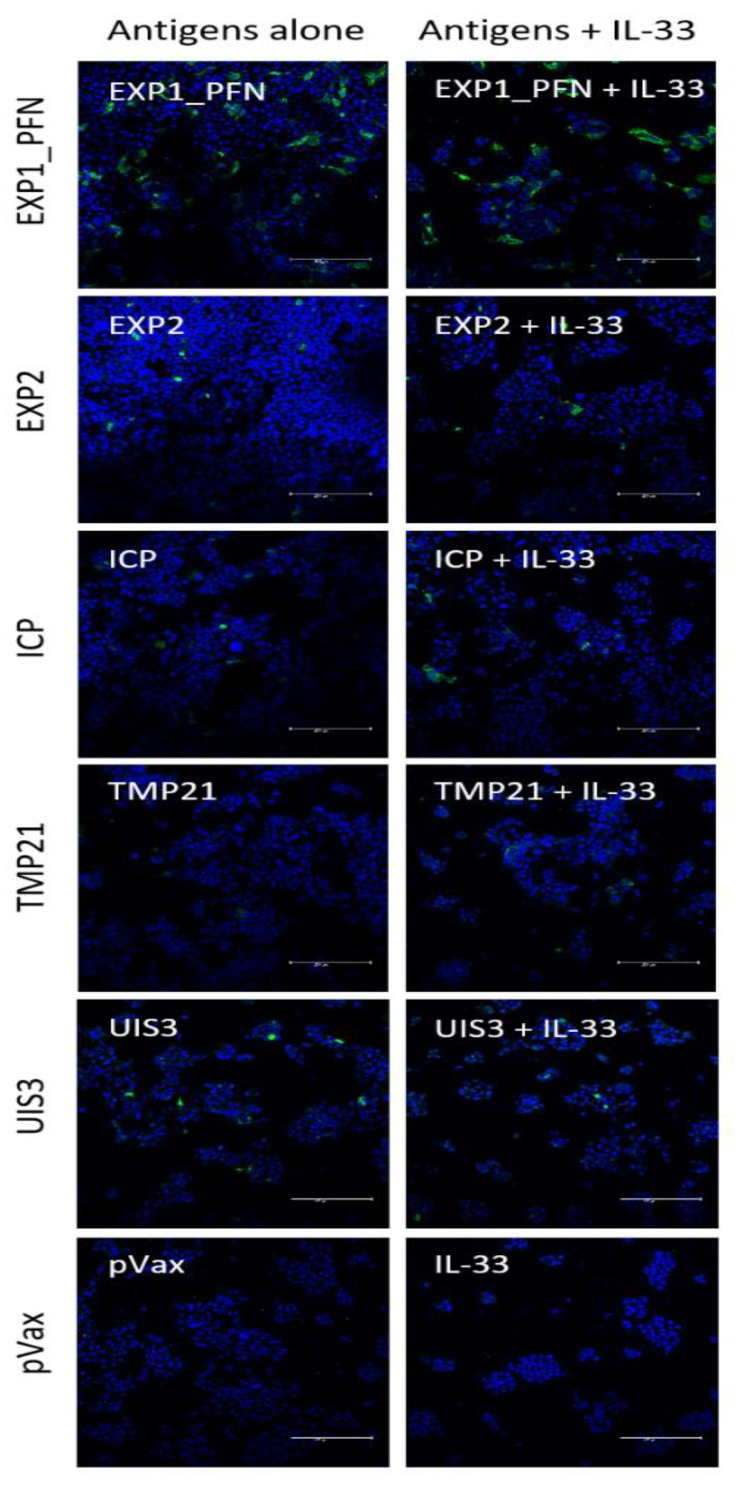
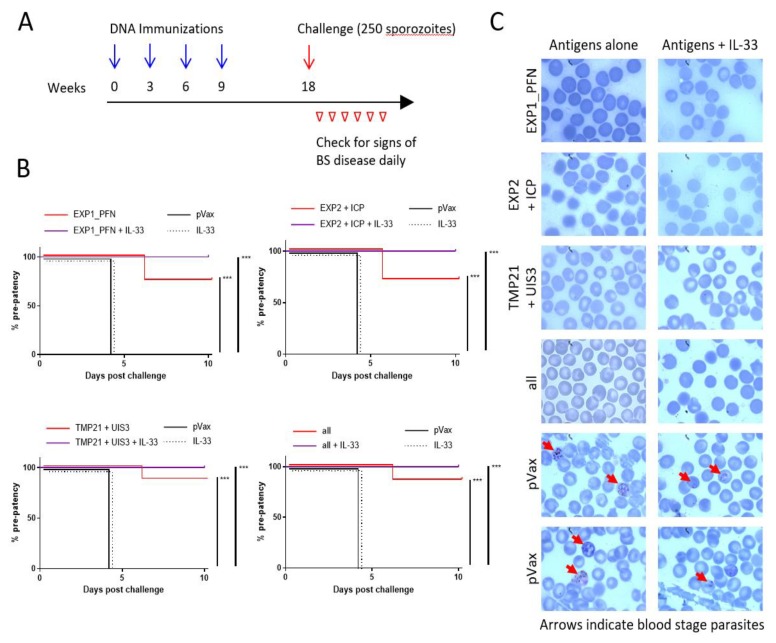
The need for a malaria vaccine is indisputable. A single vaccine for Plasmodium pre-erythrocytic stages targeting the major sporozoite antigen circumsporozoite protein (CSP) has had partial success. Additionally, CD8+ T cells targeting liver-stage (LS) antigens induced by live attenuated sporozoite vaccines were associated with protection in human challenge experiments. To further evaluate protection mediated by LS antigens, we focused on exported pre-erythrocytic proteins (exported protein 1 (EXP1), profilin (PFN), exported protein 2 (EXP2), inhibitor of cysteine proteases (ICP), transmembrane protein 21 (TMP21), and upregulated in infective sporozoites-3 (UIS3)) expressed in all Plasmodium species and designed optimized, synthetic DNA (synDNA) immunogens. SynDNA antigen cocktails were tested with and without the molecular adjuvant plasmid IL-33. Immunized animals developed robust T cell responses including induction of antigen-specific liver-localized CD8+ T cells, which were enhanced by the co-delivery of plasmid IL-33. In total, 100% of mice in adjuvanted groups and 71%-88% in non-adjuvanted groups were protected from blood-stage disease following Plasmodium yoelii sporozoite challenge. This study supports the potential of synDNA LS antigens as vaccine components for malaria parasite infection.

Keywords: DNA vaccines; Plasmodium; exported proteins; liver stage; malaria.


Conflict of interest statement

The authors declare the following conflicts of interest: D.B.W. reports receiving commercial research funding from Inovio, Geneos, and GeneOne; has received speakers bureau honoraria from AstraZeneca, Roche and Merck; has ownership interest in Inovio; and is a consultant/board member for Inovio. L.H. is an employee of Inovio Pharmaceuticals. No potential conflicts of interests were disclosed by the other authors.

Figures

Figure 1
Figure 1
DNA vaccine construct design and in vitro expression. (A) Schematic diagram of Plasmodium yoelii (Py) gene inserts used to generate the codon-optimized DNA vaccine constructs. The schematic details leader sequence (IgE), gene insert, and presence or absence of HA tag. All constructs except for EXP1_PFN (exported protein 1_profilin) contain an HA tag. (B) Expression of Py proteins detected by SDS-polyacrylamide gel electrophoresis and western blot of lysate from transfected 293T cells. Protein expression was detected by probing for the HA tag when present with an anti-HA antibody, or with immune sera from immunized mice for the EXP1_PFN plasmid. GFP is included as a negative control.
Figure 2
Figure 2
Functional profile of cellular immune responses elicited by individual Py DNA vaccines in mice. Mice were immunized 4 times at 3-week intervals with the indicated constructs. Splenocytes were collected 1 week after the final immunization. (A) The Py antigen-specific cellular immune response measured by IFNγ ELISPOT of splenocytes 1 week after final immunization with the indicated vaccine. Cells were stimulated for 18 h with peptide pools encompassing the entire protein. A one-way ANOVA with Dunnet’s multiple comparison test was used to compare each vaccine group to the pVax control group. (B,C) The Py antigen-specific cytokine production profile of CD4+ (B) and CD8+ (C) T cells from spleens 1 week after final immunization with the indicated vaccine. Cells were stimulated with pooled peptides for 6 h, stained for intracellular production of IFNγ, TNFα, and IL-2, and then analyzed by flow cytometry. The bar graph shows subpopulations of mono-, double-, and triple-positive CD4+ and CD8+ T cells. A two-way ANOVA with Tukey’s multiple comparisons test was used to compare cytokine production between each vaccine group and the pVax control group. Asterix color indicates which cytokines were significantly different between vaccine and control. * = p < 0.05, ** p < 0.01, *** = p < 0.001, and **** = p < 0.0001. Values represent the mean responses in each group (n = 5) ± SEM.
Figure 3
Figure 3
Functional profile of cellular immune responses elicited by co-formulated Py DNA vaccines in mice. Mice were immunized 4 times at 3-week intervals with the indicated co-formulation of vaccine constructs with and without plasmid IL-33. Splenocytes were collected 1 week after the final immunization. Immunization groups were: All vaccine constructs with or without IL-33, EXP1_PFN (exported protein 1_profilin) with or without IL-33, EXP2 (exported protein 2) and ICP (inhibitor of cysteine proteases) with or without IL-33, and TMP21 (transmembrane protein 21) and UIS3 (upregulated in infective sporozoites-3) with or without IL-33. (A) The Py antigen-specific cellular immune response induced by the indicated Py DNA vaccine co-formulation measured by IFNγ ELISPOT. Cells were stimulated for 18 h with peptide pools encompassing the entire protein. T-tests were used to compare groups with and without IL-33. (BI) The Py antigen-specific cytokine production profile of CD4+ (DF) and CD8+ (GI) T cells induced by the indicated Py DNA vaccine co-formulation. Cells were stimulated with pooled peptides for 6 h, stained for intracellular production of IFNγ, TNFα, and IL-2, and then analyzed by flow cytometry. The bar graph shows subpopulations of mono-, double-, and triple-positive CD4+ and CD8+ T cells. Two-way ANOVAs with Tukey’s multiple comparison test were used to compare vaccine groups against the same group adjuvanted with IL-33. Asterix color represents the corresponding cytokine groups. * = p < 0.05, ** p < 0.01, *** = p < 0.001, and **** = p < 0.0001. Values represent the mean responses in each group (n = 5) ± SEM.
Figure 4
Figure 4
Synthetic DNA vaccines drive antigen-specific liver resident T cells. Mice were immunized 3 times at 3-week intervals with the EXP1_PFN vaccine construct with and without plasmid IL-33. Lymphocytes were isolated from liver and spleen 1 week after the final immunization. (A,B) The proportion of liver resident/homing CD8+ T cells. Lymphocytes from liver (A) or spleen (B) were stained for extracellular CXCR6 and analyzed by flow cytometry. Paired t-tests were used to compare the percent CXCR6 positivity on CD3+CD8+ T cells across vaccine groups and against the pVax control. (C,D) The Py antigen-specific cellular immune response in liver (C) and spleen (D) measured by IFNγ ELISPOT. Cells were stimulated for 18 h with peptide pools encompassing the entire protein. T-tests were performed to compare IFNγ production across vaccination groups and against the pVax control. The Py antigen-specific cytokine production profile of CD4+ (E,G) and CD8+ (F,H) T cells from the liver (E,F) and spleen (G,H). Cells were stimulated with pooled peptides for 6 h, stained for intracellular production of IFNγ, TNFα, and IL-2, and then analyzed by flow cytometry. The bar graph shows subpopulations of mono-, double-, and triple-positive CD4+ and CD8+ T cells. Two-way ANOVAs with Tukey’s multiple comparison test were used to compare cytokine production across vaccination groups and against the pVax control. * = p < 0.05, ** p < 0.01, *** = p < 0.001, and **** = p < 0.0001. The pie chart shows the proportion of each cytokine subpopulation. Values represent the mean responses in each group (n = 5) ± SEM.
Figure 5
Figure 5
Antibodies elicited by Py DNA vaccines in mice. Hepa1–6 cells were transfected with the DNA vaccine construct listed on the left. Cells were then probed with pooled mouse post-immune sera collected 1 week after the last immunization. An anti-mouse-IgG-AF488 was used as a secondary antibody to detect the presence of anti-Py antigen antibodies. DAPI staining shows cell nuclei. White text in the top left corner of each field indicates post-immune sera vaccine group.
Figure 6
Figure 6
DNA vaccine expressing Py LS antigens provides protection from blood-stage disease after sporozoite challenge. (A) Vaccine and challenge timeline. BALB/cJ mice were immunized 4 times at 3-week intervals with the indicated vaccine co-formulations. Immunization groups were: EXP1_PFN with or without IL-33, EXP2 and ICP with or without IL-33, TMP21 and UIS3 with or without IL-33, and all vaccine constructs together with or without IL-33. Mice were then challenged by injection of 250 P. yoelii sporozoites. Blood smears were examined daily for signs of blood-stage disease. (B) Survival curves showing protection from evidence of blood stage parasites. Log-rank tests were used to compare groups and p-values less than the Bonferroni-corrected threshold are indicated. *** = p < 0.001. (C) Example blood smears from each group. Red arrows indicate blood stage parasites. All antigen immunized groups with and without IL-33 were n = 7 or 8. pVax and IL-33 groups were n = 5. See Supplementary Table S1 for more details.

Similar articles

Cited by

References

    1. Price R.N., Tjitra E., Guerra C.A., Yeung S., White N.J., Anstey N.M. Vivax malaria: Neglected and not benign. Am. J. Trop. Med. Hyg. 2007;77:79–87. doi: 10.4269/ajtmh.2007.77.79. - DOI - PMC - PubMed
    1. Aly A.S.I., Vaughan A.M., Kappe S.H.I. Malaria Parasite Development in the Mosquito and Infection of the Mammalian Host. Annu. Rev. Microbiol. 2009;63:195–221. doi: 10.1146/annurev.micro.091208.073403. - DOI - PMC - PubMed
    1. Vaughan A.M., Aly A.S.I., Kappe S.H.I. Malaria Parasite Pre-Erythrocytic Stage Infection: Gliding and Hiding. Cell Host Microbe. 2008;4:209–218. doi: 10.1016/j.chom.2008.08.010. - DOI - PMC - PubMed
    1. Kaushansky A., Kappe S.H.I. The crucial role of hepatocyte growth factor receptor during liver-stage infection is not conserved among Plasmodium species. Nat. Med. 2011;17:1180. doi: 10.1038/nm.2456. - DOI - PMC - PubMed
    1. Kaushansky A., Ye A.S., Austin L.S., Mikolajczak S.A., Vaughan A.M., Camargo N., Metzger P.G., Douglass A.N., MacBeath G., Kappe S.H.I. Suppression of Host p53 Is Critical for Plasmodium Liver-Stage Infection. Cell Rep. 2013;3:630–637. doi: 10.1016/j.celrep.2013.02.010. - DOI - PMC - PubMed