. 2020 Jan;10(1):190221.
doi: 10.1098/rsob.190221. Epub 2020 Jan 15.

A practical view of fine-mapping and gene prioritization in the post-genome-wide association era

Affiliations

A practical view of fine-mapping and gene prioritization in the post-genome-wide association era

R V Broekema et al. Open Biol. 2020 Jan.

Abstract

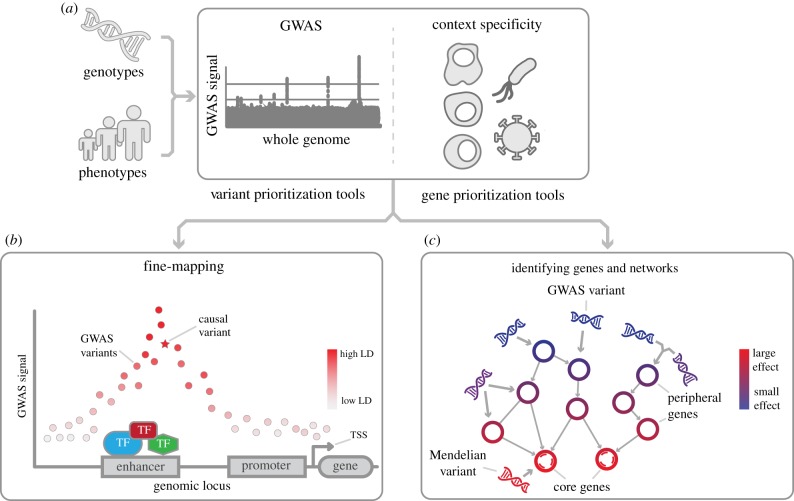
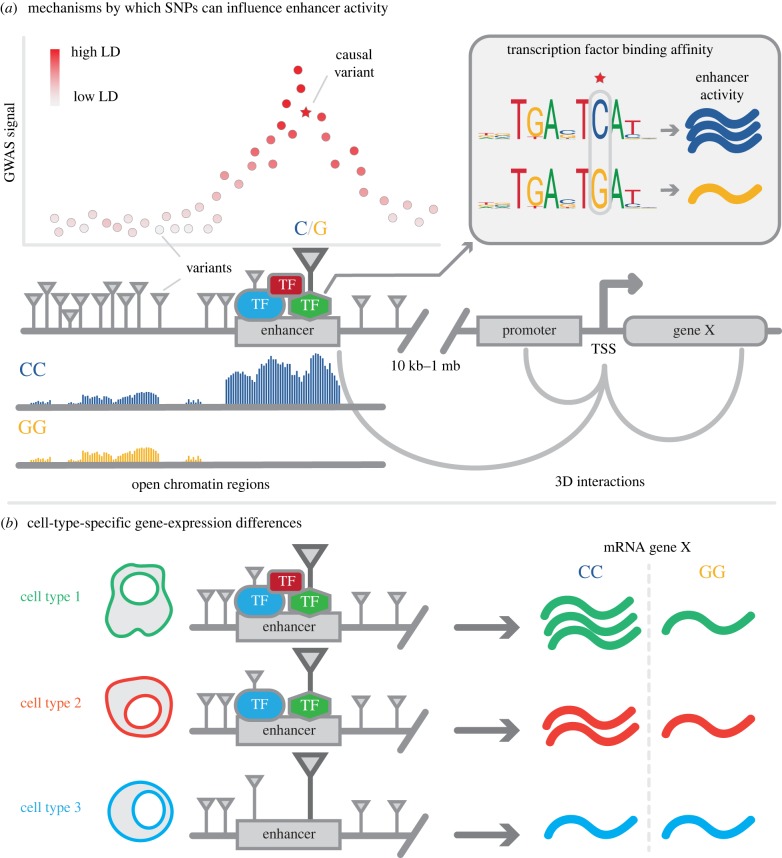
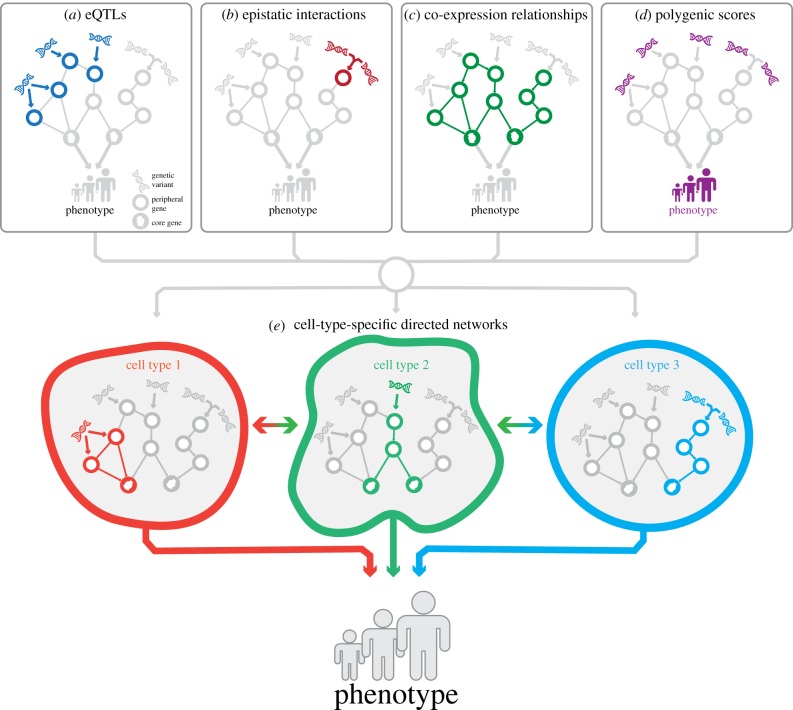
Over the past 15 years, genome-wide association studies (GWASs) have enabled the systematic identification of genetic loci associated with traits and diseases. However, due to resolution issues and methodological limitations, the true causal variants and genes associated with traits remain difficult to identify. In this post-GWAS era, many biological and computational fine-mapping approaches now aim to solve these issues. Here, we review fine-mapping and gene prioritization approaches that, when combined, will improve the understanding of the underlying mechanisms of complex traits and diseases. Fine-mapping of genetic variants has become increasingly sophisticated: initially, variants were simply overlapped with functional elements, but now the impact of variants on regulatory activity and direct variant-gene 3D interactions can be identified. Moreover, gene manipulation by CRISPR/Cas9, the identification of expression quantitative trait loci and the use of co-expression networks have all increased our understanding of the genes and pathways affected by GWAS loci. However, despite this progress, limitations including the lack of cell-type- and disease-specific data and the ever-increasing complexity of polygenic models of traits pose serious challenges. Indeed, the combination of fine-mapping and gene prioritization by statistical, functional and population-based strategies will be necessary to truly understand how GWAS loci contribute to complex traits and diseases.

Keywords: causal variants and genes; complex traits; fine-mapping; genome-wide association study; polygenic diseases; single-nucleotide polymorphisms.


Conflict of interest statement

We declare we have no competing interests.

Figures

Figure 1.
Figure 1.
Outline of the current post-GWAS workflow. (a) First, the correct context needs to be identified for the trait under study. (b) Subsequently, causal variants can be fine-mapped to better understand the fundamental mechanisms of transcription. Here, the causal variant (star) is not the strongest GWAS signal, but rather a variant in strong LD with the top effect located in an active enhancer region. (c) To gain insights into the biological processes leading to the phenotype, genes can be prioritized and causal networks constructed. GWAS variants are generally common in the population and have smaller effect sizes (blue). Thus, the genes that they impact are more likely to have a small effect on the phenotype as well (peripheral genes). The genes on which many peripheral genes converge (core genes) generally have stronger effects (red) on the phenotype. As such, the variants that affect core genes are more likely to be Mendelian disease variants.
Figure 2.
Figure 2.
An illustrative depiction of a GWAS locus showing example mechanisms by which variant effects on enhancer activity and gene expression can be detected. (a) Many trait-associated variants are shown with varying LD strength (scatterplot) when compared with the GWAS-identified marker variant (in black). In this example, the causal variant is located in an allele-dependent active enhancer (C-allele, caQTL) as shown by the open chromatin regions of the same locus (peak-density plot below the variant). The variant affects the TF binding site of the green TF with a strong binding preference for the C-allele, as shown by the enhancer activity in the ‘transcription factor binding affinity’ box. In addition, using 3D interactions (grey arches connecting the gene, promoter and enhancer), physical contact with the nearby ‘Gene X’ indicates the enhancer affects the gene's expression. (b) To highlight cell-type-specific effects, the influence of the causal variant is depicted in three cell types with varying TF availability. The mRNA expression of ‘gene X’ is stronger for the CC-genotype compared with the GG-genotype because of the increased TF binding affinity to the green TF (as shown in a). This mRNA expression remains low but stable for the GG-genotype in all three cell types regardless of the TF availability but decreases for the CC-genotype in cell types with reduced TF availability, which reduces cooperative TF binding.
Figure 3.
Figure 3.
Aspects of fine-mapping genes from GWAS loci. (a) Using eQTLs (dark blue) and CRISPRi/a-based assays, GWAS loci can be linked to genes when using the correct context. (b) Not every relationship between genetics and expression can be described additively. Epistatic effects (dark red) describe a relationship where two (or more) mutations are needed to arrive at the phenotype. (c) Using co-expression, regulatory relationships between genes can be quantified, but the specific role of genetics in these relationships is unknown. (d) Using PGSs, the joint effects of GWAS loci can be assessed, sacrificing resolution to obtain higher-level insights into the pathways affected by the genetics associated with a phenotype. (e) When assessed at single-cell resolution, the total network can be deconstructed into the cell-type relevant components. Affected cells can subsequently display an altered interaction with other cells within a tissue or individual, leading to a changed tissue- or individual-wide outcome for a phenotype.

References

    1. Morahan G, et al. 2011. Tests for genetic interactions in type 1 diabetes linkage and stratification analyses of 4,422 affected sib-pairs. Diabetes 60, 1030–1040. (10.2337/db10-1195) - DOI - PMC - PubMed
    1. Trynka G, et al. 2011. Dense genotyping identifies and localizes multiple common and rare variant association signals in celiac disease. Nat. Genet. 43, 1193–1201. (10.1038/ng.998m) - DOI - PMC - PubMed
    1. Yengo L, et al. 2018. Meta-analysis of genome-wide association studies for height and body mass index in ∼700 000 individuals of European ancestry. Hum. Mol. Genet. 27, 3641–3649. (10.1093/hmg/ddy271) - DOI - PMC - PubMed
    1. Slatkin M. 2008. Linkage disequilibrium—understanding the evolutionary past and mapping the medical future. Nat. Rev. Genet. 9, 477–485. (10.1038/nrg2361) - DOI - PMC - PubMed
    1. Ozaki K, et al. 2002. Functional SNPs in the lymphotoxin-α gene that are associated with susceptibility to myocardial infarction. Nat. Genet. 32, 650–654. (10.1038/ng1047) - DOI - PubMed

Publication types